Why Tower Semiconductor Emerges as a Compelling Choice for Reliance

Mukesh Ambani-owned Reliance Technologies is going big on AI. Last week, it announced a major partnership with NVIDIA to develop India’s foundational large language model trained on the nation’s diverse languages. NVIDIA will provide access to Reliance with GH200 Grace Hopper Superchip and NVIDIA DGX Cloud for exceptional performance.

The partnership points towards Reliance’s big ambition to emerge as a key player in the AI space and later in the semiconductor industry. The Indian conglomerate is also heading in the same direction. Last year, it was reported that Reliance, along with HCL Technologies, was planning to acquire stakes in the International Semiconductor Consortium (ISMC), a collaborative effort between UAE’s Next Orbit Ventures and Israel’s Tower Semiconductor.

The fate of the ISMC consortium was dependent on Intel’s acquisition of Tower Technologies, however, since Intel’s attempt to acquire Tower did not materialise within the expected timeframe, it is highly probable that the ISMC consortium has been dissolved or is no longer viable. Now, Reliance Industries is possibly in talks with a foreign chipmaker to set up a semiconductor fab in the country, Reuters reported.

So far, the name of the foreign chipmaker that Reliance is in talks with, has not been revealed. But given that Reliance was already in discussions to acquire stakes in the ISMC consortium, it would be logical for them to pursue the acquisition of Tower Technologies, especially considering the Intel deal did not materialise.

Reliance should look at Tower

Mampazhy told AIM that Intel’s inability to acquire Tower Semiconductor presents an opportunity for Indian businesses like Reliance that are looking to expand into the semiconductor space. The primary reason Reliance should look at acquiring Tower Semiconductor is solely because it is available for grabs.

Intel’s deal to acquire Tower was valued at USD 5.4 billion. At this price point, the acquisition will give Reliance Industries an established semiconductor manufacturing company, allowing it to enter the semiconductor industry with an existing infrastructure, expertise, and customer base.

Mampazhy believes that given Reliance’s financial might, it can opt for buying out Tower Semiconductor and open a branch fab in India. “Another viable option is for Reliance to acquire stakes in Tower and accompanied by an agreement from the company to make substantial investments in the Indian semiconductor industry,” he said.

Last year, Tower Semiconductor, as part of the ISMC consortium, entered into a Memorandum of Understanding (MoU) with the Karnataka government to establish a 65nm technology node analog fabrication facility. But the plan was shelved after the fall of the Intel-Tower deal. Considering Tower Semiconductor’s prior interest and the dissolution of the ISMC consortium, Reliance Industries might rekindle Tower’s initial enthusiasm for establishing a presence in India.

Tower to benefit as well

Not only Reliance but also Tower Semiconductor stands to gain substantially from a prospective arrangement with Reliance or any other Indian enterprise, for that matter. If Tower is unwilling to sell, an alternative path for Tower could be to become a technology partner.

For Tower, to become a technology partner, it won’t require a significant investment, given that 50% of the cost will be borne by the central government and state governments would chip in with another 20-25%. If we assume, the cost of setting up a fab, in partnership with Reliance, is USD 4 billion, it would mean Tower will be making an investment of a few hundred million.

Moreover, another less likely option is for Tower to become a technology provider, instead of a technology partner. “The concept of technology providers involves a technology transfer agreement where ongoing support is provided until the new fabrication facility integrates the technology successfully. A licensing fee is levied for this service. After the facility becomes operational and the technology functions effectively Tower Semiconductor disengages. However, the Indian government seems less inclined towards this approach,” Mampazhy said.

Reliance could also take SCL

Interestingly, in the past, Tower Semiconductor has helped with the upgrade of the Semiconductor Laboratory (SCL) to 180 nm technology. SCL, which is currently under the Ministry of Electronics and IT (MeitY), is renowned for developing chips used in different ISRO missions such as Chandrayaan and Mangalyaan. “SCL in India stands as one of the rare semiconductor manufacturers that can proudly claim their chips have journeyed to the Moon and Mars,” Anshuman Tripathi, member of the National Security Advisory Board (NSAB), previously told AIM.

Last year, the Union Cabinet approved a modernisation plan for SCL and is currently searching for a suitable candidate to manage India’s sole existing fab. Reliance Industries could potentially be a strong contender for taking over SCL, especially considering Mukesh Ambani’s affiliations with the BJP government, which could work to Reliance’s advantage in this scenario. Mamphazy too believes Reliance could potentially be a good candidate to take over the SCL. “Tower did the technology transfer to SCL 10-15 years back and so the same Process Design Kit (PDK) applies for both fabs and so SCL can act as a ‘second source’ for Tower’s 180 nm orders,” Mamphazy said.

Moreover, the 180 nm semiconductor fabrication line at SCL offers the capability to manufacture a range of products, including microcontrollers, sensors, and communication chips. These components have diverse applications, potentially benefiting Reliance Industries, particularly in sectors such as telecom, energy and electronics.

The Reuter report also stated that one of the major reasons Reliance is foraying into semiconductors is to address its supply chain needs. “More than anything else, SCL will be a perfect opportunity for Reliance to ‘get its hands dirty’ on how to run a fab in India,” Mamphazy said.

The post Why Tower Semiconductor Emerges as a Compelling Choice for Reliance appeared first on Analytics India Magazine.


Everything you Need to Become a SAS Certified Data Scientist

Sponsored Content

Everything you Need to Become a SAS Certified Data Scientist

Almost 63% of organizations don’t have enough employees with AI and machine learning skills, according to a study by Coleman Parkes Research. With a shortage of talent and an abundance of opportunity, there’s never been a better time to launch or advance your data science career with the SAS Academy for Data Science. Read on to find out everything you need to become a SAS Certified Data Scientist.

SAS Data Science Certifications

Your first step on your journey to becoming a SAS Certified Data Scientist is choosing which certification is right for you. Here’s a quick overview of what you can choose from.

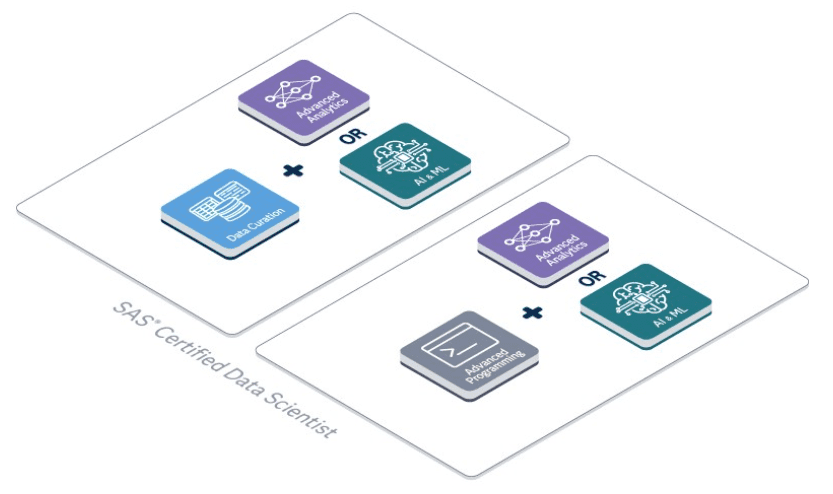
Data Curation — Designed for Data Scientists, this program covers SAS topics for data curation techniques, including big data preparation with Hadoop.

Advanced Programming — Learn advanced programming techniques, how to process data using Structured Query Language (SQL) and how to use the SAS macro facility.

Advanced Analytics — Expand your analytical skillset by learning predictive modeling, text analytics, experimentation and optimization techniques.

AI & Machine Learning — Learn to apply AI and machine learning to business problems and understand each step of the analytical life cycle with this in-depth credential.

These four programs are all a part of the SAS Academy for Data Science. The Academy will help you to master the skills you need to become a data scientist with in-depth training and professional certifications. You’ll be able to combine multiple certifications to become a SAS Certified Data Scientist.

Choose from two paths to become a SAS Certified Data Scientist. Start with Data Curation Professional or Advanced Programming Professional. Then take either Advanced Analytics or AI & Machine Learning Professional to complete the coursework. Learn more and start a free trial of the Academy today.

Everything you Need to Become a SAS Certified Data Scientist

Resources to Prepare for Your Exam

The Data Scientist Learning Journey Webinar Series: The Data Scientist Learning Journey webinar series is designed for individuals thinking about enhancing their data science skills using SAS® or looking to enter the field of data science. The webinars range from technical to introductory topics. There’s something for every data scientist, no matter what part of your learning journey you’re on.

Data Science Resource Hub: Explore the Data Science Resource Hub to find webinars, articles, videos, and downloads that will enhance your knowledge of data science.

Now sure where to start? Check out the four data science learning subscriptions below which are all aligned to the certification exams. Test it out with a free 7-day trial.

  • SAS Data Curation Professional Learning Subscription
  • SAS Advanced Programming Professional Learning Subscription
  • SAS Advanced Analytics Professional Learning Subscription
  • SAS AI and Machine Learning Professional Learning Subscription

Why Get SAS Certified? If you’re still on the fence about whether you should earn a SAS certification, learn how this qualification can enhance your professional career and see how other like-minded individuals put their certification to work for them.

Get SAS Certified: $99 SAS Certification Exams through December 15th*.

After you’ve worked hard, it’s time to validate your skills by taking a certification exam. Right now, SAS certification exams are $99*. Put your personal and professional goals first and take advantage of this offer.

*The SAS Programming Fundamentals exam and SAS Predictive Modeler exam are not included.

More On This Topic

  • ModelOps: What you need to know to get certified
  • Want to Become a Data Scientist? Part 1: 10 Hard Skills You Need
  • SAS® Visual Data Science Decisioning powered by SAS® Viya®:…
  • SAS Analytics Pro – now available for on-site or containerized cloud-native…
  • Everything You Need to Know About Data Lakehouses
  • KDnuggets News, April 13: Python Libraries Data Scientists Should Know in…

AI for Natural Language Understanding (NLU)

AI for NLU

In the panorama of Artificial Intelligence (AI), Natural Language Understanding (NLU) stands as a citadel of computational wizardry. No longer in its nascent stage, NLU has matured into an irreplaceable asset for business intelligence. In this discussion, we delve into the advanced realms of NLU, unraveling its role in semantic comprehension, intent classification, and context-aware decision-making.

The underpinnings: Language models and deep learning

Before embarking on the NLU journey, distinguishing between Natural Language Processing (NLP) and NLU is essential. While NLP is an overarching field encompassing a myriad of language-related tasks, NLU is laser-focused on understanding the semantic meaning of human language.

The backbone of modern NLU systems lies in deep learning algorithms, particularly neural networks. These models, such as Transformer architectures, parse through layers of data to distill semantic essence, encapsulating it in latent variables that are interpretable by machines. Unlike shallow algorithms, deep learning models probe into intricate relationships between words, clauses, and even sentences, constructing a semantic mesh that is invaluable for businesses.

Transformers and attention mechanisms

In advanced NLU, the advent of Transformer architectures has been revolutionary. These models leverage attention mechanisms to weigh the importance of different sentence parts differently, thereby mimicking how humans focus on specific words when understanding language. For instance, in sentiment analysis models for customer reviews, attention mechanisms can guide the model to focus on adjectives such as ‘excellent’ or ‘poor,’ thereby producing more accurate assessments.

Semantic eearch in customer service

Semantic search capabilities have revolutionized customer service experiences. NLU algorithms sift through vast repositories of FAQs and support documents to retrieve answers that are not just keyword-based but contextually relevant. What sets semantic search apart is its ability to consider user intent. By employing semantic similarity metrics and concept embeddings, businesses can map customer queries to the most relevant documents in their database, thereby delivering pinpoint solutions.

Concept embeddings and knowledge graphs

It would be remiss to ignore the role of concept embeddings and knowledge graphs when talking about semantic search. These technologies allow NLU algorithms to map abstract concepts to vectors in a high-dimensional space, facilitating better search outcomes. For instance, customer inquiries related to ‘software crashes’ could also yield results that involve ‘system instability,’ thanks to the semantic richness of the underlying knowledge graph.

Sentiment analysis for market research

One of the most compelling applications of NLU in B2B spaces is sentiment analysis. Utilizing deep learning algorithms, businesses can comb through social media, news articles, & customer reviews to gauge public sentiment about a product or a brand. But advanced NLU takes this further by dissecting the tonal subtleties that often go unnoticed in conventional sentiment analysis algorithms.

Multi-dimensional sentiment metrics

In sentiment analysis, multi-dimensional sentiment metrics offer an unprecedented depth of understanding that transcends the rudimentary classifications of positive, negative, or neutral feelings. Traditional sentiment analysis tools have limitations, often glossing over the intricate spectrum of human emotions and reducing them to overly simplistic categories. While such approaches may offer a general overview, they miss the finer textures of consumer sentiment, potentially leading to misinformed strategies and lost business opportunities.

On the other hand, multi-dimensional sentiment metrics delve into the complexity of human emotions by capturing a range of nuanced sentiments such as ‘enthusiasm,’ ‘skepticism,’ or ‘indifference.’ This approach allows businesses to identify subtler emotional currents within customer interactions, social media engagements, or product reviews. For example, a consumer may express skepticism about the cost-effectiveness of a product but show enthusiasm about its innovative features. Traditional sentiment analysis tools would struggle to capture this dichotomy, but multi-dimensional metrics can dissect these overlapping sentiments more precisely.

Granular sentiments

The value of understanding these granular sentiments cannot be overstated, especially in a competitive business landscape. Armed with this rich emotional data, businesses can finetune their product offerings, customer service, and marketing strategies to resonate with the intricacies of consumer emotions. For instance, identifying a predominant sentiment of ‘indifference’ could prompt a company to reinvigorate its marketing campaigns to generate more excitement. At the same time, a surge in ‘enthusiasm’ could signal the right moment to launch a new product feature or service.

This level of specificity in understanding consumer sentiment gives businesses a critical advantage. They can tailor their market strategies based on what a segment of their audience is talking about and precisely how they feel about it. The strategic implications are far-reaching, from product development to customer engagement to competitive positioning. Essentially, multi-dimensional sentiment metrics enable businesses to adapt to shifting emotional landscapes, thereby crafting strategies that are responsive and predictive of consumer behavior. Therefore, companies that leverage these advanced analytical tools effectively position themselves at the forefront of market trends, gaining a competitive edge that is both data-driven and emotionally attuned.

Also Read: How Businesses can benefit by Integrating ChatGPT in their Apps

Anomaly detection in textual data

Another groundbreaking application is anomaly detection within textual data. Conventional techniques often falter when handling the complexities of human language. Enter NLU. By mapping textual information to semantic spaces, NLU algorithms can identify outliers in datasets, such as fraudulent activities or compliance violations.

Semantic hashing and information retrieval

Techniques like semantic hashing are instrumental in these efforts. These algorithms can swiftly perform comparisons and flag anomalies by converting textual descriptions into compressed semantic fingerprints. This is particularly beneficial in regulatory compliance monitoring, where NLU can autonomously review contracts and flag clauses that violate norms.

Ethical implications: NLU and data privacy

As with any technology, the rise of NLU brings about ethical considerations, primarily concerning data privacy and security. Businesses leveraging NLU algorithms for data analysis must ensure customer information is anonymized and encrypted.

Secure multi-party computation

In this regard, secure multi-party computation techniques come to the forefront. These algorithms allow NLU models to learn from encrypted data, ensuring that sensitive information is not exposed during the analysis. Adopting such ethical practices is a legal mandate and crucial for building trust with stakeholders.

Conclusion: The future is semantic

As AI development continues to evolve, the role of NLU in understanding the nuanced layers of human language becomes even more pronounced. From semantic search in customer service to multi-dimensional sentiment analysis in market research, the applications are manifold and invaluable for B2B ventures.

It’s abundantly clear that NLU transcends mere keyword recognition, venturing into semantic comprehension and context-aware decision-making. As we propel into an era governed by data, the businesses that will stand the test of time invest in advanced NLU technologies, thereby pioneering a new paradigm of computational semiotics in business intelligence.

Microsoft’s 1.3 Billion Model Outperforms Llama 2

Microsoft phi-1.5

Microsoft Research has done it once again. After outperforming Meta’s LLaMa with phi-1 in July, the researchers have now introduced phi-1.5, a cutting-edge language model of 1.3 billion parameters that outperforms Llama 2’s 7 billion parameters model on several benchmarks. Microsoft has decided to open source the model.

The phi-1.5 model, comprising a staggering 1.3 billion parameters, has been meticulously crafted to excel in multiple domains, making it the go-to choice for a wide range of applications. It particularly shines when dealing with queries in the question-answering (QA) format, as well as in chat interactions and code-related tasks.

Click here to check out the open source model on Hugging Face.

How far does one billion parameters take you? As it turns out, pretty far!!!
Today we're releasing phi-1.5, a 1.3B parameter LLM exhibiting emergent behaviors surprisingly close to much larger LLMs.
For warm-up, see an example completion w. comparison to Falcon 7B & Llama2-7B pic.twitter.com/x5qZGPjoSZ

— Sebastien Bubeck (@SebastienBubeck) September 12, 2023

While phi-1 was trained on high-quality textbook data, phi-1.5 is trained on synthetic data only. This sets phi-1.5 apart is its comprehensive training regimen, encompassing a rich tapestry of data sources. The model’s learning journey draws from diverse data pools, including Python code snippets harvested from StackOverflow, code from competitive programming contests, synthetic Python textbooks, and exercises generated by the powerful gpt-3.5-turbo-0301.

Click here to read the paper: Textbooks Are All You Need II: phi-1.5 technical report

Key Details of phi-1.5 Model:

  • Architecture: Transformer-based model with a focus on next-word prediction objectives.
  • Dataset Size: Trained on a vast corpus of 30 billion tokens.
  • Training Tokens: The model honed its skills on a staggering 150 billion tokens.
  • Precision: Utilises the fp16 precision standard.
  • GPUs: Harnesses the power of 32xA100-40G GPUs.
  • Training Time: Achieved its remarkable capabilities through 8 days of intensive training.

The brainpower behind phi-1.5, the Microsoft Research team, asserts that this model has achieved nearly state-of-the-art performance levels among models with less than 10 billion parameters. Rigorous benchmark tests evaluating common sense, language comprehension, and logical reasoning have positioned phi-1.5 as a formidable contender.

Notably, phi-1.5 has outperformed Meta’s Llama-2 7b in the AGIEval score and has approached parity with llama-2 7b in the GPT4ALL’s Benchmark suite, as measured by the LM-Eval Harness.

The post Microsoft’s 1.3 Billion Model Outperforms Llama 2 appeared first on Analytics India Magazine.
Understanding Machine Learning Algorithms: An In-Depth Overview

Understanding Machine Learning Algorithms: An In-Depth Overview
Image by Author

Machine Learning. Quite an impressive block of words, am I right? Since AI and its tools, like ChatGPT, and Bard, booming right now, it is time to go deeper and learn the fundamentals.

These fundamental concepts might not enlighten you at once, yet if you are interested in the concepts, you will have further links to go even deeper.

Machine Learning’s strength comes from its complex algorithms, which are stated at the core of every Machine learning project. Sometimes these algorithms even draw inspiration from human cognition, like speech recognition or face recognition.

In this article, we will go through an explanation of the machine learning classes first, like supervised, unsupervised, and reinforcement learning.

Then, we will go into the tasks handled by Machine Learning, names are Classification, Regression, and Clustering.

After that, we will deeply discover Decision trees, Support Vector Machines, and K-Nearest Neighbours, and Linear Regression, visually, and definitions.

But of course, how can you choose the best algorithm, that will be aligned with your needs? Of course, understanding concepts like “understanding data” or “defining your problem” will guide you through tackling possible challenges and roadblocks in your project.

Let’s start the journey of Machine Learning!

Categories of Machine Learning

When we are exploring Machine Learning, we can see there are three major categories that shape its framework.

  • Supervised Learning
  • Unsupervised Learning
  • Reinforcement Learning.

In supervised learning, the label, that you want to predict is in the dataset.

In this scenario, the algorithm acts like a careful learner, associating features with corresponding outputs. After the learning phase is over, it can project the output for the new data, and test data. Consider scenarios like tagging spam emails or predicting house prices.

Imagine studying without a mentor next; it must be daunting. Unsupervised learning methods particularly do this, making predictions without labels.

They bravely go into the unknown, discovering hidden patterns and structures in unlabeled data, similar to explorers discovering lost artifacts.

Understanding genetic structure in biology and client segmentation in marketing is unsupervised learning examples.

Finally, we reach Reinforcement Learning, where the algorithm learns by making mistakes, much like a little puppy. Imagine teaching a pet: Misbehavior is discouraged, while good behavior is rewarded.

Similar to this, the algorithm takes actions, experiences rewards or penalties, and eventually figures out how to optimize. This strategy is frequently used in industries like robotics and video games.

Types of Machine Learning

Here we will divide Machine algorithms into three subsections. These subsections are Classification, Regression, and Clustering.

Classification

As the name shows, classification focuses on the process of grouping or categorizing items. Think of yourself as a botanist assigned with classifying plants into benign or dangerous categories based on a variety of features. It's similar to sorting sweets into different jars based on their colors.

Regression

Regression is the next step; think of it as an attempt to predict numerical variables.

The goal in this situation is to predict a certain variable, such as the cost of a property in considering its features (number of rooms, location, etc.).

It is similar to figuring out a fruit's large quantities using its dimensions because there are no clearly defined categories but rather a continuous range.

Clustering

We now reach Clustering, which is comparable to organizing disorganized clothing. Even if you lack preset categories (or labels), you still put related objects together.

Imagine an algorithm that, with no prior knowledge of the subjects involved, classifies news stories based on those themes. Clustering is obvious there!

Let's analyze some popular algorithms that do these jobs because there is still much more to explore!

Popular Machine Learning Algorithms

Here, we will go deeper into popular Machine Learning algorithms, like Decision Trees, Support Vector Machines, K-Nearest Neighbors, and Linear Regression.

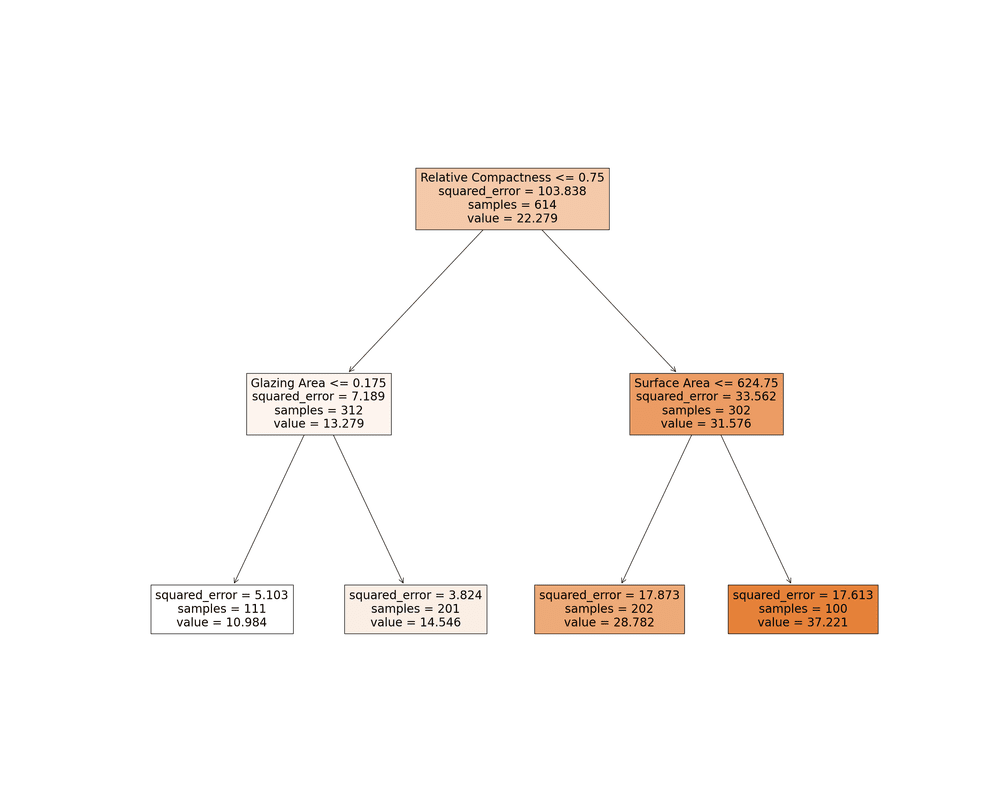
A. Decision Tree

Understanding Machine Learning Algorithms: An In-Depth Overview
Image by Author

Think about planning an outdoor event and having to decide whether to go forward or call it off dependent on the weather. A Decision Tree may be used to represent this decision-making process.

A Decision Tree method in the field of machine learning (ML) asks a series of binary questions about the data (for example, "Is it precipitating?") until it comes to a decision (continue the collection or stop it). This method is very useful when we need to understand the reasoning behind a prediction.

If you want to learn more about decision trees, you can read Decision Tree and Randon Forest Algorithm (basically decision tree on steroids).

B. Support Vector Machines (SVM)

Understanding Machine Learning Algorithms: An In-Depth Overview
Image by Author

Imagine a scenario similar to the Wild West where the aim is to divide two rival groups.

To avoid any conflicts, we would choose the biggest practical border; this is exactly what Support Vector Machines (SVM) do.

They identify the most effective 'hyperplane' or border that divides data into clusters while keeping the greatest distance from the nearest data points.

Here, you can find more information about SVM.

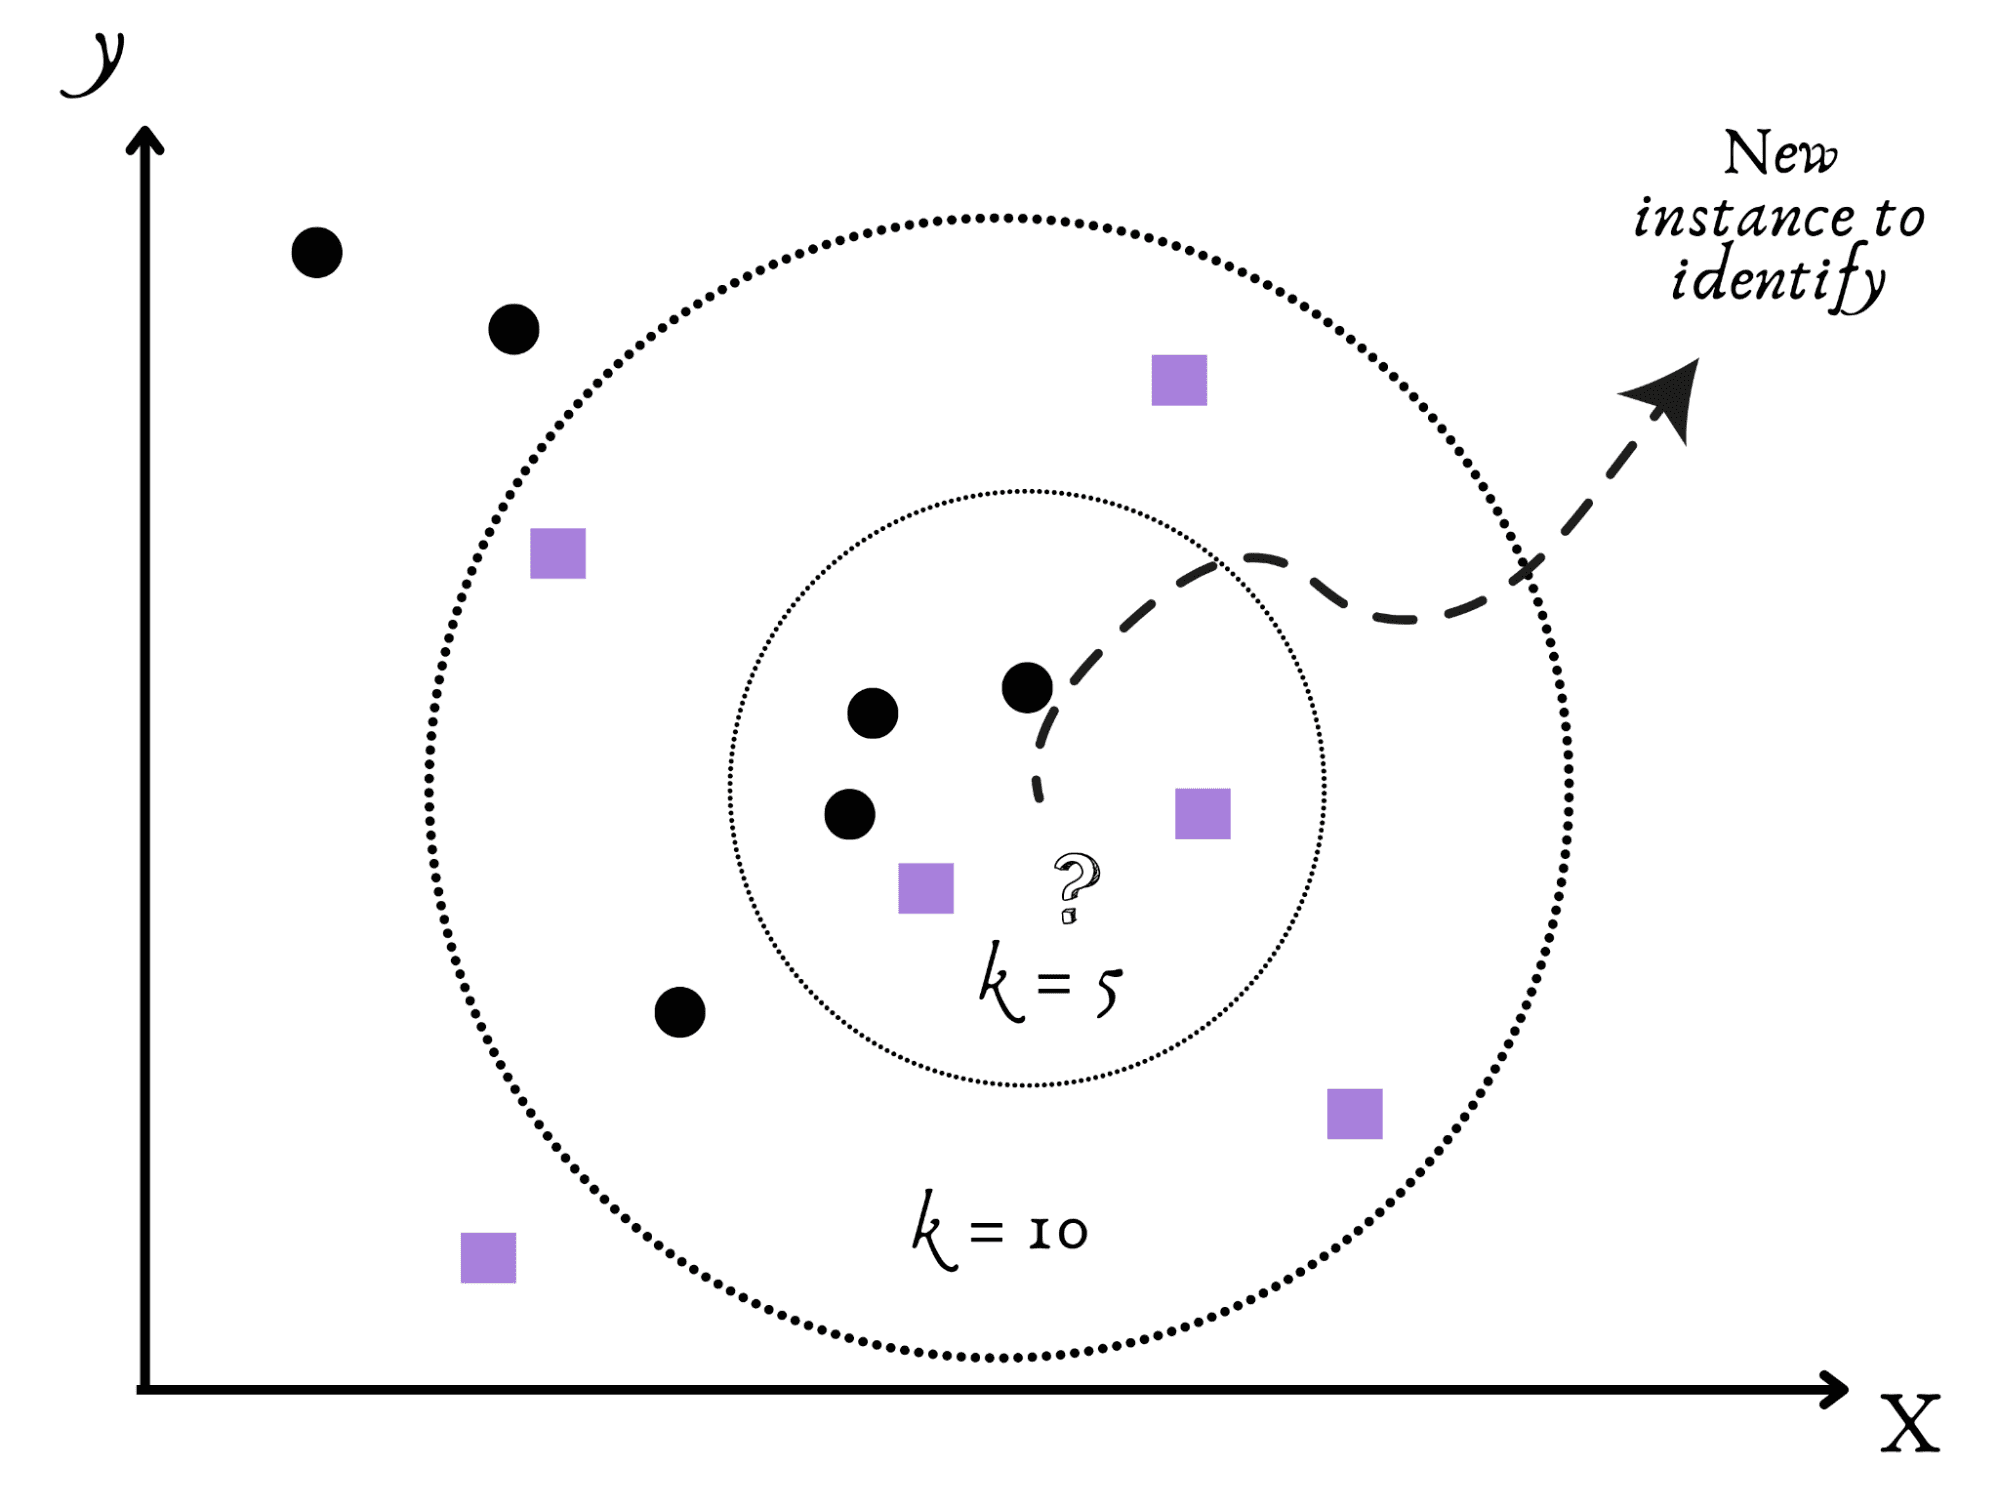
C. K-Nearest Neighbors (KNN)

Understanding Machine Learning Algorithms: An In-Depth Overview
Image by Author

The K-Nearest Neighbors (KNN), a friendly and social algorithm, comes next.

Imagine moving to a new town and trying to figure out if it is quiet or busy.

It seems sense that your natural course of action would be to monitor your nearest neighbors to gain understanding.

Similar to this, KNN classifies fresh data according to the arguments, such as k, of its close neighbors in the data set.

Here you can know more about KNN.

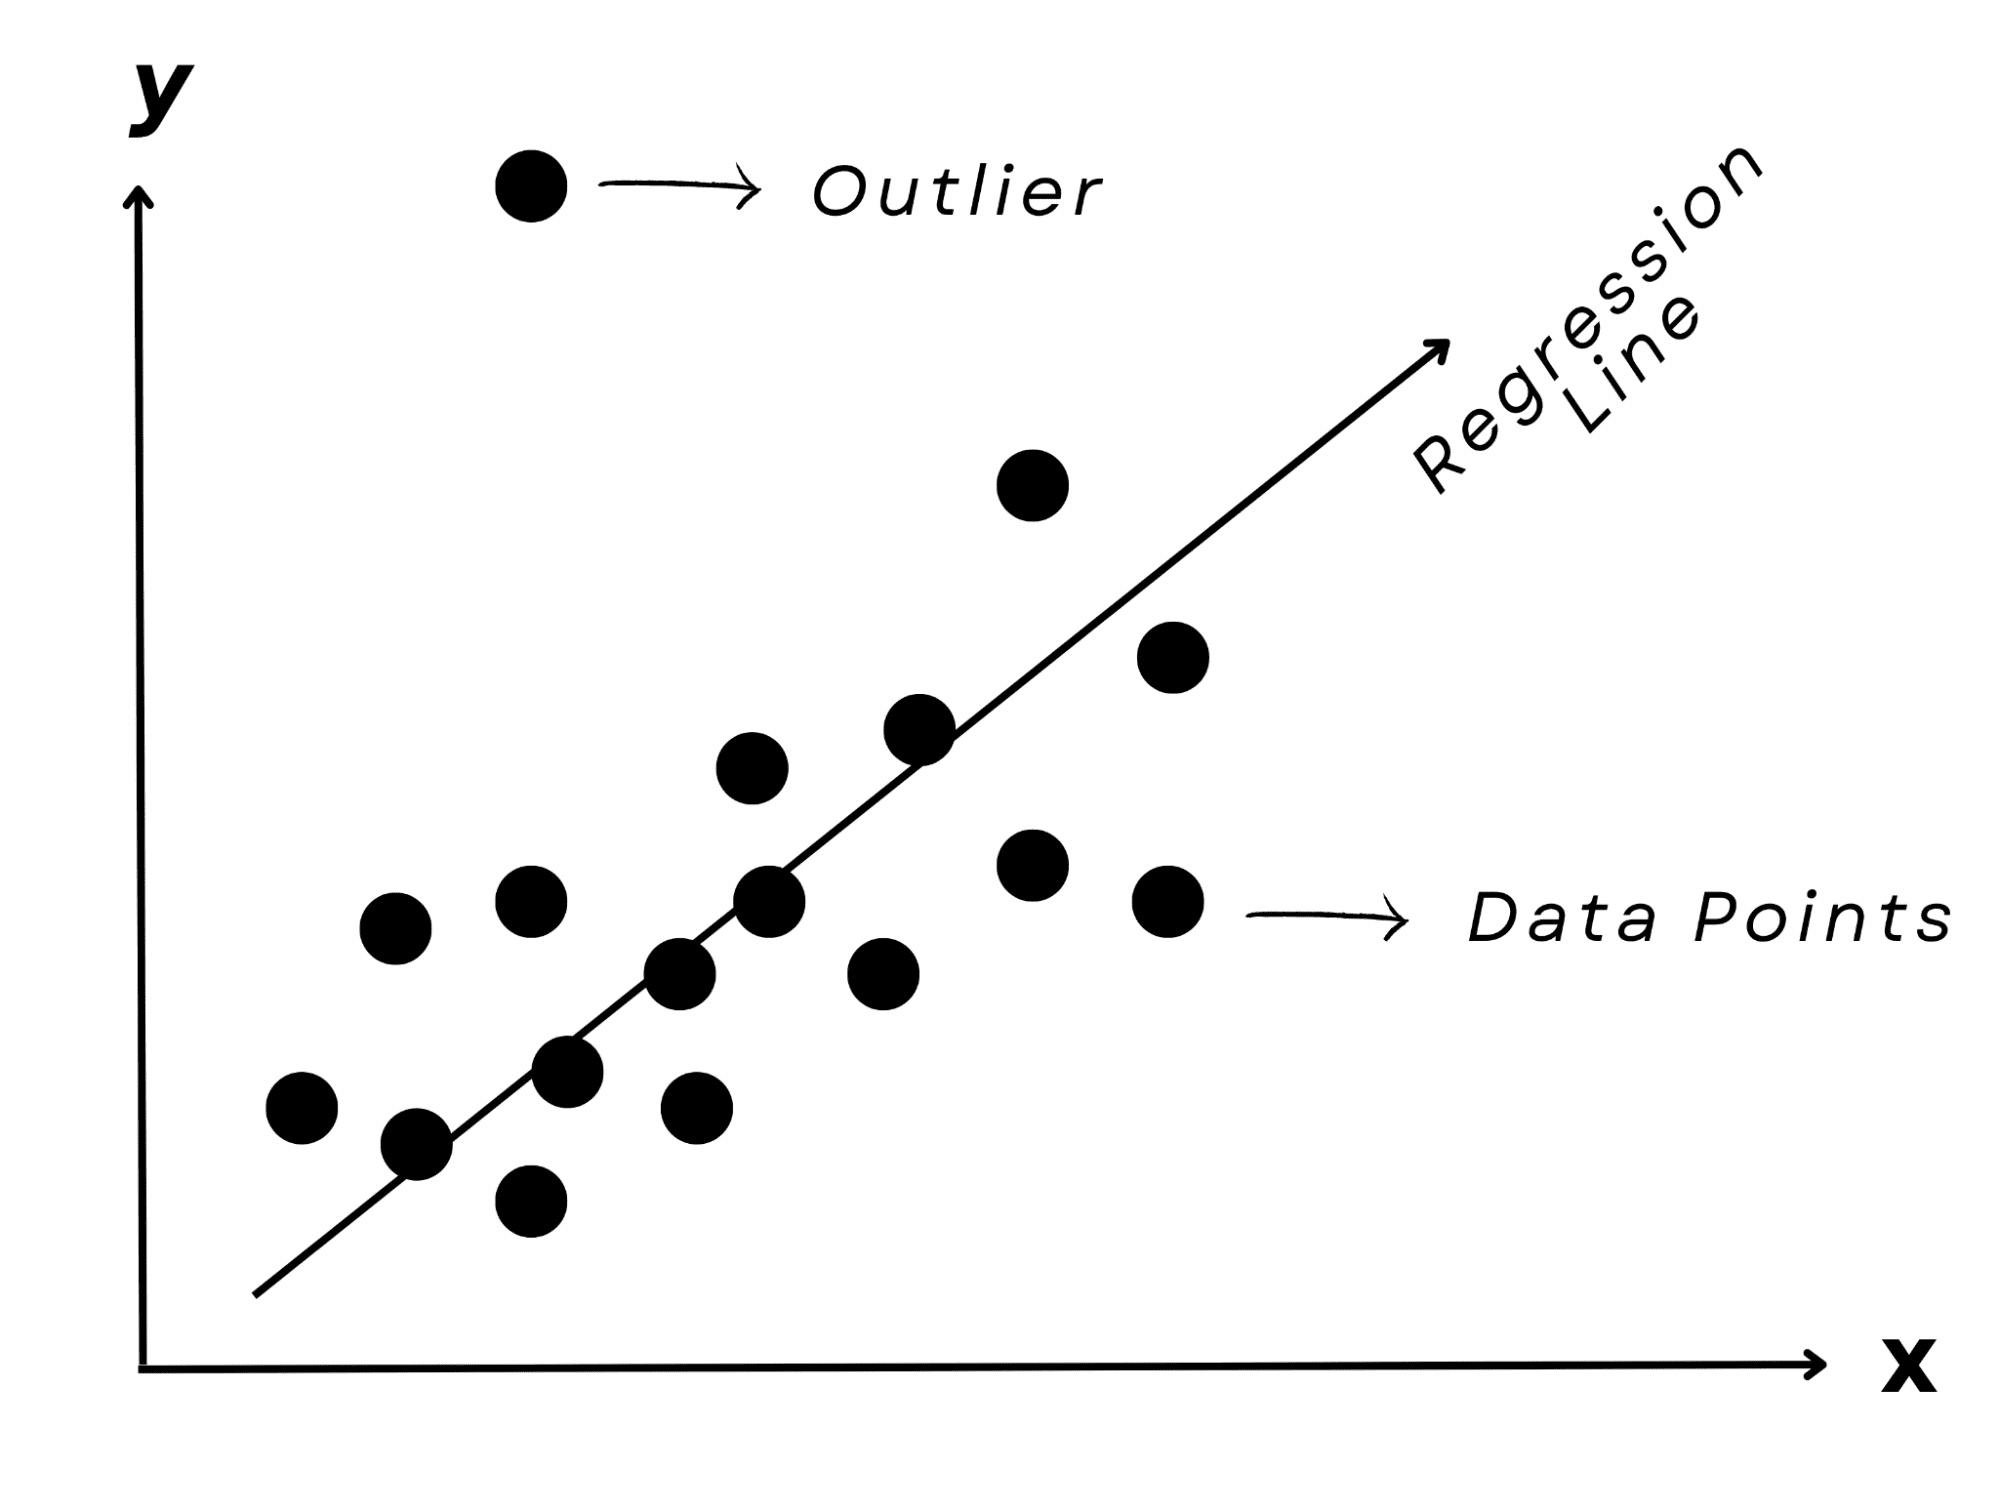
D. Linear Regression

Understanding Machine Learning Algorithms: An In-Depth Overview
Image by Author

Lastly, imagine trying to predict a friend's exam result based on the number of hours they studied. You'd probably notice a pattern: more time spent studying usually results in better results.

A linear regression model, which, as its name indicates, represents the linear connection between the input (study hours) and the output (test score), can capture this correlation.

It is a favorite approach for predicting numerical values, such as real estate costs or stock market values.

For more about linear regression, you can read this article.

Choosing The Right Machine Learning Model

Choosing the right algorithm from all of the options at your disposal might feel like trying to find a needle in a very large haystack. But don't worry! Let's clarify this process with some important things to think about.

A. Understand Your Data

Consider your data to be a treasure map that contains clues to the best algorithm.

  • Do you have labels on your data? (Supervised vs Unsupervised Learning)
  • How many features does it include? (Do we need dimension reduction?)
  • Is it categorical or numerical? ( Classification or Regression?)

These questions' answers might point you in the right way. In contrast, unlabeled data might encourage unsupervised learning algorithms like clustering. For instance, labeled data encourages the usage of supervised learning algorithms like Decision Trees.

B. Define Your Problem

Imagine using a screwdriver to drive a nail; not very effective, is it?

The right "tool" or algorithm may be chosen by clearly defining your problem. Is your goal to identify hidden patterns (clustering), forecast a category (classification), or a metric (regression)?

There are compatible algorithms for every task type.

C. Consider Practical Aspects

An ideal algorithm may occasionally perform poorly in actual applications than it does in theory. The amount of data you have, the available computational resources, and the need for the results all play important roles.

Remember that certain algorithms, like KNN, could perform poorly with large datasets, while others, like Naive Bayes, might do well with complex data.

D. Never Underestimate Evaluation

Finally, it's crucial to evaluate and validate the performance of your model. You want to make sure the algorithm works effectively with your data, similar to trying on clothing before making a purchase.

This 'fit' may be measured using a variety of measures, such as accuracy for classification tasks or mean squared error for regression tasks.

Conclusion

Haven't we traveled quite a distance?

As with categorizing a library into different genres, we started by dividing the field of machine learning into Supervised, Unsupervised, and Reinforcement Learning. Then, in order to understand the diversity of books within these genres, we went further into the sorts of tasks like classification, regression, and clustering, that fall under these headings.

We got to know some of the ML algorithms first, which include Decision Trees, Support Vector Machines, K-Nearest Neighbors, Naive Bayes, and Linear Regression. Each of these algorithms has its own specialties and strengths.

We also realized that choosing the right algorithm is like casting the ideal actor for a part, taking into account data, the nature of the issue, real-world applications, and performance evaluation.

Every machine Learning project offers a distinct journey, just as every book gives a new narrative.

Keep in mind that learning, experimenting, and improving are more important than always doing it right the first time.

So get ready, put on your data scientist cap, and go on your very own ML adventure!
Nate Rosidi is a data scientist and in product strategy. He's also an adjunct professor teaching analytics, and is the founder of StrataScratch, a platform helping data scientists prepare for their interviews with real interview questions from top companies. Connect with him on Twitter: StrataScratch or LinkedIn.

More On This Topic

  • Linear Machine Learning Algorithms: An Overview
  • Boosting Machine Learning Algorithms: An Overview
  • Pythia: A Suite of 16 LLMs for In-Depth Research
  • Data Labeling for Machine Learning: Market Overview, Approaches, and Tools
  • Primary Supervised Learning Algorithms Used in Machine Learning
  • KDnuggets News, June 22: Primary Supervised Learning Algorithms Used in…

Data-driven insights: Improving remote team performance with time-tracking analytics

Time tracking and effective working hours management tiny person concept, transparent background. Productive software app for employee work efficiency monitoring illustration.

The way we work has changed, with remote teams now a common part of the landscape. While remote work offers flexibility, it also brings challenges. Managing remote teams effectively is crucial to ensure productivity and collaboration.

In this article, we’ll explore how using time tracking for remote teams can help manage employees’ performance better. Time-tracking tools provide insights into how work is done, helping organizations make informed decisions. We’ll see how analyzing time-tracking data reveals when teams are most productive and how tasks are managed. By understanding these patterns, organizations can enhance remote team performance and achieve better outcomes.

Leveraging time tracking data

Time-tracking apps usually capture detailed information about tasks, projects, and activities, including start and end times, task descriptions, and breaks taken. They generate reports that display time allocation across different projects, clients, or categories, shedding light on where your efforts are concentrated. Furthermore, these apps often provide visual representations like charts and graphs, illustrating productivity trends, peak hours, and patterns of time distribution.
By analyzing this data, individuals and teams can gain valuable insights into how time is being allocated, identify bottlenecks, and streamline processes. This data-driven approach enables better time management and helps prioritize tasks effectively.

Tracking daily activities

At the heart of effective time tracking for remote teams lies the practice of meticulously recording daily activities. From the moment a remote worker starts their day to when they sign off, every task, break, and project engagement is captured. This detailed chronicle not only offers a panoramic view of how time is spent but also highlights potential areas for optimization.
This approach offers transparency into each team member’s workflow. Managers gain insights into the types of tasks being executed, the time dedicated to each task, and potential areas where efforts might be misplaced.

Furthermore, tracking daily activities brings to light the ebbs and flows of each team member’s work patterns. This knowledge empowers remote teams to identify productivity trends, such as the times when individuals are most focused and effective.
Additionally, some time tracking tools offer customizable tagging systems, allowing you to categorize tasks based on their nature or complexity. For instance, users can label tasks as “high priority,” “creative,” or “routine” and later review their tracked time and note when they tackled specific types of tasks with the highest level of energy. This categorization helps you to identify peak productivity hours and the kinds of tasks that thrive during these periods.

Identifying workflow bottlenecks

Through time tracking, remote teams can pinpoint bottlenecks that hinder productivity. Whether it’s a recurring task that consumes excessive time or a specific step in a project workflow causing delays, these pain points become apparent. Armed with these insights, individuals and teams can pinpoint these time drains and take targeted actions to minimize them.
Moreover, time tracking data doesn’t just show where time is being lost; it offers a deeper understanding of why it’s happening. Are there particular tasks that consistently take longer than expected? Are there patterns of multitasking that fragment concentration and efficiency? These insights allow for a more holistic analysis of work habits and the identification of underlying causes of time wastage. As a result, teams can implement strategies to address these specific issues.

In addition, many time-tracking tools for remote teams offer reports that show how time is allocated through different websites and apps. It offers a valuable window into your digital behavior, helping you gauge if you are spending excessive time on non-work-related websites. By analyzing these reports, team members can gather insights into whether their online activities align with their intended work goals. For example, if the reports show that you often spend a lot of time on social media or entertainment websites during work hours, it’s clear that you need to make changes to stay more focused.

Improving project estimation

By analyzing historical time data across various tasks and projects, teams can gain a clearer understanding of how long certain activities actually take to complete. This insight replaces guesswork with empirical evidence, enabling more accurate and realistic project timelines. As teams delve into the accumulated data, they can identify patterns in task durations, uncover potential bottlenecks, and factor in unforeseen variables that might affect future projects.

Furthermore, time-tracking data facilitates a proactive approach to managing project scope and client expectations. Armed with a comprehensive record of task durations and progress, project managers can provide clients with more transparent updates and realistic forecasts. Should any deviations from the initial project plan arise, the data serves as a valuable reference point to communicate adjustments and potential impacts. This not only fosters stronger client relationships built on trust but also enables teams to adapt swiftly, ensuring project goals remain achievable within the defined timeframe.

Enhancing work-life balance

Time tracking data plays a great role in fostering a healthier work-life balance, especially in the context of remote work where boundaries between professional and personal life can blur. By providing a clear picture of how time is allocated throughout the day, you can identify when work goes into personal time or vice versa. For instance, if time tracking data reveals that work-related tasks often extend into evenings, you can adjust your work pattern to finish work a bit earlier.

Time tracking for remote teams also helps to reveal whether there are adequate breaks to rest and recharge, or if there’s a tendency to overindulge in extended pauses. This information is crucial for sustaining a balanced work routine. If time tracking data shows prolonged periods without breaks, it may suggest incorporating short, regular breaks to prevent burnout and maintain focus. Conversely, excessive and frequent breaks might signal an opportunity to structure work periods more effectively. By analyzing the intervals between productive work sessions and short respites, individuals can fine-tune their approach to breaks, optimizing their productivity and well-being in the process.

Conclusion

By harnessing the power of data-driven insights, remote teams can unlock their true potential. From identifying peak productivity hours to enhancing work-life balance, time-tracking analytics pave the way for informed decisions, personalized strategies, and a more harmonious work environment.

CertifID, which develops products to prevent wire fraud, raises $20M

CertifID, which develops products to prevent wire fraud, raises $20M Kyle Wiggers 10 hours

CertifID, a startup developing fraud prevention tech for the real estate market, today announced that it raised $20 million in a funding round led by Arthur Ventures at “over double” its previous valuation.

CertifID primarily develops products to fight wire fraud. The startup’s co-founder, Thomas Cronkright, launched the company in 2017 after losing $180,000 to fraud at his real estate title agency in Grand Rapids, Michigan.

Typically, in wire fraud involving real estate transactions, criminals find information about upcoming real estate closings by hacking into email accounts — often potential homeowners. Posing as legitimate reps of financial institutions, they email homebuyers fraudulent wire transfer instructions.

More than 13,000 people were victims of wire fraud in the real estate and rental sector in 2020, with losses of more than $213 million — an increase of 380% since 2017, according to FBI data.

Cronkright later teamed up with Tyler Adams, a former lead product manager at BCG’s corporate investment and incubation division, to build a platform to protect home buyers, home sellers and real estate businesses from this form of cybercrime.

“The real estate industry is facing a wire fraud problem that has accelerated significantly in recent years,” Adams, who serves as CertifID’s CEO, told TechCrunch via email. “The FBI recently reported victim losses from real estate business email compromise increased 72% from 2020 to 2022 … CertifID was created to help create a world without wire fraud.”

A “world without wire fraud” is a tad hyperbolic. But CertifID does offer tools to fight it.

For title agents and real estate law firms, CertifID handles transactions, insuring up to $1 million every time money changes hands. Home buyers receive wiring instructions and are given the option to purchase a money protection plan for added coverage. Meanwhile, home sellers are asked to provide banking information and submit to an identity verification process to prevent fraud attempts.

Under the hood, a rules-based engine along with an AI model trained on “internally vetted data,” “expert decisions” and reviews of its own decisions powers CertifID’s payment disbursement and identity verification processes. (This reporter wonders about the quality of that data, but CertifID didn’t go into great detail.) The model evaluates various markers of fraud, incorporating new data points as malicious actors embrace new approaches.

“We believe automation and AI have incredible potential to the market,” Adams said. “But we also recognize that fraud and abuse of trust leverage the human factors of technology disproportionately, and approach the problem of fraud with a human-centered approach.”

With the new funding, CertifID says that it plans to support ongoing product development and scale operations to meet demand for its products. CertifID claims to have “several hundred” title and real estate business customers and partnerships with federal law enforcement to support fraud recovery efforts where its verification software isn’t used.

CertifID

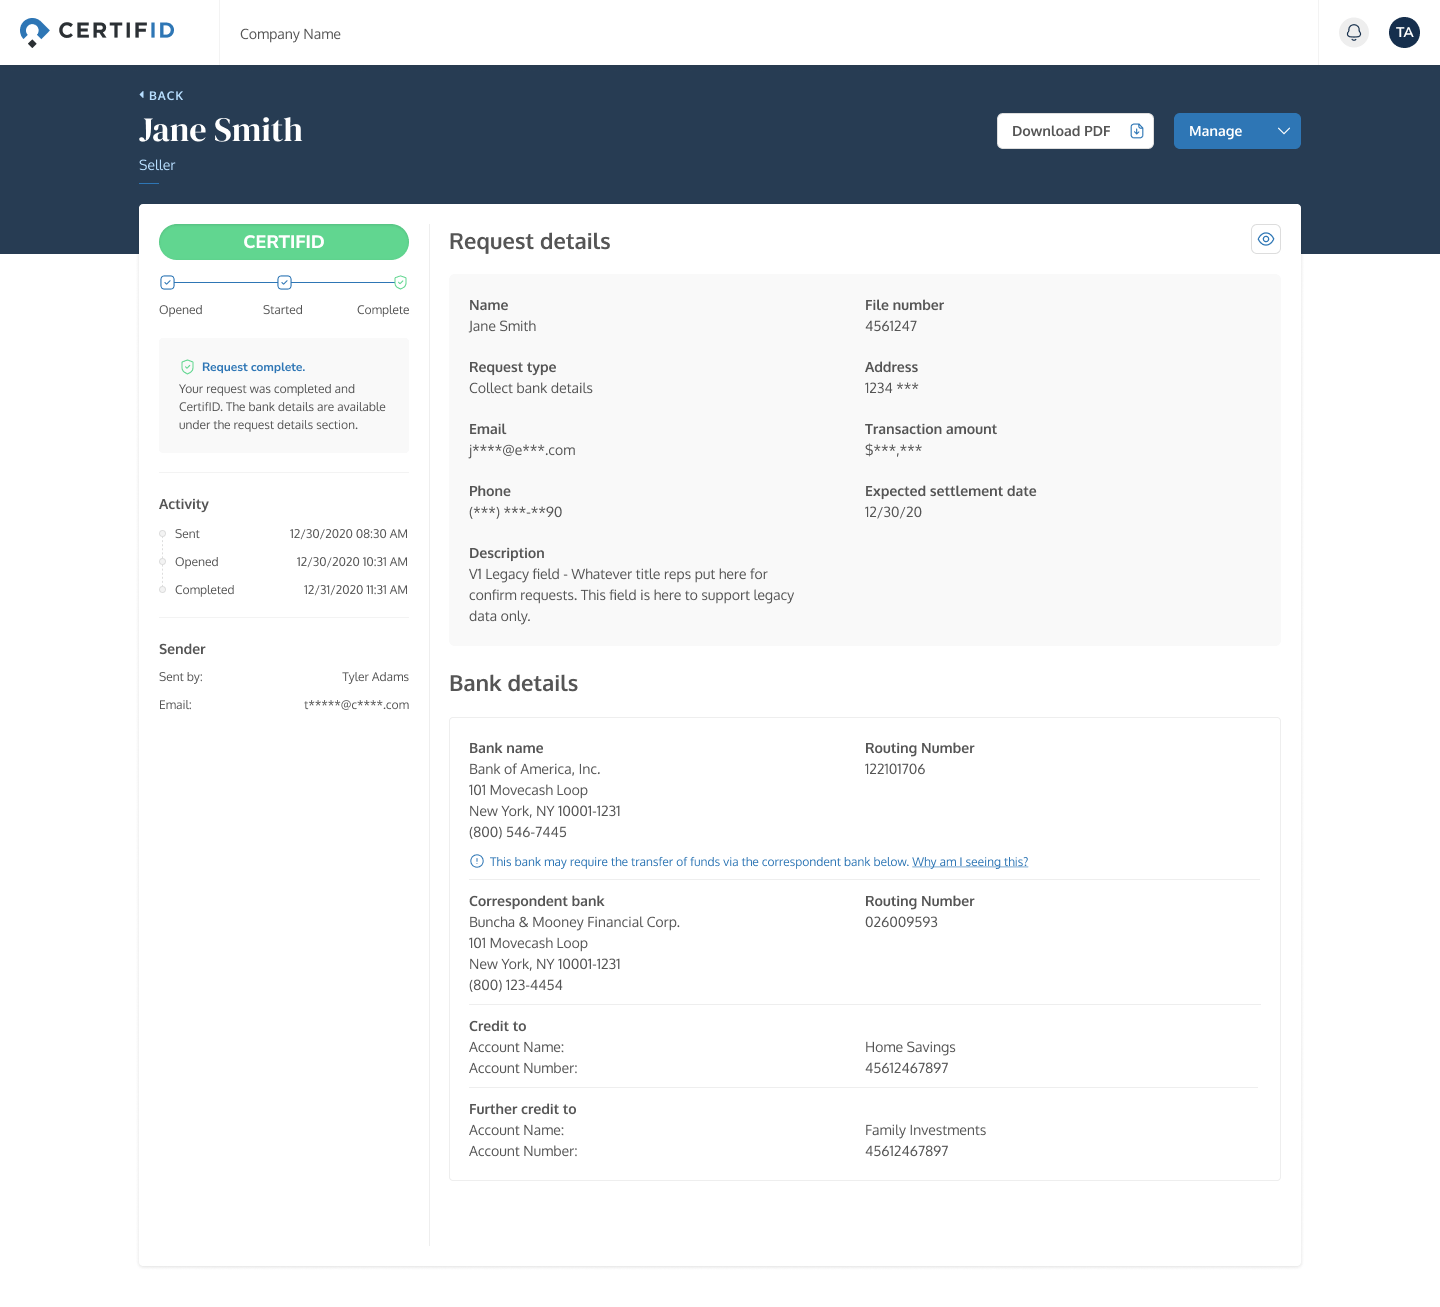
CertifID’s management dashboard for wire fraud prevention.

To date, CertifID has raised over $40 million — a mix of equity and debt.

“Despite a downturn in the housing market, CertifID continued to see increased demand in its products and services,” Adams said. “Fraud has continued to increase through a pandemic, a bank crisis and ongoing twin threats of inflation and recession. And it’s expected to continue to rise into the foreseeable future. With the majority of the real estate industry yet to adopt anti-fraud technology, the company expects continued growth ahead.”

Coca-Cola Unveils New AI-Created Flavour Y3000 Zero Sugar

Up until now, we have discovered various generative AI use cases, from creating songs to solving real-world problems. However, for the first time ever, you can literally taste the future as beverage giant Coca-Cola is using AI to develop a new flavour: Y3000 Zero Sugar. This unique flavour aims to offer a “taste of the future”.

The company announced a collaboration with Bain & Company and OpenAI in February to harness the power of generative AI, including DALL-E 2 and ChatGPT.

AI played a pivotal role not only in crafting the flavour but also in designing the packaging, including the logo and text script. Coca-Cola took into account feedback from its fans during the formulation process. Each can of Y3000 will feature a QR code, leading consumers to an online experience powered by AI, showcasing a vision of the year 3000.

Furthermore, Coca-Cola is launching a clothing collection in partnership with the fashion brand Ambush, aligned with the Y3000 release. The campaign was a collaborative effort involving creative agencies like WPP’s Open X, EssenceMediacom, Forpeople, and a cloud tech platform.

What Others Can Learn From Coca-Cola

Coca-Cola has a history of experimenting with AI, and one notable instance is their AI-driven campaign called “Masterpiece,” launched shortly after their partnership. This campaign has attracted significant attention for its innovative use of AI, where it tells the story of a Coca-Cola bottle’s journey through famous artworks, serving as a source of inspiration for a thirsty student. This visually captivating commercial seamlessly combines live-action footage, digital effects, and AI, smoothly transitioning between various art styles. It features well-known artists like Utagawa Hiroshige, J.M.W. Turner, and Van Gogh, as well as contemporary artists such as Aket, Vikram Kushwah, Stefania Tejada, and Fatma Ramadan.

Furthermore, Coca-Cola has integrated AI into various facets of its operations. They’ve introduced vending machines equipped with AI algorithms that recommend drinks based on location. In addition, the company employs AI for social media analysis, operating 37 “social centres” that collect and analyze data using the Salesforce platform. Moreover, Coca-Cola utilizes image recognition technology to target potential customers who share images online. Additionally, they employ AI to validate proof of purchase for their loyalty and reward programs, collaborating with Google’s TensorFlow technology to recognize codes that may appear differently depending on when and where they are printed.

The post Coca-Cola Unveils New AI-Created Flavour Y3000 Zero Sugar appeared first on Analytics India Magazine.

A Comprehensive Guide to Pinecone Vector Databases

A vector database is a type of database that stores data as mathematical vectors, which represent features or attributes. These vectors have multiple dimensions, capturing complex data relationships. This allows for efficient similarity and distance calculations, making it useful for tasks like machine learning, data analysis, and recommendation systems.

In simple terms, vectors are determined to represent data attributions. For example, a vector could represent the color of an image, the sentiment of a piece of text, or the location of a point on a map.

Pinecone Vector Databases are a specific type of vector database that is designed for high performance and scalability. Applications using vectors mainly include the following:

  • Natural language processing
  • Computer vision, and
  • Machine learning.

Key features of the Pinecone Vector Database

Here are some of the key features of Pinecone Vector Databases:

High-performance: Pinecone Vector Databases can search and retrieve vectors very quickly. This makes them ideal for applications that require real-time or near-real-time processing of data.

Scalability: Pinecone Vector Databases can be scaled to handle large datasets and high query loads. This makes them suitable for enterprise applications.

Flexibility: Pinecone Vector Databases can be used with a variety of programming languages and machine learning frameworks thus making it possible to integrate into existing applications.

Ease of use: Pinecone Vector Databases are easy to use and manage. Therefore, developers prefer to opt for Pinecone vector databases that are not familiar with vector databases.

If you are looking for a high-performance, scalable, and flexible vector database, then Pinecone Vector Databases are a good option to consider.

Applications of Pinecone Vector Databases

Vector databases play a pivotal role in enhancing the accuracy and efficiency of data organization and retrieval for LLMs. Large Language Models, such as GPT-4 and LLaMa, leverage high-dimensional vector embeddings to understand complex relationships between words, sentences, and documents. These vector embeddings, stored and managed by vector databases, enable LLMs to generate insightful and contextually relevant outputs.

Here are some of the applications of Pinecone Vector Databases:

Natural language processing: Pinecone Vector Databases can be used for tasks such as sentiment analysis, text classification, and question answering.

Machine learning: Pinecone Vector Databases can be used to train and deploy machine learning models.

Computer vision: Pinecone Vector Databases can be used for tasks such as object detection, image classification, and face recognition.

Fraud detection: Pinecone Vector Databases can be used to detect fraudulent transactions.

Recommendation systems: Pinecone Vector Databases can be used to recommend products, movies, and other items to users

Challenges of using Pinecone Vector Databases

Here are some of the challenges of using Pinecone Vector Databases:

Dimensionality: Vector databases are designed to store and search for high-dimensional data. Storing and processing high-dimensional data can be computationally expensive for some applications.

Data quality: Accurate vector representations and query accuracy are improved by high-quality data that preserves relationships between data points. Low-quality data adversely affects the accuracy of results.

Privacy: Vector databases can store sensitive data, such as text or images. It is highly recommended to use measures like encryption and access control that can protect the privacy of data.

Complexity: Vector databases can be complex to set up and manage. so, before you deploy vector databases, gain a better understanding of their working mechanism.

Cost: Vector databases can be more expensive than traditional databases. This is because they require more hardware and software resources.

Despite these challenges, Pinecone Vector Databases can be a valuable tool for a variety of applications. If you are considering using a vector database, it is important to weigh the challenges and benefits carefully.

Tips for Mitigating the Challenges of using Pinecone Vector Databases.

Here are some great tips for mitigating the challenges of using Pinecone Vector Databases.

Amongst all the vector databases that are available, choose the right vector database for your needs. Each type of vector database consists of its own strengths and weaknesses. So, pick the one that best suits your specific application.

Use the right hardware and software. Vector databases can be demanding on hardware and software resources. The right tools include but are not limited to efficient database monitoring, replication latency, tracking throughout, and deviations from the norm

Plan for scalability. Vector databases can be scaled to handle large datasets and high query loads. However, one must plan for scalability from the beginning to avoid bottlenecks.

Monitor the database performance. Getting to know about low-par database performance after some time might harm you more, so, monitor the database's performance early on to ensure that it meets your expectations. This way you can mitigate the problems in initial stages and take corrective action.

By following these tips, you can minimize the challenges of using Pinecone Vector Databases and get the most out of this powerful tool.

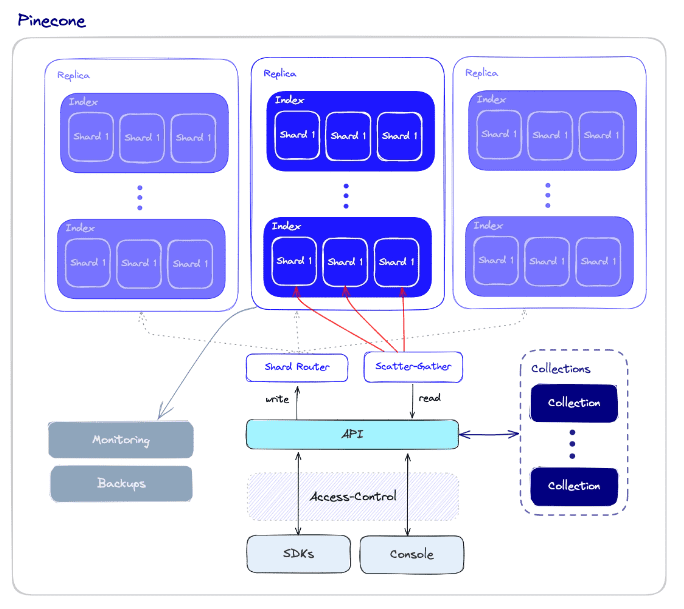
How does a Pinecone Vector Database work? How does a Pinecone Vector Database work?
Source: Pinecone.io

Pinecone Vector Databases work by indexing the vectors and then using a variety of algorithms to search for and retrieve vectors that are similar to a query vector. The indexing process is typically done offline, so that the vectors can be quickly searched when needed.

Use cases of Pinecone Vector Databases

Pinecone Vector Databases can be used in a variety of ways. Some of the most common use cases include:

  1. Natural language processing (NLP): Pinecone Vector Databases can be used for NLP tasks. NLP tasks are tasks that involve understanding and processing human language. Some examples of NLP tasks include sentiment analysis, document clustering, and question answering.
  2. Image and video analysis: Pinecone Vector Databases can be used for image and video analysis tasks. Image and video analysis tasks are tasks that involve understanding and processing images and videos. Some examples of image and video analysis tasks include object recognition, image similarity search, and video recommendation systems.
  3. Anomaly detection: Pinecone Vector Databases can be used for anomaly detection. Anomaly detection is the task of finding data points that are unusual or out of place. Pinecone Vector Databases can be used to find anomalies by comparing new data points with existing vectors.
  4. Recommendation systems: Pinecone Vector Databases can be used to power recommendation systems. Recommendation systems are used to recommend products, movies, or other items to users based on their interests. This is achieved by tracking the user journey, past behavior, and preferences and comparing them to the data stored in the database.
  5. Natural language processing (NLP): Pinecone Vector Databases can be used for NLP tasks. NLP tasks are tasks that involve understanding and processing human language. It is also commonly used to perform document clustering, sentiment analysis, and question-answering. For example, Pinecone Vector Databases can be used to analyze text data to determine the sentiment of a piece of writing, such as whether it is positive, negative, or neutral.
  6. Image and video analysis: Pinecone Vector Databases can be used for image and video analysis tasks. Wondering what these tasks are? Well, these are involved in understanding and processing images and videos. This can be used for tasks such as object recognition, image similarity search, and video recommendation systems. For example, Pinecone Vector Databases can be used to identify objects in an image or video, such as faces, cars, or buildings.
  7. Anomaly detection: Pinecone Vector Databases can be used for anomaly detection. Anomaly detection is the task of finding data points that are unusual or out of place. This also proves useful in identifying suspicious transactions, cybersecurity breaches, and other related concerns. For example, financial transactions are often analyzed to look for patterns that are indicative of fraud.
  8. Fraud detection: Pinecone Vector Databases are used to detect fraudulent transactions by comparing new transactions to a database of previously identified fraudulent transactions. The vectors representing the new transactions are compared to the vectors representing the known fraudulent transactions.
  9. Cybersecurity: Pinecone Vector Databases can be used to detect cyberattacks primarily by monitoring network traffic and identifying suspicious patterns highly susceptible to cyberattacks. The vectors representing the network traffic are compared to the vectors representing known cyberattacks. If the vectors are similar, then the network traffic is likely to be malicious.
  10. Smart cities: Pinecone Vector Databases can be used to build smart cities. Smart cities refer to the modern living conditions that help people elevate their lifestyles. Pinecone Vector Databases help municipalities to manage traffic, energy, and keep the environment sound and safe. As technology advances, more innovative applications arise. As technology advances, more innovative applications arise.

Apart from the above-mentioned ways there are several other methods introduced as the technology continues to develop, we can expect to see even more innovative and creative applications for these powerful databases.

Conclusion

The symbiotic relationship between vector databases and LLMs is driving the evolution of data management, offering faster and more precise similarity searches, which are essential for language understanding and generation. As vector databases and LLMs continue to rise in significance, they are reshaping the landscape of AI-driven applications, ensuring efficient handling and utilization of vast amounts of data.

Ayesha Saleem Possess a passion for revamping the brands with meaningful Content Writing, Copywriting, Email Marketing, SEO writing, Social Media Marketing, and Creative Writing.

More On This Topic

  • Python Vector Databases and Vector Indexes: Architecting LLM Apps
  • What are Vector Databases and Why Are They Important for LLMs?
  • A Comprehensive Guide to Ensemble Learning – Exactly What You Need to Know
  • Comprehensive Guide to the Normal Distribution
  • A Comprehensive Guide to MLOps
  • NLP, NLU, and NLG: What’s The Difference? A Comprehensive Guide

KaleidEO Becomes the First Indian Company to Achieve Edge Computing in Space

Bengaluru-based KaleidEO Space Systems has become the first Indian company to demonstrate the power of Edge computing in space, by successfully generating insights from an image taken by an orbiting satellite in real-time.

The team at KaleidEO has successfully demonstrated deep learning based algorithms to analyze imagery in-orbit, as captured by Satellogic – a satellite constellation and data provider company based out of Montevideo, Uruguay.

The hardware to run the algorithms and implementation support was provided by KaleidEO’s partner Spiral Blue, a startup based out of Sydney, Australia. The demonstration further builds SatSure’s positioning within the space data analytics domain globally, with KaleidEO now adding the capability of analyzing satellite imagery at the satellite itself.

KaleidEO has built edge algorithms for cloud detection, road network and building footprint identification, water-body detection, and image template matching for change detection. The success of this technology demonstration is a ramp up to KaleidEO’s own mission of launching four satellites in 2025, which would have this edge computing capability. KaleidEO is a subsidiary company of SatSure Analytics India Pvt Ltd.

“It is an important moment for SatSure and the Indian Space industry as KaleidEO becomes the first Indian company to unlock the potential of Edge computing in space. This capability will enable us to address national security needs, real-time disaster response by governments and revolutionize the way we collect, process, analyze and downlink imagery and insights from satellite data for the benefit of all,” Rashmit Singh Sukhmani, co-founder and CTO of SatSure said.

As part of this demo, a novel engineering pipeline was demonstrated that can handle various stages of the image processing and movement of data seamlessly. An efficiency of almost 80 times faster was achieved, and the data volume reduction between the input and output (analysis ready data) was ~ 99%, reducing the downlink cost.

The demonstration was done on sub-meter resolution imagery, which very few companies in the world have achieved because of the challenges of handling larger sized images.

The post KaleidEO Becomes the First Indian Company to Achieve Edge Computing in Space appeared first on Analytics India Magazine.