The Power of a Semantic Layer: A Data Engineer’s Guide

Sponsored Content

The Power of a Semantic Layer: A Data Engineer's Guide
Data engineers and data analysts are at the forefront of building and managing the data stack, which means they are at the forefront of wrangling the company‘s data chaos. Data chaos comes from the staggering number of data tools people use and the expectations that those tools generate the same answers (rarely true).

The answer? Leverage a semantic layer to reduce the data chaos.

But why does it matter? The Significance of Semantic Layers

Semantic layers play a pivotal role in data analysis. They act as bridges between raw data and actionable insights, helping organizations harness the full potential of their data. A semantic layer consolidates complex data into an understandable format across different teams and tools, effectively translating raw data into standard business terms.

Read the GigaOm Sonar Report on Semantic Layers

This recently published GigaOm report focuses on emerging technologies and market segments. It helps organizations of all sizes understand new technology, its strengths, its weaknesses, and how it can fit into an overall technology strategy. The report is organized into five sections:

  • Overview: An overview of the technology, its major benefits, and possible use cases, as well as an exploration of product implementations already available in the market.
  • Considerations for Adoption: An analysis of the potential risks and benefits of introducing products based on this technology in an enterprise scenario. It looks at table stakes and key differentiating features, as well as considerations for how to integrate the new product into the existing environment.
  • GigaOm Sonar Chart: A graphical representation of the market and its most important players, focused on their value proposition and their roadmap for the future.
  • Vendor Insights: A breakdown of each vendor’s offering in the sector, scored across key characteristics for enterprise adoption.
  • Near-Term Roadmap: A 12- to 18-month forecast of the future development of the technology, its ecosystem, and major players of this market segment.

Semantic layers are not standalone entities but complementary components of a powerful data ecosystem. Semantic layers provide the context and structure needed to understand data.

Cube is highlighted in the GigaOm Sonar Report as a Leader and Fast Mover. They noted Cube's strengths to include strong code-first orientation, native API support, and its analytics pre-processing through caching and pre-aggregations.

Get the Full Report and See for Yourself

For a comprehensive look at Cube's performance and a deeper dive into the world of semantic layers, we encourage you to read the complete GigaOm Sonar report. We offer the report here for free.

More On This Topic

  • Working With The Lambda Layer in Keras
  • Semantic Search: Measuring Meaning From Jaccard to Bert
  • Misconceptions About Semantic Segmentation Annotation
  • Go from Engineer to ML Engineer with Declarative ML
  • Master the Power of Data Analytics: The Four Approaches to Analyzing Data
  • Synthetic Data Platforms: Unlocking the Power of Generative AI for…

Customer Segmentation in Python: A Practical Approach

Customer Segmentation in Python: A Practical Approach
Image by Author | Created Using Excalidraw and Flaticon

Customer segmentation can help businesses tailor their marketing efforts and improve customer satisfaction. Here’s how.

Functionally, customer segmentation involves dividing a customer base into distinct groups or segments—based on shared characteristics and behaviors. By understanding the needs and preferences of each segment, businesses can deliver more personalized and effective marketing campaigns, leading to increased customer retention and revenue.

In this tutorial, we’ll explore customer segmentation in Python by combining two fundamental techniques: RFM (Recency, Frequency, Monetary) analysis and K-Means clustering. RFM analysis provides a structured framework for evaluating customer behavior, while K-means clustering offers a data-driven approach to group customers into meaningful segments. We’ll work with a real-world dataset from the retail industry: the Online Retail dataset from UCI machine learning repository.

From data preprocessing to cluster analysis and visualization, we’ll code our way through each step. So let’s dive in!

Our Approach: RFM Analysis and K-Means Clustering

Let’s start by stating our goal: By applying RFM analysis and K-means clustering to this dataset, we’d like to gain insights into customer behavior and preferences.

RFM Analysis is a simple yet powerful method to quantify customer behavior. It evaluates customers based on three key dimensions:

  • Recency (R): How recently did a particular customer make a purchase?
  • Frequency (F): How often do they make purchases?
  • Monetary Value (M): How much money do they spend?

We’ll use the information in the dataset to compute the recency, frequency, and monetary values. Then, we’ll map these values to the generally used RFM score scale of 1 — 5.

If you’d like, you can explore and analyze further using these RFM scores. But we’ll try to identify customer segments with similar RFM characteristics. And for this, we’ll use K-Means clustering, an unsupervised machine learning algorithm that groups similar data points into clusters.

So let’s start coding!

🔗 Link to Google Colab notebook.

Step 1 – Import Necessary Libraries and Modules

First, let’s import the necessary libraries and the specific modules as needed:

import pandas as pd  import matplotlib.pyplot as plt  from sklearn.cluster import KMeans

We need pandas and matplotlib for data exploration and visualization, and the KMeans class from scikit-learn’s cluster module to perform K-Means clustering.

Step 2 – Load the Dataset

As mentioned, we’ll use the Online Retail dataset. The dataset contains customer records: transactional information, including purchase dates, quantities, prices, and customer IDs.

Let's read in the data that’s originally in an excel file from its URL into a pandas dataframe.

# Load the dataset from UCI repository  url = "https://archive.ics.uci.edu/ml/machine-learning-databases/00352/Online%20Retail.xlsx"  data = pd.read_excel(url)

Alternatively, you can download the dataset and read the excel file into a pandas dataframe.

Step 3 – Explore and Clean the Dataset

Now let’s start exploring the dataset. Look at the first few rows of the dataset:

data.head()
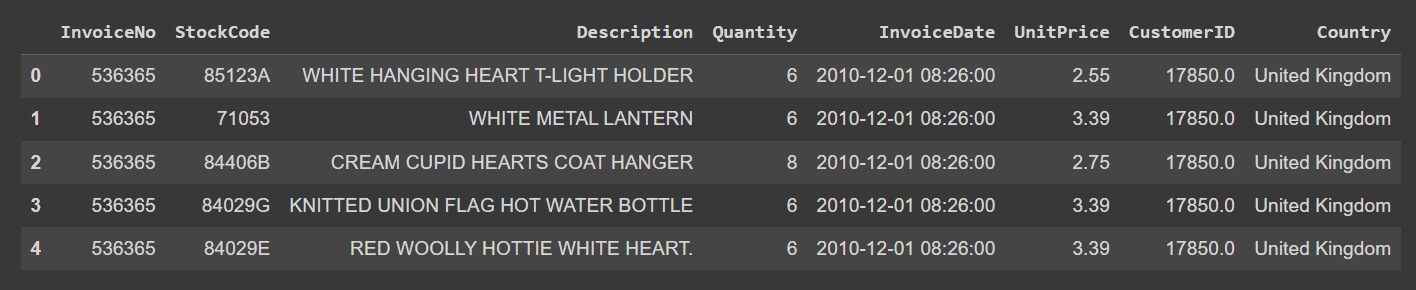
Customer Segmentation in Python: A Practical Approach
Output of data.head()

Now call the describe() method on the dataframe to understand the numerical features better:

data.describe()

We see that the “CustomerID” column is currently a floating point value. When we clean the data, we’ll cast it into an integer:
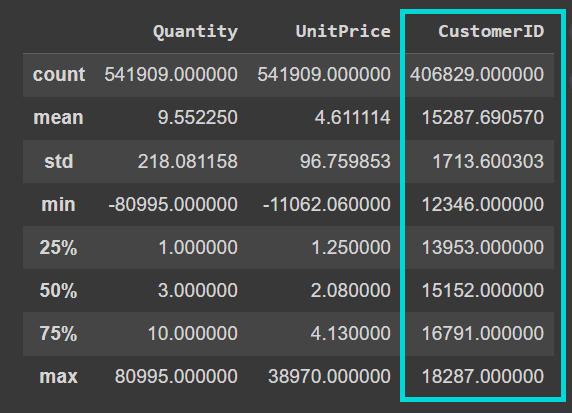
Customer Segmentation in Python: A Practical Approach
Output of data.describe()

Also note that the dataset is quite noisy. The “Quantity” and “UnitPrice” columns contain negative values:
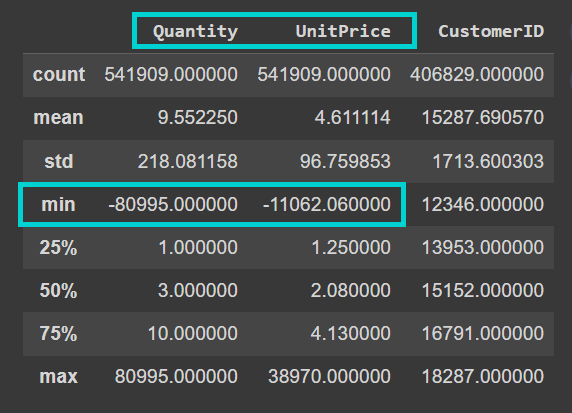
Customer Segmentation in Python: A Practical Approach
Output of data.describe()

Let’s take a closer look at the columns and their data types:

data.info()

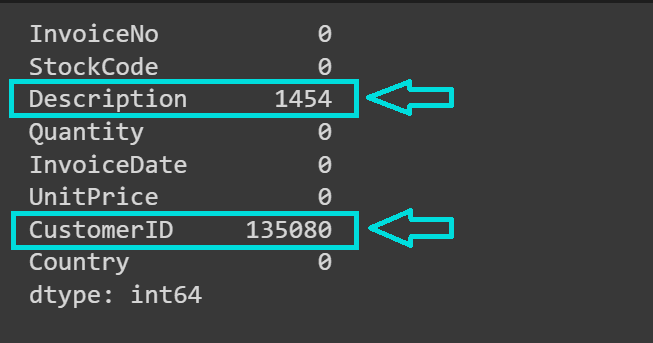
We see that the dataset has over 541K records and the “Description” and “CustomerID” columns contain missing values:
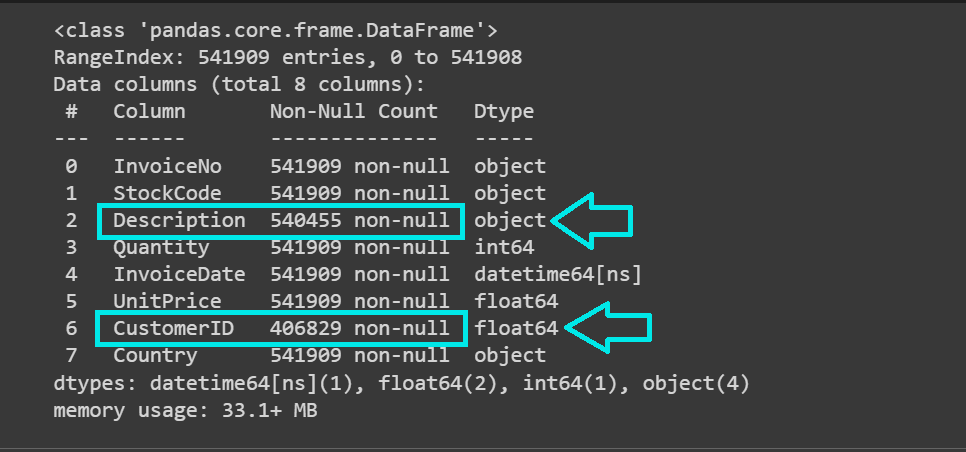
Customer Segmentation in Python: A Practical Approach
Let’s get the count of missing values in each column:

# Check for missing values in each column  missing_values = data.isnull().sum()  print(missing_values)

As expected, the “CustomerID” and “Description” columns contain missing values:
Customer Segmentation in Python: A Practical Approach

For our analysis, we don’t need the product description contained in the “Description” column. However, we need the “CustomerID” for the next steps in our analysis. So let’s drop the records with missing “CustomerID”:

# Drop rows with missing CustomerID  data.dropna(subset=['CustomerID'], inplace=True)

Also recall that the values “Quantity” and “UnitPrice” columns should be strictly non-negative. But they contain negative values. So let's also drop the records with negative values for “Quantity” and “UnitPrice”:

# Remove rows with negative Quantity and Price  data = data[(data['Quantity'] > 0) & (data['UnitPrice'] > 0)]

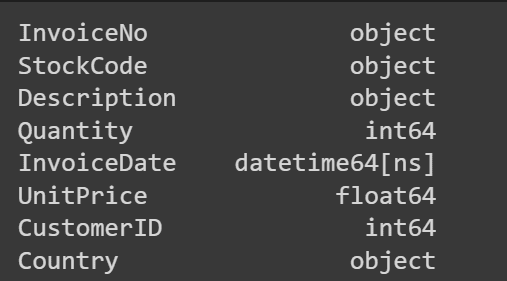
Let’s also convert the “CustomerID” to an integer:

data['CustomerID'] = data['CustomerID'].astype(int)    # Verify the data type conversion  print(data.dtypes)
Customer Segmentation in Python: A Practical Approach

Step 4 – Compute Recency, Frequency, and Monetary Value

Let’s start out by defining a reference date snapshot_date that’s a day later than the most recent date in the “InvoiceDate” column:

snapshot_date = max(data['InvoiceDate']) + pd.DateOffset(days=1)

Next, create a “Total” column that contains Quantity*UnitPrice for all the records:

data['Total'] = data['Quantity'] * data['UnitPrice']

To calculate the Recency, Frequency, and MonetaryValue, we calculate the following—grouped by CustomerID:

  • For recency, we’ll calculate the difference between the most recent purchase date and a reference date (snapshot_date). This gives the number of days since the customer's last purchase. So smaller values indicate that a customer has made a purchase more recently. But when we talk about recency scores, we’d want customers who bought recently to have a higher recency score, yes? We’ll handle this in the next step.
  • Because frequency measures how often a customer makes purchases, we’ll calculate it as the total number of unique invoices or transactions made by each customer.
  • Monetary value quantifies how much money a customer spends. So we’ll find the average of the total monetary value across transactions.
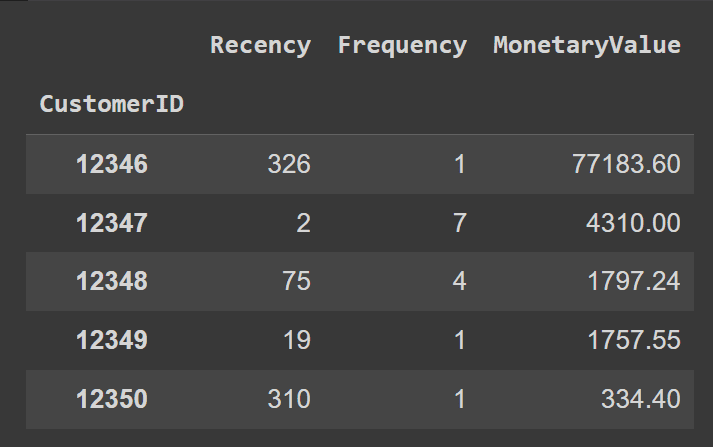
rfm = data.groupby('CustomerID').agg({      'InvoiceDate': lambda x: (snapshot_date - x.max()).days,      'InvoiceNo': 'nunique',      'Total': 'sum'  })

Let’s rename the columns for readability:

rfm.rename(columns={'InvoiceDate': 'Recency', 'InvoiceNo': 'Frequency', 'Total': 'MonetaryValue'}, inplace=True)  rfm.head()
Customer Segmentation in Python: A Practical Approach

Step 5 – Map RFM Values onto a 1-5 Scale

Now let’s map the “Recency”, “Frequency”, and “MonetaryValue” columns to take on values in a scale of 1-5; one of {1,2,3,4,5}.

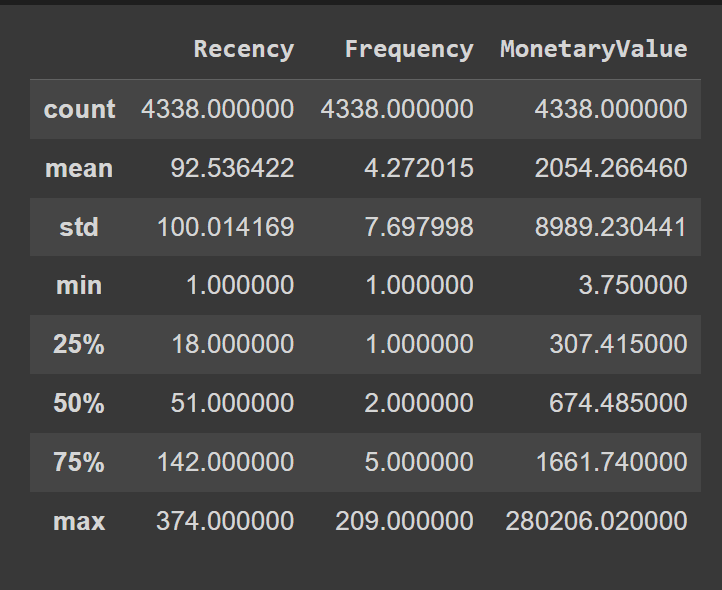
We’ll essentially assign the values to five different bins, and map each bin to a value. To help us fix the bin edges, let’s use the quantile values of the “Recency”, “Frequency”, and “MonetaryValue” columns:

rfm.describe()
Customer Segmentation in Python: A Practical Approach

Here’s how we define the custom bin edges:

# Calculate custom bin edges for Recency, Frequency, and Monetary scores  recency_bins = [rfm['Recency'].min()-1, 20, 50, 150, 250, rfm['Recency'].max()]  frequency_bins = [rfm['Frequency'].min() - 1, 2, 3, 10, 100, rfm['Frequency'].max()]  monetary_bins = [rfm['MonetaryValue'].min() - 3, 300, 600, 2000, 5000, rfm['MonetaryValue'].max()]

Now that we’ve defined the bin edges, let’s map the scores to corresponding labels between 1 and 5 (both inclusive):

# Calculate Recency score based on custom bins   rfm['R_Score'] = pd.cut(rfm['Recency'], bins=recency_bins, labels=range(1, 6), include_lowest=True)    # Reverse the Recency scores so that higher values indicate more recent purchases  rfm['R_Score'] = 5 - rfm['R_Score'].astype(int) + 1    # Calculate Frequency and Monetary scores based on custom bins  rfm['F_Score'] = pd.cut(rfm['Frequency'], bins=frequency_bins, labels=range(1, 6), include_lowest=True).astype(int)  rfm['M_Score'] = pd.cut(rfm['MonetaryValue'], bins=monetary_bins, labels=range(1, 6), include_lowest=True).astype(int)

Notice that the R_Score, based on the bins, is 1 for recent purchases 5 for all purchases made over 250 days ago. But we’d like the most recent purchases to have an R_Score of 5 and purchases made over 250 days ago to have an R_Score of 1.

To achieve the desired mapping, we do: 5 - rfm['R_Score'].astype(int) + 1.

Let’s look at the first few rows of the R_Score, F_Score, and M_Score columns:

# Print the first few rows of the RFM DataFrame to verify the scores  print(rfm[['R_Score', 'F_Score', 'M_Score']].head(10))
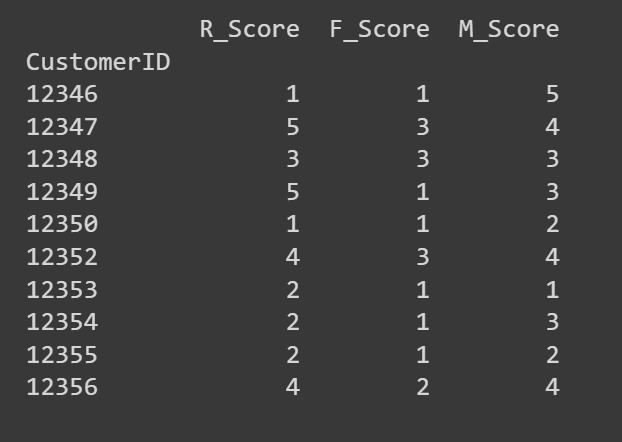
Customer Segmentation in Python: A Practical Approach

If you’d like, you can use these R, F, and M scores to carry out an in-depth analysis. Or use clustering to identify segments with similar RFM characteristics. We’ll choose the latter!

Step 6 – Perform K-Means Clustering

K-Means clustering is sensitive to the scale of features. Because the R, F, and M values are all on the same scale, we can proceed to perform clustering without further scaling the features.

Let’s extract the R, F, and M scores to perform K-Means clustering:

# Extract RFM scores for K-means clustering  X = rfm[['R_Score', 'F_Score', 'M_Score']]

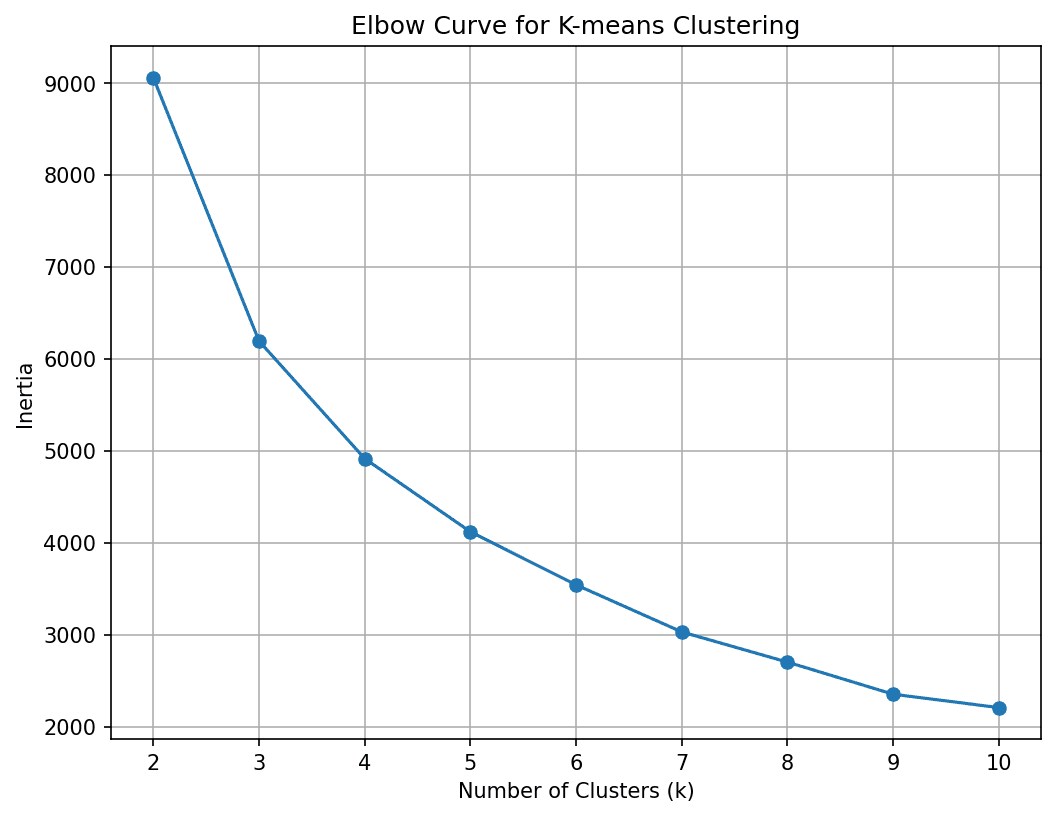
Next, we need to find the optimal number of clusters. For this let’s run the K-Means algorithm for a range of K values and use the elbow method to pick the optimal K:

# Calculate inertia (sum of squared distances) for different values of k  inertia = []  for k in range(2, 11):      kmeans = KMeans(n_clusters=k, n_init= 10, random_state=42)      kmeans.fit(X)      inertia.append(kmeans.inertia_)    # Plot the elbow curve  plt.figure(figsize=(8, 6),dpi=150)  plt.plot(range(2, 11), inertia, marker='o')  plt.xlabel('Number of Clusters (k)')  plt.ylabel('Inertia')  plt.title('Elbow Curve for K-means Clustering')  plt.grid(True)  plt.show()

We see that the curve elbows out at 4 clusters. So let’s divide the customer base into four segments.
Customer Segmentation in Python: A Practical Approach

We’ve fixed K to 4. So let’s run the K-Means algorithm to get the cluster assignments for all points in the dataset:

# Perform K-means clustering with best K  best_kmeans = KMeans(n_clusters=4, n_init=10, random_state=42)  rfm['Cluster'] = best_kmeans.fit_predict(X)

Step 7 – Interpret the Clusters to Identify Customer Segments

Now that we have the clusters, let’s try to characterize them based on the RFM scores.

# Group by cluster and calculate mean values  cluster_summary = rfm.groupby('Cluster').agg({      'R_Score': 'mean',      'F_Score': 'mean',      'M_Score': 'mean'  }).reset_index()

The average R, F, and M scores for each cluster should already give you an idea of the characteristics.

print(cluster_summary)
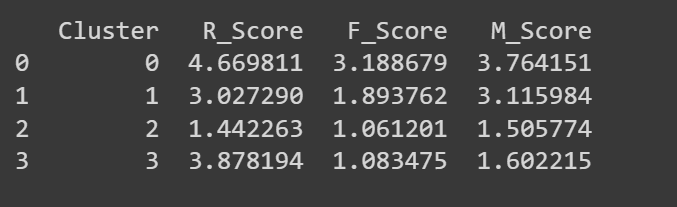
Customer Segmentation in Python: A Practical Approach

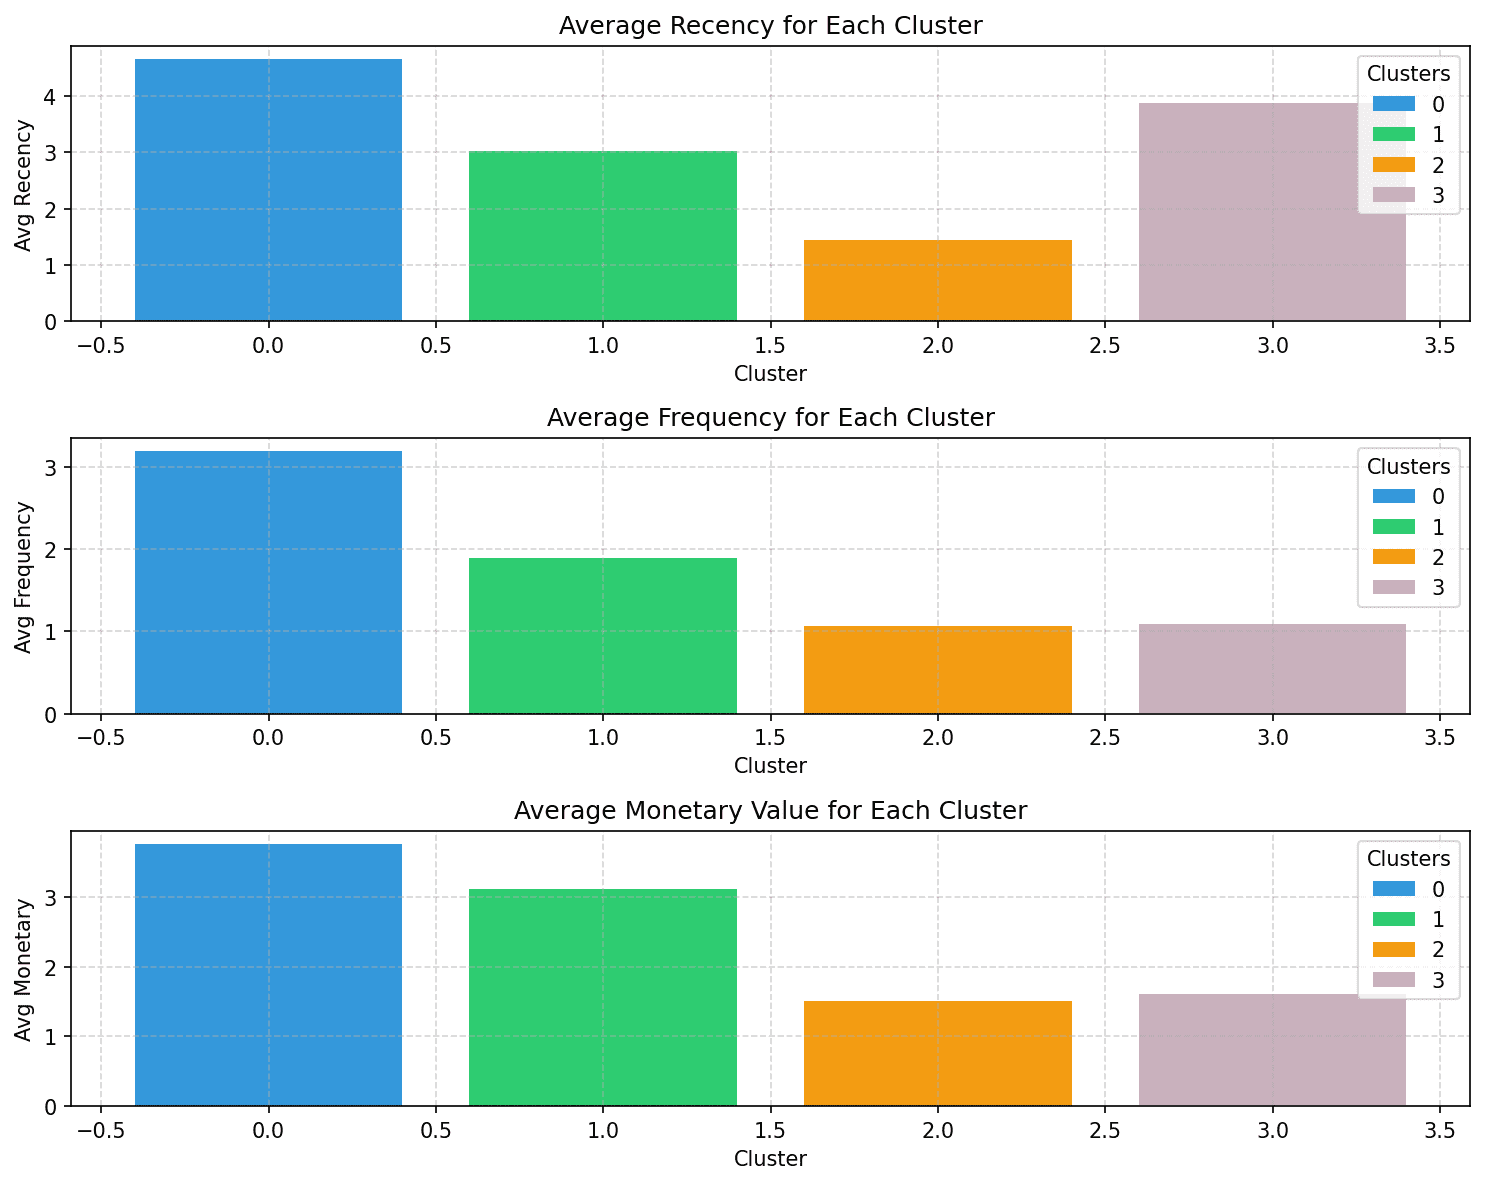
But let’s visualize the average R, F, and M scores for the clusters so it’s easy to interpret:

colors = ['#3498db', '#2ecc71', '#f39c12','#C9B1BD']    # Plot the average RFM scores for each cluster  plt.figure(figsize=(10, 8),dpi=150)    # Plot Avg Recency  plt.subplot(3, 1, 1)  bars = plt.bar(cluster_summary.index, cluster_summary['R_Score'], color=colors)  plt.xlabel('Cluster')  plt.ylabel('Avg Recency')  plt.title('Average Recency for Each Cluster')    plt.grid(True, linestyle='--', alpha=0.5)  plt.legend(bars, cluster_summary.index, title='Clusters')    # Plot Avg Frequency  plt.subplot(3, 1, 2)  bars = plt.bar(cluster_summary.index, cluster_summary['F_Score'], color=colors)  plt.xlabel('Cluster')  plt.ylabel('Avg Frequency')  plt.title('Average Frequency for Each Cluster')  plt.grid(True, linestyle='--', alpha=0.5)  plt.legend(bars, cluster_summary.index, title='Clusters')    # Plot Avg Monetary  plt.subplot(3, 1, 3)  bars = plt.bar(cluster_summary.index, cluster_summary['M_Score'], color=colors)  plt.xlabel('Cluster')  plt.ylabel('Avg Monetary')  plt.title('Average Monetary Value for Each Cluster')  plt.grid(True, linestyle='--', alpha=0.5)  plt.legend(bars, cluster_summary.index, title='Clusters')    plt.tight_layout()  plt.show()
Customer Segmentation in Python: A Practical Approach

Notice how the customers in each of the segments can be characterized based on the recency, frequency, and monetary values:

  • Cluster 0: Of all the four clusters, this cluster has the highest recency, frequency, and monetary values. Let’s call the customers in this cluster champions (or power shoppers).
  • Cluster 1: This cluster is characterized by moderate recency, frequency, and monetary values. These customers still spend more and purchase more frequently than clusters 2 and 3. Let’s call them loyal customers.
  • Cluster 2: Customers in this cluster tend to spend less. They don’t buy often, and haven’t made a purchase recently either. These are likely inactive or at-risk customers.
  • Cluster 3: This cluster is characterized by high recency and relatively lower frequency and moderate monetary values. So these are recent customers who can potentially become long-term customers.

Here are some examples of how you can tailor marketing efforts—to target customers in each segment—to enhance customer engagement and retention:

  • For Champions/Power Shoppers: Offer personalized special discounts, early access, and other premium perks to make them feel valued and appreciated.
  • For Loyal Customers: Appreciation campaigns, referral bonuses, and rewards for loyalty.
  • For At-Risk Customers: Re-engagement efforts that include running discounts or promotions to encourage buying.
  • For Recent Customers: Targeted campaigns educating them about the brand and discounts on subsequent purchases.

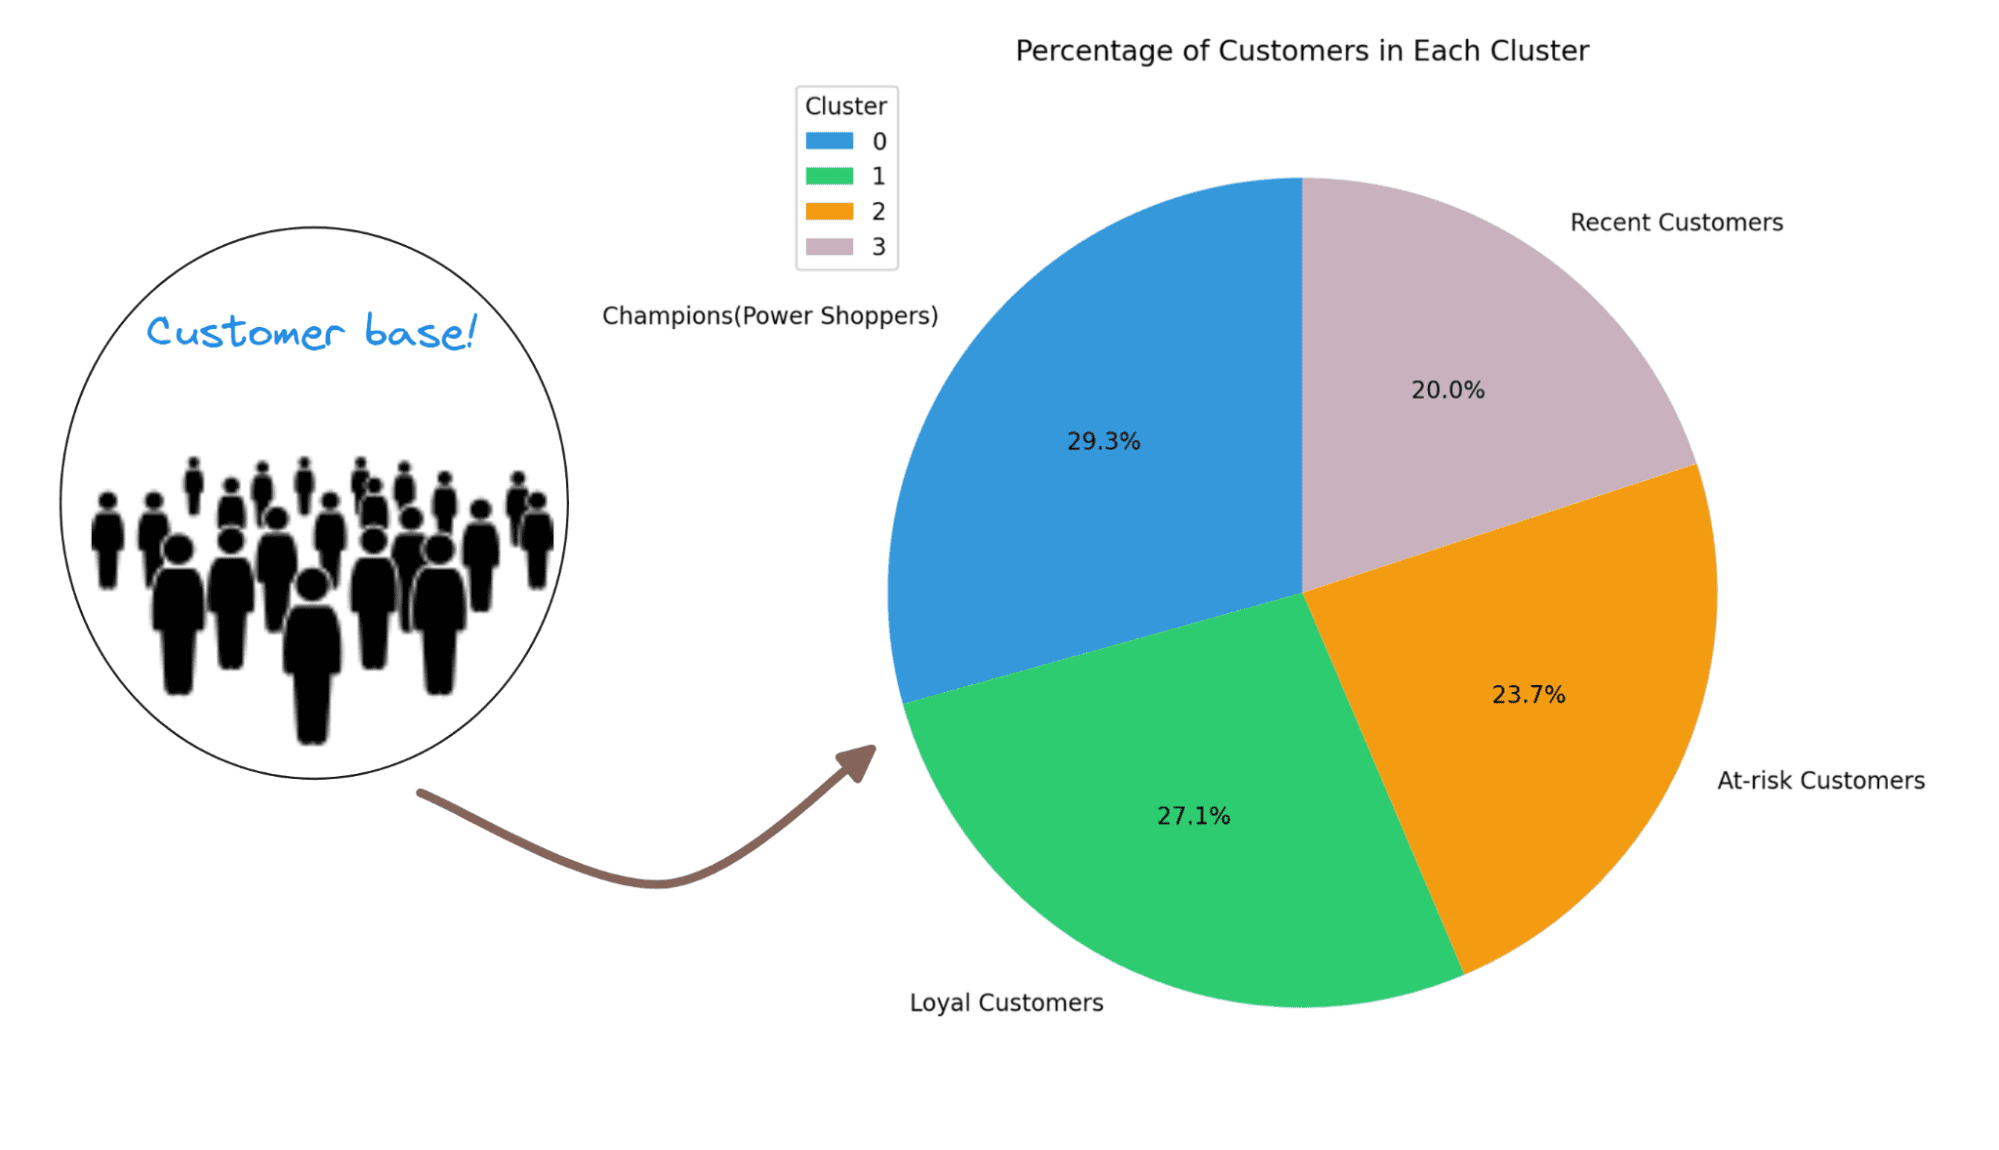
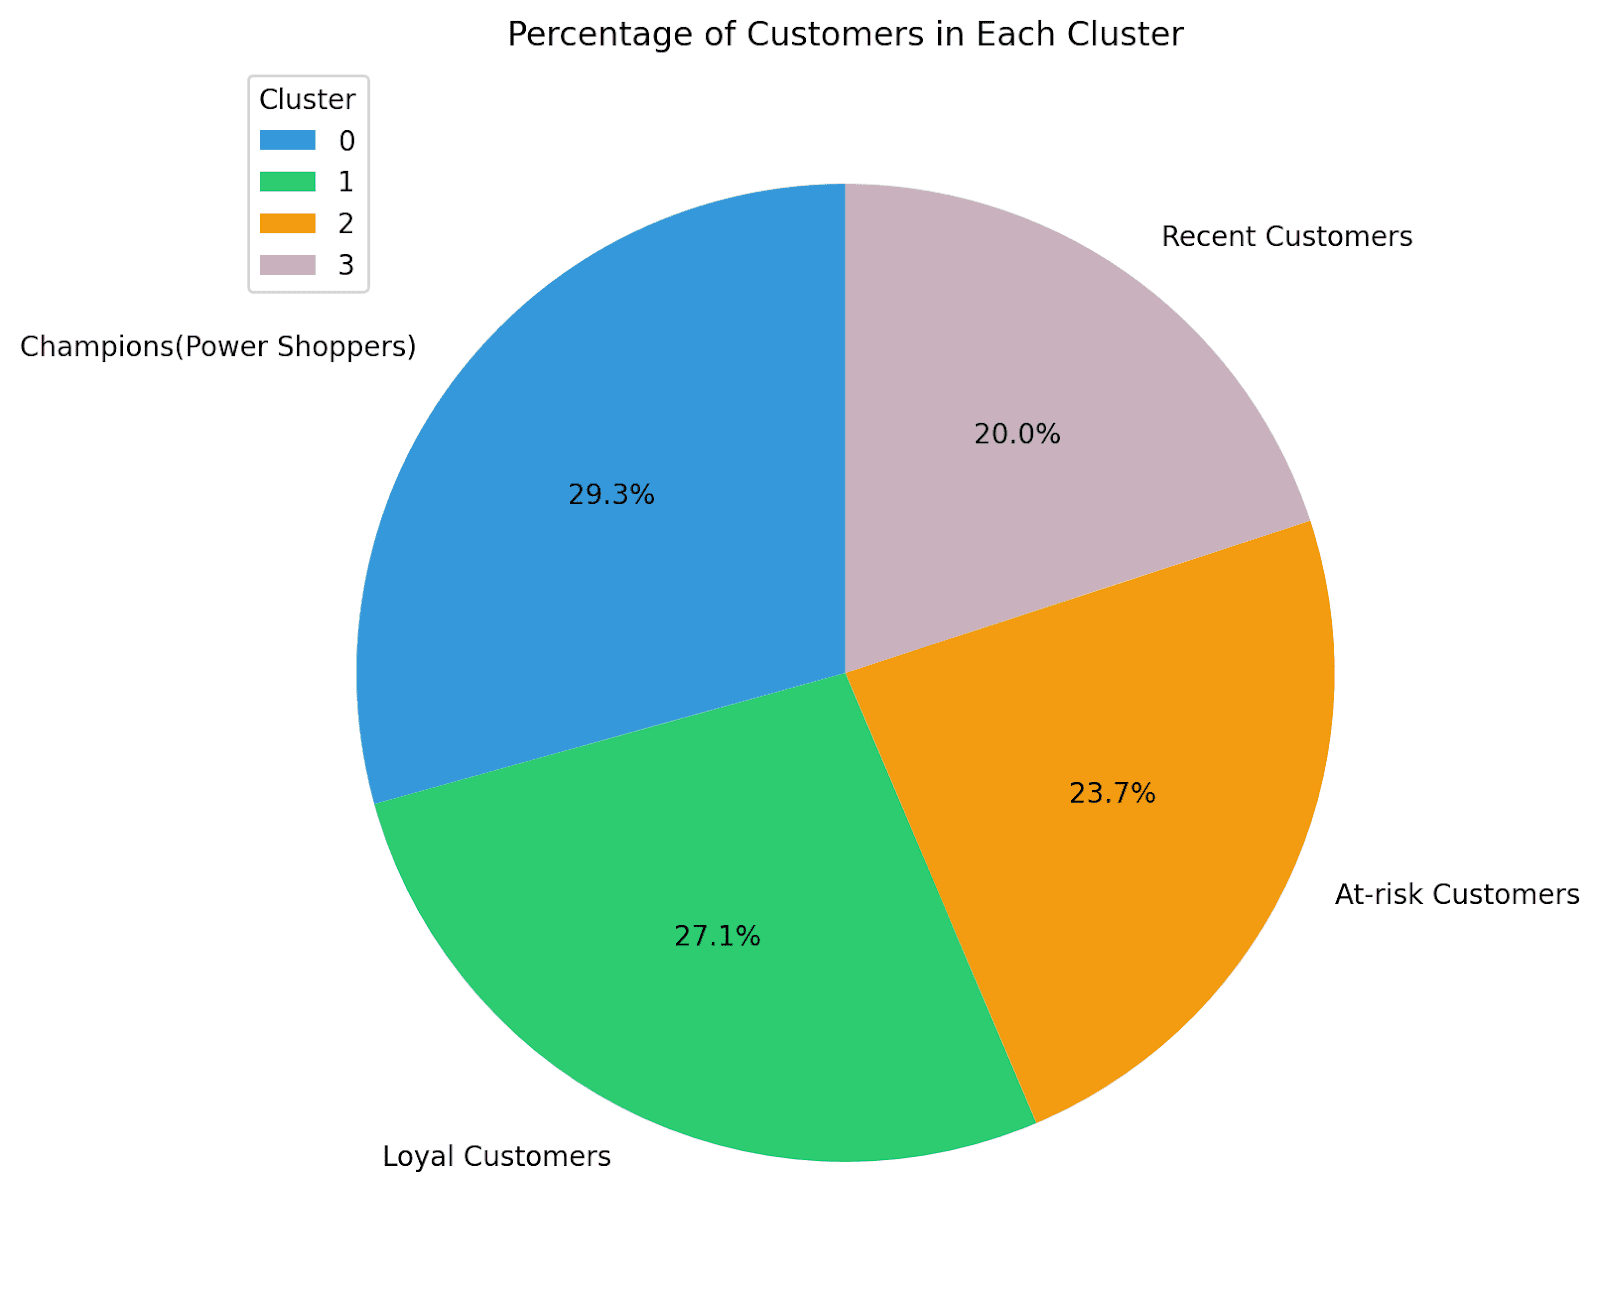
It’s also helpful to understand what percentage of customers are in the different segments. This will further help streamline marketing efforts and grow your business.

Let’s visualize the distribution of the different clusters using a pie chart:

cluster_counts = rfm['Cluster'].value_counts()    colors = ['#3498db', '#2ecc71', '#f39c12','#C9B1BD']  # Calculate the total number of customers  total_customers = cluster_counts.sum()    # Calculate the percentage of customers in each cluster  percentage_customers = (cluster_counts / total_customers) * 100    labels = ['Champions(Power Shoppers)','Loyal Customers','At-risk Customers','Recent Customers']    # Create a pie chart  plt.figure(figsize=(8, 8),dpi=200)  plt.pie(percentage_customers, labels=labels, autopct='%1.1f%%', startangle=90, colors=colors)  plt.title('Percentage of Customers in Each Cluster')  plt.legend(cluster_summary['Cluster'], title='Cluster', loc='upper left')    plt.show()
Customer Segmentation in Python: A Practical Approach

Here we go! For this example, we have quite an even distribution of customers across segments. So we can invest time and effort in retaining existing customers, re-engaging with at-risk customers, and educating recent customers.

Wrapping Up

And that’s a wrap! We went from over 154K customer records to 4 clusters in 7 easy steps. I hope you understand how customer segmentation allows you to make data-driven decisions that influence business growth and customer satisfaction by allowing for:

  • Personalization: Segmentation allows businesses to tailor their marketing messages, product recommendations, and promotions to each customer group's specific needs and interests.
  • Improved Targeting: By identifying high-value and at-risk customers, businesses can allocate resources more efficiently, focusing efforts where they are most likely to yield results.
  • Customer Retention: Segmentation helps businesses create retention strategies by understanding what keeps customers engaged and satisfied.

As a next step, try applying this approach to another dataset, document your journey, and share with the community! But remember, effective customer segmentation and running targeted campaigns requires a good understanding of your customer base—and how the customer base evolves. So it requires periodic analysis to refine your strategies over time.

Dataset Credits

The Online Retail Dataset is licensed under a Creative Commons Attribution 4.0 International (CC BY 4.0) license:

Online Retail. (2015). UCI Machine Learning Repository. https://doi.org/10.24432/C5BW33.
Bala Priya C is a developer and technical writer from India. She likes working at the intersection of math, programming, data science, and content creation. Her areas of interest and expertise include DevOps, data science, and natural language processing. She enjoys reading, writing, coding, and coffee! Currently, she's working on learning and sharing her knowledge with the developer community by authoring tutorials, how-to guides, opinion pieces, and more.

Bala Priya C is a developer and technical writer from India. She likes working at the intersection of math, programming, data science, and content creation. Her areas of interest and expertise include DevOps, data science, and natural language processing. She enjoys reading, writing, coding, and coffee! Currently, she's working on learning and sharing her knowledge with the developer community by authoring tutorials, how-to guides, opinion pieces, and more.

More On This Topic

  • A Practical Approach To Feature Engineering In Machine Learning
  • Free eBook: 10 Practical Python Programming Tricks
  • What is Segmentation?
  • Mastering Clustering with a Segmentation Problem
  • Real Time Image Segmentation Using 5 Lines of Code
  • Segment Anything Model: Foundation Model for Image Segmentation

How does combining blockchain and AI create new business opportunities?

blockchain

Gartner predicts blockchain’s economic impact to reach $176 billion by 2025 and $3.1 trillion by 2030. The AI software market is expected to reach $134.8 billion by 2025.

Blockchain and AI benefit businesses. AI models process data, extract insights, and make decisions. Blockchain ensures data integrity and trust among participants.

Read on to discover the benefits, challenges, and uses of AI and blockchain fusion, and learn how this powerful combination can transform your business.

Blockchain and data analytics can revolutionize decentralized data insights. Blockchain is secure and unchangeable, while data analytics finds valuable insights. This article explores how blockchain and data analytics can improve decision-making.

Understanding blockchain and data analytics

The combination of artificial intelligence and blockchain technology is advantageous to businesses. Investigate the merits of combining these two potent things.

Better automation

AI models streamline the process of developing and verifying smart contracts, which speeds up the agreement-making process for businesses. Blockchain and AI automate labor-intensive business procedures. AI can optimize inventory for supply chain companies, while blockchain improves transparency and accountability.

The use of AI models in smart contracts enables the identification of expired items, the resolution of disputes, and the discovery of environmentally friendly shipping methods. The use of automation can reduce errors while simultaneously saving time and resources.

Improved decision making

Blockchain and AI integration enables better decision-making for organizations. Algorithms used in AI process massive amounts of data in order to discover useful insights and patterns.

Businesses are able to gain insights into their operations, which leads to data-driven decision making, which improves both efficiency and competitiveness. Blockchain’s transparency and auditability help facilitate this process.

Increased security

Dive into the blockchain is a secure platform for storing and transmitting data. The integrity of transactions can be maintained thanks to the ability of AI algorithms to investigate and identify fraudulent activities. AI models increase the reliability of smart contracts by locating and preventing errors in the underlying code. This helps to guarantee that the terms of the contract are adhered to precisely.

Improved authentication

Blockchain and AI enhance authentication. For the purpose of providing users with safe access to digital platforms, The use of biometrics, facial recognition, and behavioral patterns in AI models is employed in the analysis and verification of user identities.

The distributed ledger technology that underpins blockchain enables the safe storage of authentication credentials. The need for companies to rely on potentially vulnerable centralized databases can be eliminated through the creation of decentralized identity management systems.

Transformative augmentation

AI solutions enhance intelligence in blockchain networks by quickly analyzing and connecting data.

Blockchain increases the scalability of AI by providing access to vast amounts of data, both internal and external, which in turn leads to valuable insights. The data’s trustworthiness and transparency are both improved as a result of this.

Exploring most prominent blockchain and AI use cases

AI and blockchain have potential in various industries like finance, life science, AI marketplaces, and the metaverse. Let’s explore their main uses.

Supply chains

AI and blockchain revolutionize supply chains by digitizing processes, offering insights, and ensuring trusted data storage.

Digitizing paper workflows and utilizing blockchain enables real-time tracking of goods from production to delivery. Transparency reduces risks and builds trust among participants, preventing fraud. AI and blockchain help optimize inventory management, logistics, and minimize costs.

The use of artificial intelligence (AI) is enhanced by smart contracts. AI in smart contracts automates tasks like inventory detection and order creation with external suppliers. This improves efficiency.

Data analytics

AI-blockchain synergy improves data analytics with secure, trusted, and accurate data. Blockchain tech boosts data integrity through decentralized storage. Because AI models have access to reliable data, there is no need to be concerned about the accuracy or dependability of the data.

AI can use blockchain for data analysis. Facilitates collaboration as well as decision-making that is driven by data.

Blockchain smart contracts automate data analytics. The use of AI in smart contracts allows for the identification of patterns and the making of predictions.

Blockchain and AI: real-life examples

AI and blockchain are being utilized by companies such as BurstIQ, SingularityNET, Fetch.ai, Matrix AI, Althea AI, and Bext360 to enhance processes and propel innovation.

BurstIQ: healthcare

A revolutionary “Health Wallet” solution is offered by the healthcare provider BurstIQ, which can be found online. The platform manages patients’ information by integrating AI, blockchain technology, and large amounts of data.

The BurstIQ wallet gives medical staff a secure way to access their electronic medical records and participate in wellness programs. The platform gives medical professionals the ability to share patient data for the purpose of research.

The use of blockchain technology protects the confidentiality of patient information and maintains patient privacy. This approach strikes a balance between the sharing of data and the protection of privacy, therefore allowing for the advancement of medical research without putting confidential information at risk.

NFT and the intelligence of the metaverse, including Matrix AI and Althea AI

Matrix AI and Althea AI develop AI tools for metaverse avatars. A protocol for intelligent non-fungible tokens (iNFTs) is currently being developed by Althea AI. Through the use of machine learning, NFTs can learn to respond to cues provided by users.

Matrix AI enables users to create highly realistic metaverse avatars. It analyzes facial features, body structure, and voice patterns to create accurate avatars. This enhances immersion in the metaverse.

Intersection of AI and blockchain challenges

AI and blockchain have potential, but there are challenges to address for successful implementation. Let’s discuss each briefly.

High computational needs. Integrating artificial intelligence solutions, which require a significant amount of computing power, with decentralized blockchains has the potential to make existing problems with scalability and efficiency even worse. In order to overcome obstacles, innovation and robust infrastructure are required.

Protecting one’s privacy and one’s data. Blockchain technology ensures that data is immutable and transparent, but this comes at the cost of the data being stored becoming permanent and potentially accessible to all parties involved. There is a need for concern regarding data privacy in sensitive fields such as healthcare and finance. Trust and widespread adoption of AI and blockchain technologies are dependent on finding a happy medium between data privacy and transparency.

compatibility between systems. Because of the rapid pace of change in both of these areas, there is not enough uniformity and standardization in the frameworks and data formats that are used. Establishing standards and protocols is essential for the interoperability of blockchain technology and artificial intelligence. This will allow for faster synergy and scalability.

Overcoming Challenges and Looking Ahead

1. Scalability and Performance

Addressing scalability issues in blockchain technology is crucial for effective data analytics. Advancements and optimized algorithms will improve scalability.

2. Interoperability

Efforts to improve blockchain interoperability and data analytics tools are ongoing. Seamless integration improves insight derivation.

Conclusion

Blockchain and data analytics can revolutionize decision-making with transparency and data. Using blockchain’s security, immutability, and decentralized data sources, organizations can gain insights that drive efficiencies and innovation across sectors. Technology integration is crucial for shaping the future of data analysis and decision-making.

The best robot vacuum and mop I’ve ever tested is $300 off for October Prime Day

Ecovacs Deebot X2 Omni

You know that gratifying feeling of coming home to a clean house? With a family of five, that's not a feeling I often get, if at all. Enter the Ecovacs Deebot X2 Omni.

Also: Ecovacs announced a new robot vacuum that squares up to the competition

I've tested a fair share of robot vacuum and mop combinations, so I quite appreciate the experience of having a robot roaming around my home that picks up crumbs, dust, and everything in between. But the Deebot X2 Omni is easily the best robot vacuum and mop I've tried so far.

ZDNET RECOMMENDS

Ecovacs Deebot X2 Omni

This high-end robot vacuum and mop has been engineered to give users a hands-free cleaning experience.

View at Amazon

Ecovacs just launched the Deebot X2 Omni this month, a new flagship robot vacuum and mop combo with a clear edge. After testing it out for a couple of weeks, I found room for improvement in some tasks — largely outweighed by its long list of strengths.

The X2 Omni checks all the specs boxes for a high-end robot vacuum and mop. It has 8,000Pa of suction power, higher than the 6,000Pa of the current market leader, the Roborock S8 Pro Ultra. Using artificial intelligence (AI), the robot can detect and avoid objects strewn about the floor, such as socks and charging cables, and has a mopping pad that automatically lifts 15mm when carpets or rugs are detected.

Also: The best robot mops you can buy

The Omni station charges the robot vacuum and mop, and also works as a base where it goes to empty its dustbin and self-wash and dry its mop pads. This feature means you only have to worry about keeping the base station's clean water tank filled and its dirty water tank empty, which is a task you need to complete every few cleaning cycles.

Designed to be a hands-free experience, the base station is also self-cleaning. Running the self-cleaning option in the Ecovacs app will clean the base plate in the station — the spot where your mops are cleaned that typically sees water and dirt accumulation. This feature is a level above competitors like Yeedi, which requires users to periodically clean dirty water at the bottom of the docking station.

The dust bag holds everything the Deebot X2 sweeps from your floors and only needs emptying about once a month, although your mileage may vary.

This closure is supposed to hold four liters of clean water when you carry the clean water tank by the handle.

One of my only gripes is that the clean water tank feels awkward to hold when filled — it almost feels like it's not built to last, although I won't know for certain until I've used it for several months. It's a four-liter water tank with a handle to carry it on the lid, held shut by a plastic clip. I hold the tank from the bottom because I feel like using the handle to carry the full tank around will result in the closure failing and four liters of water going everywhere.

About the square shape

The Deebot X2 Omni has several superpowers, starting with its compact package. The squared edges stood out to me as soon as I unpacked the device, along with how narrow and short it was. At only 12.6 inches wide, it's about 0.3 inches narrower than the Eufy X9 Pro ( which is also on sale for October Prime Day) robot vacuum mop, which had been my super mop until the X2 Omni arrived.

Although 0.3 inches sounds like a small difference in size, it's proven to be considerable when a robot has to navigate through furniture legs. Case in point: the Eufy X9 Pro uses AI to avoid objects, but whenever I sent it to clean the first floor, it'd get stuck between the kitchen barstools legs. The stools are fairly lightweight, so the robot would drag them around instead of signaling it was stuck. I'd see my kitchen barstools gliding around my floor or randomly find one hanging out by the shoe bench.

Also: The best iRobot vacuums

This isn't a big deal and is highly subjective, so it's not something I included in my Eufy review; it's not the robot's fault that it's the exact size as the width of the distance between my barstool's legs. But the narrower Deebot X2 Omni can clean under the barstools and figure its way back out, which means no more 'guess where the barstools are today' games.

The Ecovacs Deebot X2 Omni making its way out of the traveling barstools.

The Deebot X2 is also almost an inch shorter than my Eufy robot vacuum, at 3.7 inches in height. The lower dimensions and narrow build allow the Deebot X2 to clean in places other robots typically can't reach or navigate under.

Some AI-powered features

The Deebot X2 leverages Ecovacs' AIVI 3D 2.0 and combines an AI processor with 3D-structured light sensors with dual-laser LiDAR technology. The result is efficient maps that allow the robot to intelligently detect objects during navigation and clean around them. This feature set means you won't have to ensure your floors are free of charging cables, toys, or shoes before sending out the X2.

The AI-powered navigation and obstacle avoidance, backed by Ecovacs' proprietary AINA Model, uses visual recognition and reinforcement learning that's based on information collected by the sensors.

Also: 6 things to know about robot vacuums before you buy one

The Deebot X2's clever technology also makes for a customized cleaning process, if that's your thing. The device's AI-powered visual recognition, its ability to detect floor type, and its historical cleaning logs let the robot infer which room it's cleaning, such as the kitchen, living room, or bedroom, and to adjust its suction power and mopping mode.

A new level of voice control

Voice control makes everything in my home easier. Countless robot vacuums let you use a third-party virtual assistant for voice control, such as Amazon Alexa, Google Assistant, or Siri. Saying, "Alexa, clean the floors" in my house dispatches the Eufy X9 Pro to clean my bedroom and hallway. However, these assistants are limited in the functions they can make the robot perform.

Sure, you can dispatch your robot with Alexa or Google, but have you ever been able to tell it to "turn right, move three meters forward, turn left, and clean there"?

Also: This robot vacuum connects to your home's water supply for full automation

Ecovacs robot vacuums have a built-in voice assistant named YIKO that users can talk with to control the robot directly — and it works swimmingly. Saying "OK, YIKO" wakes up the voice assistant. If your robot is out cleaning, you can ask it to go back and clean the dining room again, or give it multiple commands in one sentence without pulling up the app.

ZDNET's buying advice

The Ecovacs Deebot X2 Omni is the company's new flagship robot with all the smart features and a price to match, which is why nabbing $300 off during Amazon's Big Deal Days is such a great deal. Over the past few weeks, it's gained a top-dog position in our home, becoming the main robot to clean the entire downstairs floor — and that's saying a lot.

The great thing about an all-in-one, self-emptying, and self-cleaning robot vacuum and mop is that it's not best suited for some circumstances — it's suited for all. Some mid-range models might be great at mopping but suffer from not having strong or effective suction, making them best-suited for homes with hard floors. Others might boast great suction power, okay mopping, and short battery life, making them best for mostly carpeted apartments or small homes.

The Deebot X2 Omni is great at all of these things. The biggest challenge in our home is downstairs because it's mostly hardwood and tile with some area rugs — it's the area where the dog comes in and out from the yard, where we cook, and where the toddler drops most of the crumbs.

Also: Skip the Dyson: This $150 stick vacuum is just as powerful (and can mop, too)

As mentioned above, the X2 Omni costs $1,500, but is currently $300 off for a limited time. That's compared to $1,600 for the Roborock S8 Pro Ultra. Suppose I were on the market for a hands-free robot vacuum and mop that's suitable for my home's complex needs. In that case, I'd have to choose the Deebot X2 Omni over the Roborock's flagship because the extra features, like the self-cleaning station and stronger suction, set it apart, and that current price can't be beat.

Adobe Firefly can now generate more realistic images

Adobe Firefly can now generate more realistic images Frederic Lardinois @fredericl / 7 hours

At MAX, its annual conference for creatives, Adobe today announced that it has updated the models that power Firefly, its generative AI image creation service. According to Adobe, the Firefly Image 2 Model, as it’s officially called, will be better at rendering humans, for example, including facial features, skin, body and hands (which have long vexed similar models).

Adobe also today announced that Firefly’s users have now generated three billion images since the service launched about half a year ago, with one billion generated last month alone. The vast majority of Firefly users (90%) are also net-new to Adobe’s products. The majority of these users surely use the Firefly web app, which helps explain why a few weeks ago, the company decided to turn what was essentially a demo site for Firefly into a full-fledged Creative Cloud service.

Image Credits: Adobe

Alexandru Costin, Adobe’s VP for generative AI and Sensei, told me that the new model wasn’t just trained on more recent images from Adobe Stock and other commercially safe sources, but also that it is significantly larger. “Firefly is an ensemble of multiple models and I think we’ve increased their sizes by a factor of three,” he told me. “So it’s like a brain that’s three times larger and that will know how to make these connections and render more beautiful pixels, more beautiful details for the user.” The company also increased the dataset by almost a factor of two, which in turn should give the model a better understanding of what users are asking for.

That larger model is obviously more resource-intensive, but Costin noted that it should run at the same speed as the first model. “We’re continuing our explorations and investment in the distillation, pruning, optimization, and quantization. There’s a lot of work going into making sure customers get a similar experience, but we don’t balloon the cloud costs too much.” Right now, though, Adobe’s focus is on quality over optimization.

For now, the new model will be available through the Firefly web app, but it will also come to Creative Cloud apps like Photoshop, where it powers popular features like generative fill, in the near future. That’s also something Costin stressed. The way Adobe thinks about generative AI isn’t so much about content creation but generative editing, he said.

“What we’ve seen our customers do, and this is why Photoshop generative fill is so successful, is not generating new assets only but it’s taking existing assets — a photo shoot, a product shoot — and then using generative capabilities to basically enhance existing workflows. So we’re calling our umbrella term for defining generative as more generative editing than just text-to-image because we think that’s more important for our customers.”

With this new model, Adobe is also introducing a few new controls in the Firefly web app that now allow users to set the depth of field for their images, as well as motion blur and field of view settings. Also new is the ability to upload an existing image and then have Firefly match the style of that image, as well as a new auto-complete feature for when you write your prompts (which Adobe says is optimized to help you get to a better image).

With Firefly, Adobe gets into the generative AI game

MongoDB Announced New Generative AI Features for Developers

At MongoDB.local in London, the non-relational database giant has introduced a set of generative AI features across various tools to streamline and enhance application development and modernisation.

The MongoDB Relational Migrator now includes AI-powered capabilities that significantly improve the migration process from legacy database technologies to MongoDB Atlas. This tool automates the conversion of SQL queries and stored procedures in legacy applications to development-ready MongoDB Query API syntax, allowing organisations to accelerate their migration efforts without requiring extensive knowledge of MongoDB Query Syntax API.

In MongoDB Compass, the data interaction tool, developers can now leverage natural language to swiftly generate executable MongoDB Query API syntax. By entering commands such as ‘Filter pizza orders by size, group the remaining documents by pizza name, and calculate the total quantity,’ developers receive suggested code to execute the necessary aggregation pipeline stages. This natural language capability enables developers to focus more on shipping data-driven applications, reducing the manual effort required for complex queries and aggregations.

Data visualisation tool MongoDB Atlas Charts has integrated AI-powered capabilities to facilitate the creation of visualisations using natural language commands. Developers can input queries like ‘Show me a comparison of annual revenue by country and product,’ and MongoDB Atlas Charts will swiftly generate the requested visualization. The familiar drag-and-drop interface then allows for further refinement and customization, enabling developers to efficiently create, share, and embed visualizations.

Additionally, MongoDB Documentation now features an AI-powered chatbot that provides quick and intuitive answers to developers’ questions. Developers can ask about MongoDB’s products and services, troubleshoot issues during software development, and receive step-by-step instructions, example code, and links to references. The chatbot, an open-source project utilising MongoDB Atlas Vector Search, facilitates information retrieval with context, allowing developers to build and deploy their own chatbots for various use cases. This integration of generative AI features across MongoDB tools aims to reduce the time and effort spent on undifferentiated tasks, allowing developers to focus on innovation and creating exceptional end-user experiences.

Two weeks ago, the NY-based company introduced features in MongoDB Atlas Vector Search that benefit generative AI application development. These features enhance information LLMs by expanding query capabilities and facilitating a dedicated data aggregation stage, reducing inaccuracies. The platform also accelerates data indexing for generative AI applications by simplifying the indexing process for operational data, metadata, and vector data, thereby speeding up the development of AI-powered applications.

Read more: Is MongoDB Vector Search the Panacea for all LLM Problems?

The post MongoDB Announced New Generative AI Features for Developers appeared first on Analytics India Magazine.

Generative AI megatrends: Gen AI start-up ecosystem

Robot hands point to laptop button advisor chatbot robotic artificial intelligence concept. Generative Ai

One of my students asked me:

“Which is the best area/s for Gen AI start-ups?”

This is not an easy question – mainly due to the dynamic nature of AI, but here are two reference points.

The first is a Generative AI Tools Landscape from datacamp. This gives both the categories and the subcategories for focus areas in Gen AI. One could argue that is is a list of Gen AI tools (and hence not applications) – but still its a good list

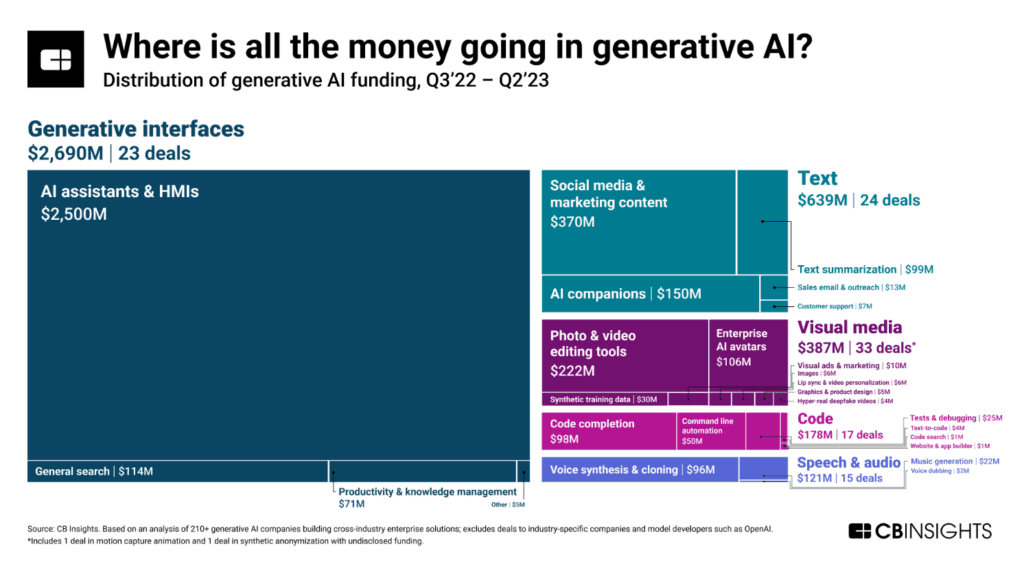
The second reference point is CB insights below which shows that a majority of the investment is going to AI assistants – as an application category – which I would also broadly agree.

Generative AI megatrends: Gen AI start-up ecosystem

In any case, this is a rapidly moving space – so we need to watch this space!

Text Applications

Search

  • Search: Internet
  • Search: Enterprise, Sales, Marketing & Accounting
  • Search: Jobs
  • Search: Books, Images, Podcasts, Videos, & TV
  • Search: Research
  • Search: Programming/Software Development

Chat

  • Sales & Marketing Copy Generation
  • Email Generation
  • Other Copy Generation
  • Note-Taking & Document Summarization
  • Writing Assistance & Translation

Image Applications

2D Image Generation

  • Web Design, Color Palette Generation
  • Image Editing, Enhancement & Style Transfer
  • Ad Generation
  • Presentations/Slide Generation
  • 3D Image Generation

Digital People Generation

Video Applications

  • Video Generation From Text
  • Video Editing
  • Video Personalization & Derivative Content Generation
  • Audio Applications

Music Generation

Text to Speech

Speech to Text (Transcription)

  • Transcription: General
  • Transcription: Note Taking
  • Transcription: Subtitle Generation
  • Transcription: Podcasts
  • Transcription: APIs
  • Transcription: Other

Dubbing

  • Music Editing & Processing
  • Speech Editing & Processing

Coding Applications

  • Website Generation from Text
  • Website Generation from Figma Designs
  • Website Personalization & Optimization
  • Code Generation/Completion

Code Analysis & DevOps Intelligence

Documentation Generation

Data Applications

  • Automated Analysis & Insights
  • Machine Learning & DataOps
  • Synthetic Training Data Generation

Bots

  • Chatbots
  • Personal Assistants & AI Agents

Other Applications

  • Gaming
  • Drug Development
  • Language Learning
  • Miscellaneous

Source/References

https://www.datacamp.com/cheat-sheet/the-generative-ai-tools-landscape

https://www.cbinsights.com/research/generative-ai-funding-top-startups-investors/

ISRO to Use LiFi for Satellite Communication

The Indian Space Research Organization (ISRO) has entered into a partnership with Nav Wireless Technologies to employ LiFi (Light Fidelity) technology for satellite communication in space.

This collaboration represents a significant shift in space communication technology, leveraging optical wireless technologies over traditional Radio Frequency (RF) systems.

With the advent of LiFi, ISRO’s Space Applications Centre (SAC) aims to implement high-speed, secure quantum key communication between base stations and satellites, both in space and on Earth. This technology will facilitate quantum key distribution (QKD) and pointing acquisition and tracking (PAT) for satellite-to-satellite communications within the cosmos. The integration of LiFi technology is poised to play a pivotal role in ISRO’s upcoming space exploration programs.

The memorandum of understanding (MoU) inked between SAC/ISRO and Nav Wireless Technologies spans a 3 year period, and is endorsed by the Department of Telecom (DoT). Notably, Nav Wireless Technologies is the first Indian company to provide LiFi technology to SAC.

Hardik Soni, co-founder and Chief Technology Officer (CTO) of Nav Wireless Technologies Pvt Ltd, said “Very few space agencies in the world are currently using LiFi technology for secured communication between base stations and for satellite communications around the globe.”

LiFi, also known as Light Fidelity, harnesses the transmission of data through a spectrum of light beams, accommodating both indoor and outdoor environments. Additionally, it addresses the connectivity challenges faced in rural regions where traditional fibre optic cables or networks are not readily available.

ISRO has been partnering rapidly with companies to introduce new technologies and make space exploration better and faster in the ever-growing space industry. The space organisation recently partnered with Amazon Web services to help it integrate cloud technologies. India’s space industry has been in the spotlight after the successful launch of Chandrayaan-3.

The Indian Space Research Organization (ISRO) has entered into a partnership with Nav Wireless Technologies to employ LiFi (Light Fidelity) technology for satellite communication in space.

This collaboration represents a significant shift in space communication technology, leveraging optical wireless technologies over traditional Radio Frequency (RF) systems.

With the advent of LiFi, ISRO’s Space Applications Centre (SAC) aims to implement high-speed, secure quantum key communication between base stations and satellites, both in space and on Earth. This technology will facilitate quantum key distribution (QKD) and pointing acquisition and tracking (PAT) for satellite-to-satellite communications within the cosmos. The integration of LiFi technology is poised to play a pivotal role in ISRO’s upcoming space exploration programs.

The memorandum of understanding (MoU) inked between SAC/ISRO and Nav Wireless Technologies spans a 3 year period, and is endorsed by the Department of Telecom (DoT). Notably, Nav Wireless Technologies is the first Indian company to provide LiFi technology to SAC.

Hardik Soni, co-founder and Chief Technology Officer (CTO) of Nav Wireless Technologies Pvt Ltd, said “Very few space agencies in the world are currently using LiFi technology for secured communication between base stations and for satellite communications around the globe.”

LiFi, also known as Light Fidelity, harnesses the transmission of data through a spectrum of light beams, accommodating both indoor and outdoor environments. Additionally, it addresses the connectivity challenges faced in rural regions where traditional fibre optic cables or networks are not readily available.

ISRO has been partnering rapidly with companies to introduce new technologies and make space exploration better and faster in the ever-growing space industry. The space organisation recently partnered with Amazon Web services to help it integrate cloud technologies. India’s space industry has been in the spotlight after the successful launch of Chandrayaan-3.

The post ISRO to Use LiFi for Satellite Communication appeared first on Analytics India Magazine.

Understanding Classification Metrics: Your Guide to Assessing Model Accuracy

Understanding Classification Metrics: Your Guide to Assessing Model Accuracy
Image by Author Motivation

Evaluation metrics are like the measuring tools we use to understand how well a machine learning model is doing its job. They help us compare different models and figure out which one works best for a particular task. In the world of classification problems, there are some commonly used metrics to see how good a model is, and it's essential to know which metric is right for our specific problem. When we grasp the details of each metric, it becomes easier to decide which one matches the needs of our task.

In this article, we will explore the basic evaluation metrics used in classification tasks and examine situations where one metric might be more relevant than others.

Basic Terminology

Before we dive deep into evaluation metrics, it is critical to understand the basic terminology associated with a classification problem.

Ground Truth Labels: These refer to the actual labels corresponding to each example in our dataset. These are the basis of all evaluation and predictions are compared to these values.

Predicted Labels: These are the class labels predicted using the machine learning model for each example in our dataset. We compare such predictions to the ground truth labels using various evaluation metrics to calculate if the model could learn the representations in our data.

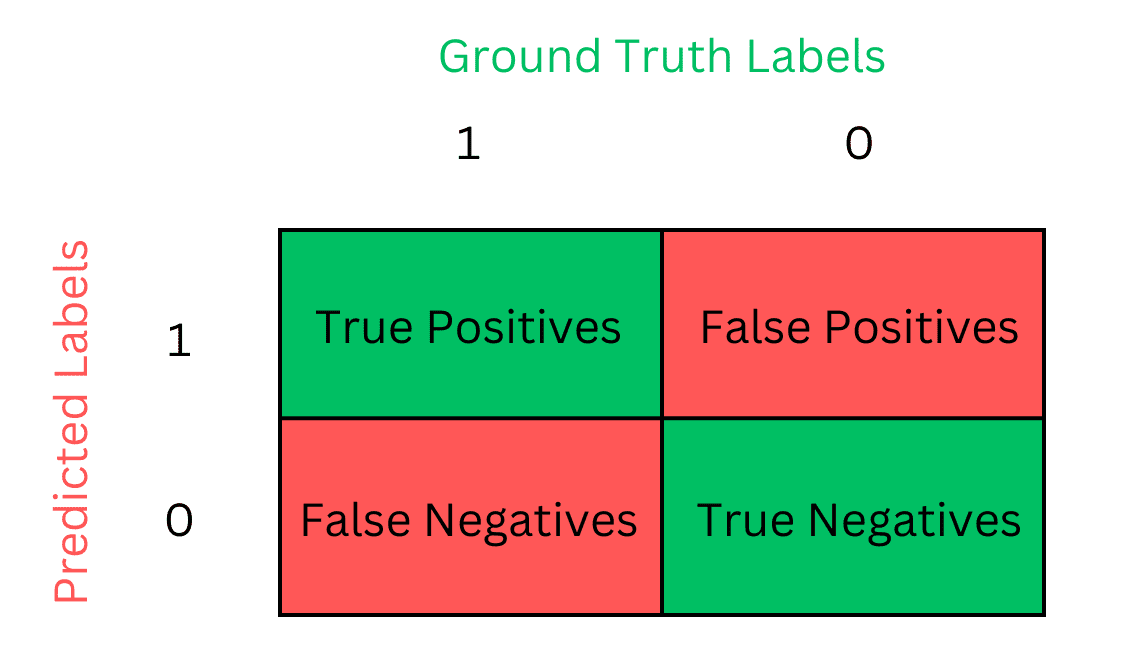
Now, let us only consider a binary classification problem for an easier understanding. With only two different classes in our dataset, comparing ground truth labels with predicted labels can result in one of the following four outcomes, as illustrated in the diagram.

Understanding Classification Metrics: Your Guide to Assessing Model Accuracy
Image by Author: Using 1 to denote a positive label and 0 for a negative label, the predictions can fall into one of the four categories.

True Positives: The model predicts a positive class label when the ground truth is also positive. This is the required behaviour as the model can successfully predict a positive label.

False Positives: The model predicts a positive class label when the ground truth label is negative. The model falsely identifies a data sample as positive.

False Negatives: The model predicts a negative class label for a positive example. The model falsely identifies a data sample as negative.

True Negatives: The required behavior as well. The model correctly identifies a negative sample, predicting 0 for a data sample having a ground truth label of 0.

Now, we can build upon these terms to understand how common evaluation metrics work.

Accuracy

This is the most simple yet intuitive way of assessing a model’s performance for classification problems. It measures the proportion of total labels that the model correctly predicted.

Therefore, accuracy can be computed as follows:

Understanding Classification Metrics: Your Guide to Assessing Model Accuracy

or

Understanding Classification Metrics: Your Guide to Assessing Model Accuracy

When to Use

  • Initial Model Assessment

Given its simplicity, accuracy is a widely used metric. It provides a good starting point for verifying if the model can learn well before we use metrics specific to our problem domain.

  • Balanced Datasets

Accuracy is only suitable for balanced datasets where all class labels are in similar proportions. If that is not the case, and one class label significantly outnumbers the others, the model may still achieve high accuracy by always predicting the majority class. The accuracy metric equally penalizes the wrong predictions for each class, making it unsuitable for imbalanced datasets.

  • When Misclassification costs are equal

Accuracy is suitable for cases where False Positives or False Negatives are equally bad. For example, for a sentiment analysis problem, it is equally bad if we classify a negative text as positive or a positive text as negative. For such scenarios, accuracy is a good metric.

Precision

Precision focuses on ensuring we get all positive predictions correct. It measures what fraction of the positive predictions were actually positive.

Mathematically, it is represented as

Understanding Classification Metrics: Your Guide to Assessing Model Accuracy

When to Use

  • High Cost of False Positives

Consider a scenario where we are training a model to detect cancer. It will be more important for us that we do not misclassify a patient who does not have cancer i.e. False Positive. We want to be confident when we make a positive prediction as wrongly classifying a person as cancer-positive can lead to unnecessary stress and expenses. Therefore, we highly value that we predict a positive label only when the actual label is positive.

  • Quality over Quantity

Consider another scenario where we are building a search engine matching user queries to a dataset. In such cases, we value that the search results match closely to the user query. We do not want to return any document irrelevant to the user, i.e. False Positive. Therefore, we only predict positive for documents that match closely to the user query. We value quality over quantity as we prefer a small number of closely related results instead of a high number of results that may or may not be relevant for the user. For such scenarios, we want high precision.

Recall

Recall, also known as Sensitivity, measures how well a model can remember the positive labels in the dataset. It measures what fraction of the positive labels in our dataset the model predicts as positive.

Understanding Classification Metrics: Your Guide to Assessing Model Accuracy

A higher recall means the model is better at remembering what data samples have positive labels.

When to Use

  • High Cost of False Negatives

We use Recall when missing a positive label can have severe consequences. Consider a scenario where we are using a Machine Learning model to detect credit card fraud. In such cases, early detection of issues is essential. We do not want to miss a fraudulent transaction as it can increase losses. Hence, we value Recall over Precision, where misclassification of a transaction as deceitful may be easy to verify and we can afford a few false positives over false negatives.

F1-Score

It is the harmonic mean of Precision and Recall. It penalizes models that have a significant imbalance between either metric.

Understanding Classification Metrics: Your Guide to Assessing Model Accuracy

It is widely used in scenarios where both precision and recall are important and allows for achieving a balance between both.

When to Use

  • Imbalanced Datasets

Unlike accuracy, the F1-Score is suitable for assessing imbalanced datasets as we are evaluating performance based on the model’s ability to recall the minority class while maintaining a high precision overall.

  • Precision-Recall Trade-off

Both metrics are opposite to each other. Empirically, improving one can often lead to degradation in the other. F1-Score aids in balancing both metrics and is useful in scenarios where both Recall and Precision are equally critical. Taking both metrics into account for calculation, the F1-Score is a widely used metric for evaluating classification models.

Key Takeaways

We've learned that different evaluation metrics have specific jobs. Knowing these metrics helps us choose the right one for our task. In real life, it's not just about having good models; it's about having models that fit our business needs perfectly. So, picking the right metric is like choosing the right tool to make sure our model does well where it matters most.

Still confused about which metric to use? Starting with accuracy is a good initial step. It provides a basic understanding of your model's performance. From there, you can tailor your evaluation based on your specific requirements. Alternatively, consider the F1-Score, which serves as a versatile metric, striking a balance between precision and recall, making it suitable for various scenarios. It can be your go-to tool for comprehensive classification evaluation.
Muhammad Arham is a Deep Learning Engineer working in Computer Vision and Natural Language Processing. He has worked on the deployment and optimizations of several generative AI applications that reached the global top charts at Vyro.AI. He is interested in building and optimizing machine learning models for intelligent systems and believes in continual improvement.

Muhammad Arham is a Deep Learning Engineer working in Computer Vision and Natural Language Processing. He has worked on the deployment and optimizations of several generative AI applications that reached the global top charts at Vyro.AI. He is interested in building and optimizing machine learning models for intelligent systems and believes in continual improvement.

More On This Topic

  • Classification Metrics Walkthrough: Logistic Regression with Accuracy,…
  • Key Issues Associated with Classification Accuracy
  • A Guide to Train an Image Classification Model Using Tensorflow
  • More Performance Evaluation Metrics for Classification Problems You Should…
  • Sky's the Limit: Learn how JetBlue uses Monte Carlo and Snowflake to build…
  • Beyond Accuracy: Evaluating & Improving a Model with the NLP Test Library

Revolutionizing business: A look at generative AI’s real-world impact

generative AI for business

Businesses constantly seek for innovative ways to improve productivity, attract customers, and gain a competitive edge. Generative Artificial Intelligence (Generative AI), among the plethora of transformational technologies that have emerged recently, stands out. This cutting-edge area of AI focuses on building models that can create original material, including music, images, text, and even entire virtual worlds.

Companies can change their creative output, increase client engagement, and put themselves at the forefront of innovation by utilizing the power of generative AI. Small businesses can handle their social media presence more successfully with the help of generative AI.

In order to optimize efficiency, cut costs, and maintain a consistent brand identity, businesses can use AI to evaluate patterns, forecast interaction behaviors, and offer personalized content recommendations. Businesses can create breakthrough generative AI applications by hiring IT consulting services.

Role of generative AI in the real world

Generative artificial intelligence (Generative AI) significantly impacts various industries and real-world applications. Automating the development of text, photos, videos, and music revolutionizes content creation while increasing productivity and lowering production costs. It accelerates scientific development in healthcare by assisting in medication discovery and medical image analysis.

Autonomous vehicles, which improve the efficiency and safety of transportation, are also powered by generative AI for business. It enhances risk analysis and fraud detection in finance. Additionally, it allows for targeted marketing, entertainment, and e-commerce recommendations, improving the user experience. Its real-world effects span a variety of fields and include innovation, creativity, efficiency, and safety.

6 ways that generative AI is disrupting industries

Generative AI, as a revolutionary technology, has reshaped several industries by making them streamline their operations and increase productivity and efficiency. Here are some of the ways in which generative AI’s transformative power is impacting several industries:

Product innovation and design

By creating a wide range of options based on predetermined parameters, generative AI can assist firms in developing cutting-edge and original ideas. Companies can explore broad design space and find advanced concepts that complement their brand identity and client needs by utilizing large language models (LLMs) and machine learning (ML).

As a result, distinctive, alluring items stand out in the marketplace. Customers become more interested, and businesses get a competitive edge.

Content creation

Generative AI has transformed content creation and changed the face of marketing, entertainment, and design by producing text, photos, videos, and music. By streamlining the creative process, technology helps businesses and creators save a lot of time and money.

It makes it possible to quickly produce various content, from articles and adverts to artwork and musical compositions, encouraging creativity and productivity in sectors that rely on content.

Virtual assistants

Generative AI for business helps organizations create intelligent conversational agents like virtual assistants and chatbots. These AI-driven organizations interact with clients, providing tailored advice and support via human-like responses.

This contributes to enhanced efficiency and customer satisfaction by improving numerous operational procedures and overall customer service.

Language translation

Real-time language translation services, which use generative AI to remove language barriers and enable seamless international communication, are crucial. These AI-driven solutions offer quick language translations, fostering global trade, travel, and intercultural understanding.

Generative AI encourages inclusion and global connectedness, facilitating collaboration and understanding across varied linguistic origins by enabling people to interact successfully in their preferred languages.

Gaming

Due to its ability to create realistic virtual landscapes, generative AI has completely changed the simulation and gaming industries. This technology excels at creating immersive and realistic digital landscapes, whether it be for gaming universes, professional training simulations, or architectural design prototypes.

Gamers enjoy greater immersion, professionals gain from practical training scenarios, and architects can see precise details in their designs.

Financial services

By enhancing vital processes like fraud detection, risk assessment, and algorithmic trading, generative AI plays a crucial role in the financial services industry. This is accomplished by utilizing cutting-edge algorithms and data analysis, allowing for speedier and more precise fraud detection, more accurate risk assessment, and trading strategy optimization.

Financial institutions can strengthen their operational efficiency and security measures as a result. This interdependence helps to build more reliable and efficient financial systems, promoting stability within the sector.

Concluding thoughts

In the digital age, generative AI is a powerful accelerator for business transformation. Companies that adopt and skillfully use this breakthrough technology are positioned to gain a significant competitive advantage in the constantly changing business landscape, thanks to the ongoing development of technology and the increasing complexities of generative AI algorithms.

While this revolutionary force comes with challenges, proactive organizations that address these problems head-on can open up diverse opportunities and enjoy several advantages. Organizations can fully utilize generative AI by hiring IT consulting services. To ensure that your company is at the forefront of influencing the future, embrace the disruptive potential of generative AI today.