Microsoft to add Copilot AI to OneDrive, but it will cost you

OneDrive logo on phone

Microsoft 365 users will be able to use the AI-powered Copilot tool to analyze their OneDrive files starting this May. In a Microsoft 365 roadmap spotted by the folks at Neowin, Microsoft revealed that its AI-driven plans for OneDrive will let users ask questions and seek out information about their online files.

"Copilot in OneDrive, available on OneDrive for Web, will allow you to ask questions and get information from files in your OneDrive without having to open the files," Microsoft said in its roadmap. "It will also summarize one or multiple files. Copilot in OneDrive will work on the following file types: DOC, DOCX, FLUID, LOOP, PPT, PPTX, XLSX, PDF, ODT, ODP, RTF, ASPX, RTF, TXT, HTM, and HTML. Copilot in OneDrive requires a Microsoft Copilot for Microsoft 365 license."

Also: Microsoft Copilot vs. Copilot Pro: Is the subscription fee worth it?

Launched last November, Copilot for Microsoft 365 uses AI to help you analyze and work with files in Word, Excel, PowerPoint, Outlook, Microsoft Teams, and other apps in the suite. You can chat with Copilot to ask questions and submit requests about your files. But a subscription costs $30 per month.

In contrast, Microsoft's Copilot Pro plan can help you write and edit text, summarize documents in Word, generate formulas and analyze data in Excel, create presentations in PowerPoint, compose text in OneNote, and draft replies in Outlook. The Pro version doesn't include AI-driven access to Microsoft Teams and won't let you work directly with your OneDrive files on the web. But it is cheaper at $20 per month.

Also: Microsoft is bringing the power of sudo to Windows Server

The basic version of Copilot is also freely available with access via a dedicated website, a Taskbar icon in Windows 10 and 11, and iPhone and Android apps. But only the Pro and Copilot for Microsoft 365 versions let you work directly with your Microsoft Office apps and files.

As for OneDrive, Microsoft has been trying to revamp its file-sharing and syncing service as shown by a recent update. Now rolling out is a new look and layout for OneDrive on the web with options to filter your files by type, more easily create new files, and directly share your files with specific people.

Artificial Intelligence

Colossyan uses GenAI to create corporate training videos

Colossyan uses GenAI to create corporate training videos Kyle Wiggers 18 hours

Most people don’t watch corporate training videos — or, in cases where the training’s mandatory, don’t give them their full attention. According to a recent poll from Kaltura, the video tech provider, 75% of staffers admit to skimming through training videos, watching them without sound or listening to them while multitasking.

So, given that training videos aren’t cheap to produce, is there a way to make them more engaging and thus less of a money sink? Dominik Mate Kovacs, the co-founder and CEO of Colossyan, thinks there is — and it involves GenAI.

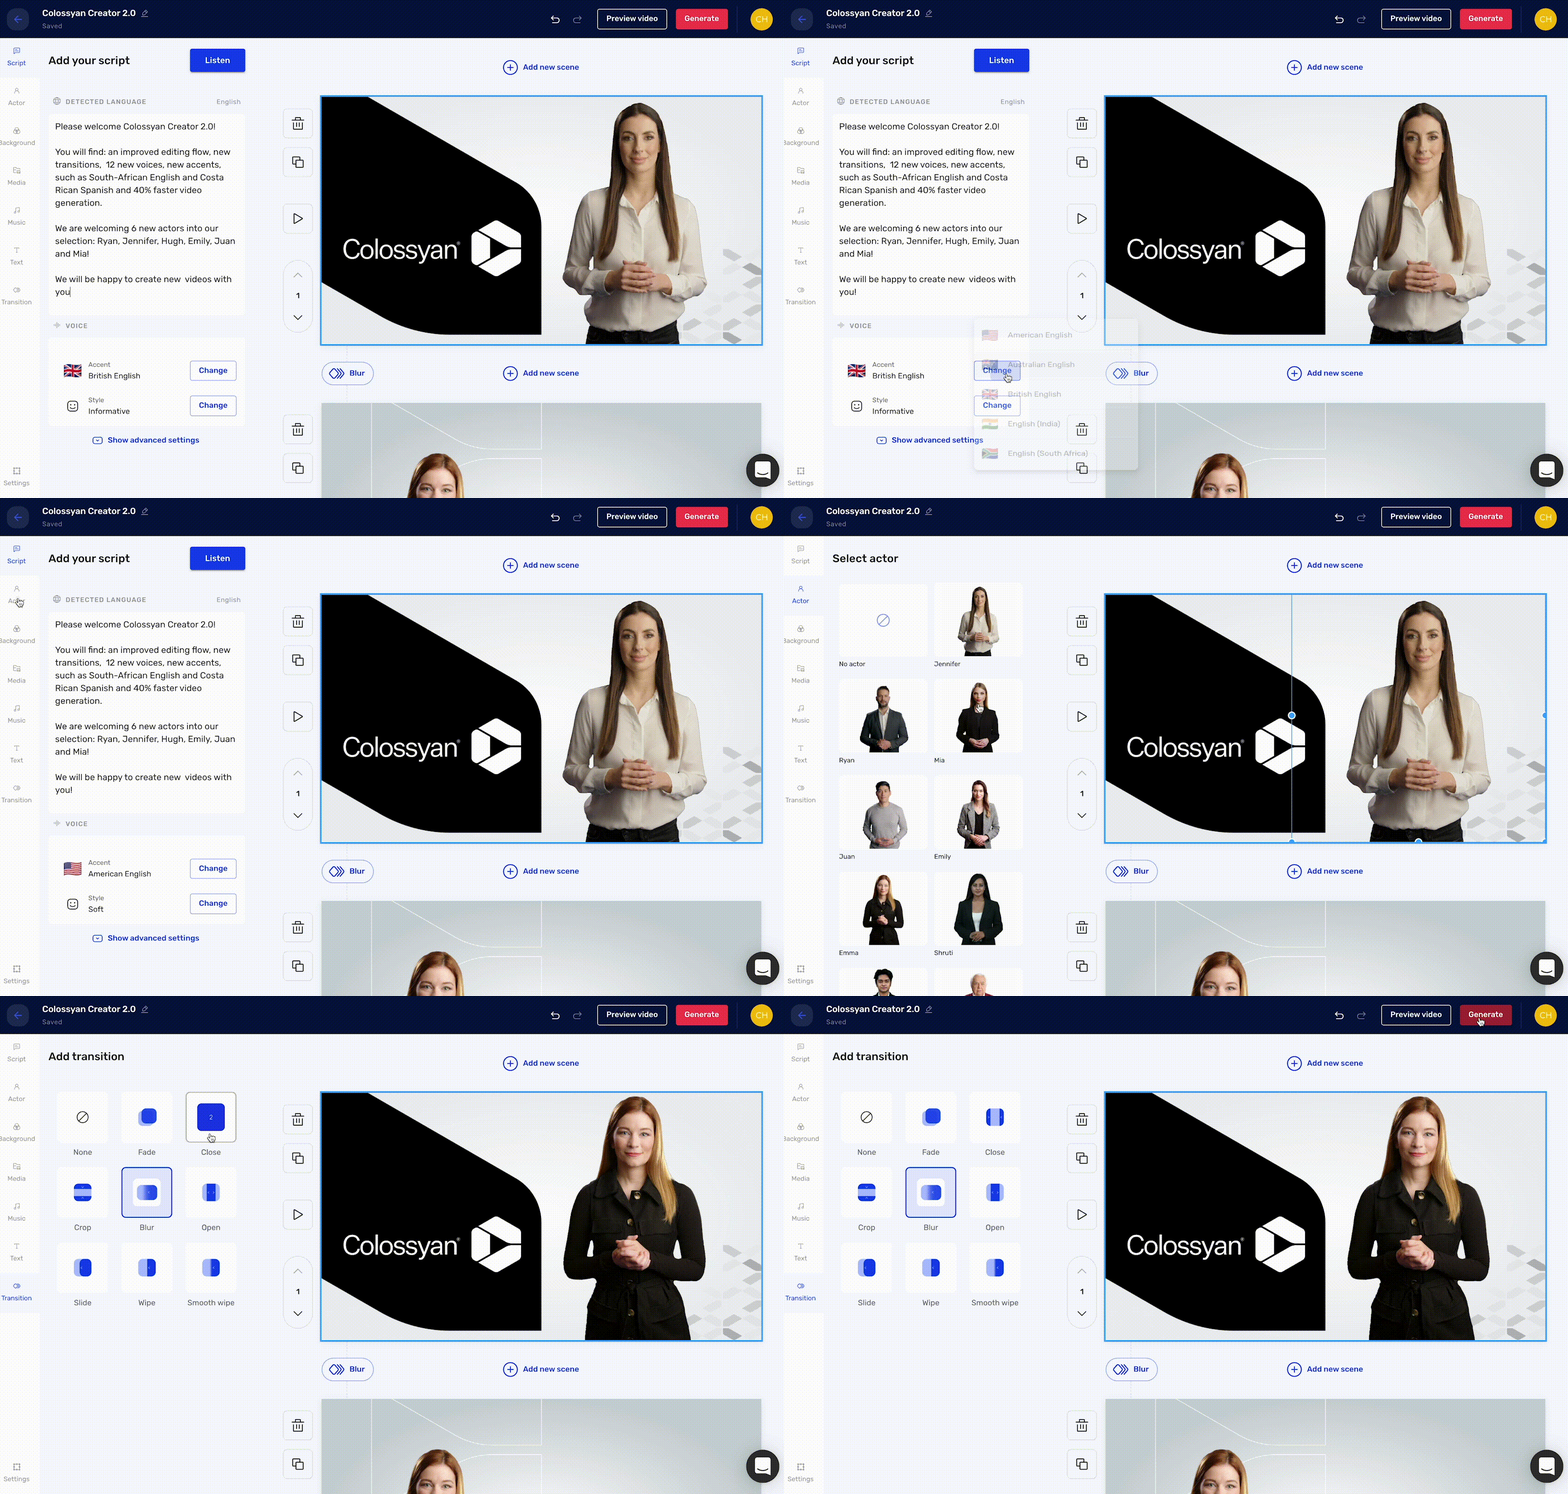
Colossyan taps AI to generate workplace learning videos, remixing, re-animating and editing footage of one of several virtual avatars against changeable backdrops. Users can enter a script to have it “read” aloud by Colossyan’s text-to-speech (TTS) engine, which also translates the script into over 70 languages.

Colossyan

Image Credits: Colossyan

“To generate a video with Colossyan’s AI video platform, all you have to do is input a script and select from a diverse range of avatars,” Kovacs told TechCrunch in an email interview. “Any company can create a video about almost anything efficiently, without the need for conventional filming resources.”

Kovacs founded Colossyan in 2020 after leaving Defudger, a deepfakes detection platform, which he helped to co-launch. An engineer and data scientist by training, Kovacs says that he was inspired to start Colossyan by the budding corporate interest in GenAI.

“Enterprises are leveraging AI in diverse areas such as IT automation, customer care and digital labor — highlighting the broad applicability and potential impact of AI technologies in streamlining operations and enhancing service delivery,” Kovacs said. “The barriers to AI adoption, such as limited AI skills and data complexity, are significant yet surmountable challenges that many organizations are actively working to overcome. ”

For the heck of it, I gave Colossyan’s platform, which offers a free trial, a go to see if I could make a training video that’d successfully hold the attention of my ADHD brain — admittedly a high bar. The avatars were a bit too stiff and cartoonish for my liking and the TTS engine too robotic, at least compared to some of the more sophisticated GenAI tools out there (e.g. ElevenLabs). But I’ve certainly seen worse corporate videos.

Colossyan also doesn’t generate videos as quickly as I’d expect — a 38-second clip takes ~11 minutes. Granted, that’s a lot faster than creating trainings from scratch. But frankly, faced with the prospect of generating more than a handful of videos for whatever purpose, I’d be tempted to go the PowerPoint or Canva route instead.

I’m not Colossyan’s target market, of course. And it seems that several household brands are happy to pay for a subscription to Colossyan as it exists today, including Novartis, Porsche, Vodafone, HPE and Paramount, claims Kovacs.

Kovacs attributes the customer traction to features like integrations with learning management systems and a “conversation mode’ that allows two avatars to hold a dialogue with each other. He doesn’t deny that there’s a fair amount of competition in the GenAI video space — see CommonGround, Synthesia and Surge plus solutions from tech giants like Microsoft — but he thinks that Colossyan’s focus on “interactivity and engagement,” as he puts it, will continue to set the platform apart.

Perhaps he’s right. Colossyan today announced that it raised $22 million in a funding round led by Lakestar with participation from Launchub, Day One Capital and Emerge Education. The proceeds will be put toward tripling Colossyan’s headcount across its New York, London and Budapest offices, Kovacs says, and developing new capabilities like branching videos and knowledge checks.

“For C-suite and IT department leaders, our platform represents a scalable, cost-efficient solution to training and development challenges,” he added.

Comparing Quantization Techniques for Scalable Vector Search

Imagine looking for similar things based on deeper insights instead of just keywords. That's what vector databases and similarity searches help with. Vector databases enable vector similarity search. It uses the distance between vectors to find data points in search queries.

However, similarity search in high-dimensional data can be slow and resource-intensive. Enter Quantization techniques! They play an important role in optimizing data storage and accelerating data retrieval in vector databases.

This article explores various quantization techniques, their types, and real-world use cases.

What is Quantization and How Does it Work?

Quantization is the process of converting continuous data into discrete data points. Especially when you’re dealing with billion-scale parameters, quantization is essential for managing and processing. In vector databases, quantization transforms high-dimensional data into compressed space while preserving important features and vector distances.

Quantization significantly reduces memory bottlenecks and improves storage efficiency.

The process of quantization includes three key processes:

1. Compressing High-Dimensional Vectors

In quantization, we use techniques like codebook generation, feature engineering, and encoding. These techniques compress high-dimensional vector embeddings into a low-dimensional subspace. In other words, the vector is split into numerous subvectors. Vector embeddings are numerical representations of audio, images, videos, text, or signal data, enabling easier processing.

2. Mapping to Discrete Values

This step involves mapping the low-dimensional subvectors to discrete values. The mapping further reduces the number of bits of each subvector.

3. Compressed Vector Storage

Finally, the mapped discrete values of the subvectors are placed in the database for the original vector. Compressed data representing the same information in fewer bits optimizes its storage.

Benefits of Quantization for Vector Databases

Quantization offers a range of benefits, resulting in improved computation and reduced memory footprint.

1. Efficient Scalable Vector Search

Quantization optimizes the vector search by reducing the comparison computation cost. Therefore, vector search requires fewer resources, improving its overall efficiency.

2. Memory Optimization

Quantized vectors allows you to store more data within the same space. Furthermore, data indexing and search are also optimized.

3. Speed

With efficient storage and retrieval comes faster computation. Reduced dimensions allow faster processing, including data manipulation, querying, and predictions.

Some popular vector databases like Qdrant, Pinecone, and Milvus offer various quantization techniques with different use cases.

Use Cases

The ability of quantization to reduce data size while preserving significant information makes it a helpful asset.

Let's dive deeper into a few of its applications.

1. Image and Video processing

Images and video data have a broader range of parameters, significantly increasing computational complexity and memory footprint. Quantization compresses the data without losing important details, enabling efficient storage and processing. This speeds searches for images and videos.

2. Machine Learning Model Compression

Training AI models on large data sets is an intensive task. Quantization helps by reducing model size and complexity without compromising its efficiency.

3. Signal Processing

Signal data represents continuous data points like GPS or surveillance footage. Quantization maps data into discrete values, allowing faster storage and analysis. Furthermore, efficient storage and analysis speed up search operations, enabling faster signal comparison.

Different Quantization Techniques

While quantization allows seamless handling of billion-scale parameters, it risks irreversible information loss. However, finding the right balance between acceptable information loss and compression improves efficiency.

Each quantization technique comes with pros and cons. Before you choose, you should understand compression requirements, as well as the strengths and limitations of each technique.

1. Binary Quantization

Binary quantization is a method that converts all vector embeddings into 0 or 1. If a value is greater than 0, it is mapped to 1, otherwise it is marked as 0. Therefore, it converts high-dimensional data into significantly lower-dimensional allowing faster similarity search.

Formula

The Formula is:

Binary quantization formula. Image by author.

Here’s an example of how binary quantization works on a vector.

BQ Illustration

Graphical representation of binary quantization. Image by author.

Strengths

  • Fastest search, surpassing both scalar and product quantization techniques.
  • Reduces memory footprint by a factor of 32.

Limitations

  • Higher ratio of information loss.
  • Vector components require a mean approximately equal to zero.
  • Poor performance on low-dimensional data due to higher information loss.
  • Rescoring is required for the best results.

Vector databases like Qdrant and Weaviate offer binary quantization.

2. Scalar Quantization

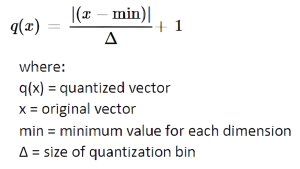
Scalar quantization converts floating point or decimal numbers into integers. This starts with identifying a minimum and maximum value for each dimension. The identified range is then divided into several bins. Lastly, each value in each dimension is assigned to a bin.

The level of precision or detail in quantized vectors depends upon the number of bins. More bins result in higher accuracy by capturing finer details. Therefore, the accuracy of vector search also depends upon the number of bins.

Formula

The formula is:

Scalar quantization formula. Image by author.

Here’s an example of how scalar quantization works on a vector.

SQ Illustration

Graphical representation of scalar quantization. Image by author.

Strengths

  • Significant memory optimization.
  • Small information loss.
  • Partially reversible process.
  • Fast compression.
  • Efficient scalable search due to small information loss.

Limitations

  • A slight decrease in search quality.
  • Low-dimensional vectors are more susceptible to information loss as each data point carries important information.

Vector databases such as Qdrant and Milvus offer scalar quantization.

3. Product Quantization

Product quantization divides the vectors into subvectors. For each section, the center points, or centroids, are calculated using clustering algorithms. Their closest centroids then represent every subvector.

Similarity search in product quantization works by dividing the search vector into the same number of subvectors. Then, a list of similar results is created in ascending order of distance from each subvector’s centroid to each query subvector. Since the vector search process compares the distance from query subvectors to the centroids of the quantized vector, the search results are less accurate. However, product quantization speeds up the similarity search process and higher accuracy can be achieved by increasing the number of subvectors.

Formula

Finding centroids is an iterative process. It uses the recalculation of Euclidean distance between each data point to its centroid until convergence. The formula of Euclidean distance in n-dimensional space is:

Product quantization formula. Image by author.

Here’s an example of how product quantization works on a vector.

PQ Illustration

Graphical representation of product quantization. Image by author.

Strengths

  • Highest compression ratio.
  • Better storage efficiency than other techniques.

Limitations

  • Not suitable for low-dimensional vectors.
  • Resource-intensive compression.

Vector databases like Qdrant and Weaviate offer product quantization.

Choosing the Right Quantization Method

Each quantization method has its pros and cons. Choosing the right method depends upon factors which include but are not limited to:

  • Data dimension
  • Compression-accuracy tradeoff
  • Efficiency requirements
  • Resource constraints.

Consider the comparison chart below to understand better which quantization technique suits your use case. This chart highlights accuracy, speed, and compression factors for each quantization method.

Image by Qdrant

From storage optimization to faster search, quantization mitigates the challenges of storing billion-scale parameters. However, understanding requirements and tradeoffs beforehand is crucial for successful implementation.

For more information on the latest trends and technology, visit Unite AI.

Breaking Down DENSE_RANK(): A Step-by-Step Guide for SQL Enthusiasts

Breaking Down DENSE_RANK(): A Step-by-Step Guide for SQL Enthusiasts
Image by Editor

In today's data-driven world, SQL (Structured Query Language) stands as a cornerstone for managing and manipulating database systems. A core component of SQL's power and flexibility lies in its window functions, a category of functions that perform calculations across sets of rows related to the current row.

Imagine you're looking at your data through a sliding window, and based on the position and size of this window, you perform calculations or transformations on your data. That's essentially what SQL window functions do. They handle tasks like computation of running totals, averages, or rankings, which are challenging to perform using standard SQL commands.

One of the most robust tools in the window functions toolbox is the ranking function, specifically the DENSE_RANK() function. This function is a godsend for data analysts, allowing us to rank different rows of data without any gaps. Whether you're diving into sales figures, website traffic data, or even a simple list of student test scores, DENSE_RANK() is indispensable.

In this article, we'll delve into the inner workings of DENSE_RANK(), juxtaposing it with its close siblings RANK() and ROW_NUMBER(), and showcasing how to avoid common pitfalls that might trip you up in your SQL journey. Ready to level up your data analysis skills? Let's dive in.

Understanding the Role of Ranking Functions in SQL

Ranking functions in SQL are a subset of window functions that assign a unique rank to each row within a result set. These rank values correspond to a specific order, determined by the ORDER BY clause within the function. Ranking functions are a mainstay of SQL, used extensively in data analysis for diverse tasks, such as finding the top salesperson, identifying the best-performing web page, or determining the highest grossing film for a particular year.

There are three principal ranking functions in SQL, namely RANK(), ROW_NUMBER(), and DENSE_RANK(). Each of these functions operates slightly differently, but they all serve the common purpose of ranking data based on specified conditions. RANK() and DENSE_RANK() functions have similar behavior in that they assign the same rank to rows with identical values. The crucial difference lies in how they handle the subsequent rank. RANK() skips the next rank whereas DENSE_RANK() does not.

On the other hand, the ROW_NUMBER() function assigns a unique row number to each row disregarding whether the order by column values are identical. While RANK(), DENSE_RANK(), and ROW_NUMBER() might seem interchangeable at a glance, understanding their nuances is pivotal to effective data analysis in SQL. The choice between these functions can significantly impact your results and the insights derived from your data.

What is DENSE_RANK() in SQL?

DENSE_RANK() is a potent ranking function in SQL that assigns a unique rank value within a specified partition. In crux, DENSE_RANK() gives non-gap rankings for your data, meaning each unique value is given a distinct rank, and identical values receive the same rank. Unlike its counterpart RANK(), DENSE_RANK() does not skip any ranks if there is a tie between the values.

To break it down, let's visualize a scenario where you have a dataset of student scores, and three students have secured the same score, say, 85 marks. Using RANK(), all three students will receive a rank of 1, but the next best score will be ranked 4, skipping ranks 2 and 3. However, DENSE_RANK() handles this differently. It will assign a rank of 1 to all three students, and the next best score will receive a rank of 2, ensuring there is no gap in the ranking.

So, when should one use DENSE_RANK()? It's particularly handy in scenarios where you require continuous ranking without any gaps. Consider a use case where you need to award the top three performers. If you have ties in your data, using RANK() might lead you to miss out on awarding a deserving candidate. That's when DENSE_RANK() comes to the rescue, ensuring all top scorers get their due recognition, and the ranks are not skipped.

DENSE_RANK() vs RANK() vs ROW_NUMBER() in SQL

Understanding the differences between DENSE_RANK(), RANK(), and ROW_NUMBER() is essential for efficient data analysis in SQL. All three functions are powerful in their right, but their subtle differences can significantly impact the outcome of your data analysis.

Let's start with RANK(). This function assigns a unique rank to each distinct value within a data set, with the same rank assigned to identical values. However, when RANK() encounters a tie (identical values), it skips the next rank(s) in the sequence. For instance, if you have three products with the same sales figures, RANK() will assign the same rank to each of these products but will then skip the next rank. This means that if these three products are the best-selling products, they will all be assigned rank 1, but the next best-selling product will be assigned rank 4, not rank 2.

Next, let's consider DENSE_RANK(). Similar to RANK(), DENSE_RANK() assigns the same rank to identical values, but it does not skip any ranks. Using the previous example, with DENSE_RANK(), the three best-selling products would still be assigned rank 1, but the next best-selling product would be assigned rank 2, not rank 4.

Finally, ROW_NUMBER() takes a different approach. It assigns a unique rank to every row, regardless of whether the values are identical. This means even if three products have the same sales figures, ROW_NUMBER() will assign a unique number to each, making it perfect for situations where you need to assign a distinct identifier to each row.

Unraveling the Syntax and Usage of SQL's DENSE_RANK()

The syntax of DENSE_RANK() is straightforward. It's used in conjunction with the OVER() clause, partitioning the data before assigning ranks. The syntax is as follows: DENSE_RANK() OVER (ORDER BY column). Here, column refers to the column by which you want to rank your data. Let's consider an example where we have a table named Sales with columns SalesPerson and SalesFigures. To rank the salespeople by their sales figures, we would use the DENSE_RANK() function as follows: DENSE_RANK() OVER (ORDER BY SalesFigures DESC). This SQL query will rank the salespeople from highest to lowest based on their sales figures.

Using DENSE_RANK() in conjunction with PARTITION BY can be particularly insightful. For instance, if you want to rank salespeople within each region, you can partition your data by Region and then rank within each partition. The syntax for this would be DENSE_RANK() OVER (PARTITION BY Region ORDER BY SalesFigures DESC). This way, you are not just getting a comprehensive ranking but also a nuanced understanding of performance within each region.

Practical Examples of SQL DENSE_RANK() Function

Apple SQL Question: Find the Top Sales Performers for Each Sales Date

Table: sales_data

+------------+-----------+------------+  |employee_id | sales_date| total_sales|  +------------+-----------+------------+  |101         |2024-01-01 |500         |  |102         |2024-01-01 |700         |  |103         |2024-01-01 |600         |  |101         |2024-01-02 |800         |  |102         |2024-01-02 |750         |  |103         |2024-01-02 |900         |  |101         |2024-01-03 |600         |  |102         |2024-01-03 |850         |  |103         |2024-01-03 |700         |  +------------+-----------+------------+

Output

+------------+-----------+------------+  |employee_id | sales_date| total_sales|  +------------+-----------+------------+  |101         |2024-01-01 |800         |  |103         |2024-01-02 |900         |  |102         |2024-01-03 |850         |  +------------+-----------+------------+

Apple Top Sales Performer Solution

Step 1: Understand the Data

First, let's understand the data in the sales_data table. It has three columns: employee_id, sales_date, and total_sales. This table represents sales data with information about the employee, the date of the sale, and the total sales amount.

Step 2: Analyze the DENSE_RANK() Function

The query uses the DENSE_RANK() window function to rank employees based on their total sales within each sales date partition. DENSE_RANK() is used to assign a rank to each row within the partition of sales_date, with the ordering based on total_sales in descending order.

Step 3: Break Down the Query Structure

Now, let's break down the structure of the query:

SELECT     employee_id,     sales_date,     total_sales   FROM     (      SELECT         employee_id,         sales_date,         total_sales,         DENSE_RANK() OVER (          PARTITION BY sales_date           ORDER BY             total_sales DESC        ) AS sales_rank       FROM         sales_data    ) ranked_sales   WHERE     sales_rank = 1;
  • SELECT Clause: This specifies the columns that will be included in the final result. In this case, it's employee_id, sales_date, and total_sales.
  • FROM Clause: This is where the actual data comes from. It includes a subquery (enclosed in parentheses) that selects columns from the sales_data table and adds a calculated column using DENSE_RANK().
  • DENSE_RANK() Function: This function is used within the subquery to assign a rank to each row based on the total_sales column, and it is partitioned by sales_date. This means that the ranking is done separately for each sales date.
  • WHERE Clause: This filters the results to include only rows where the sales_rank is equal to 1. This ensures that only the top sales performer for each sales date is included in the final result.

Step 4: Execute the Query

When you execute this query, it will produce a result set that includes the employee_id, sales_date, and total_sales for the top sales performer on each sales date.

Step 5: Review the Output

The final output table, named top_performers, will contain the desired information: the top sales performer for each sales date, based on the DENSE_RANK() calculation

Google SQL Question: Find, for Each Product, the Customer Who Provided the Highest Review Score

Table: product_reviews

+------------+-----------+-------------+-------------------------------+  |customer_id | product_id| review_date | review_score | helpful_votes  |  +------------+-----------+-------------+--------------+----------------+  |301         |101        |2024-04-01   |4.5           | 12             |  |302         |102        |2024-04-01   |3.8           | 8              |  |303         |103        |2024-04-01   |4.2           | 10             |  |301         |101        |2024-04-02   |4.8           | 15             |  |302         |102        |2024-04-02   |3.5           | 7              |  |303         |103        |2024-04-02   |4.0           | 11             |  |301         |101        |2024-04-03   |4.2           | 13             |  |302         |102        |2024-04-03   |4.0           | 10             |  |303         |103        |2024-04-03   |4.5           | 14             |  +------------+-----------+-------------+--------------+----------------+

Output

+------------+-----------+-------------+--------------+----------------+  |customer_id | product_id| review_date | review_score | helpful_votes  |  +------------+-----------+-------------+--------------+----------------+  |301         |101        |2024-04-01   |4.5           | 12             |  |301         |101        |2024-04-02   |4.8           | 15             |  |303         |103        |2024-04-03   |4.5           | 14             |  +------------+-----------+-------------+--------------+----------------+

Google Highest Review Score Solution

Step 1: Understand the Data

The product_reviews table contains information about customer reviews for various products. It includes columns such as customer_id, product_id, review_date, review_score, and helpful_votes. This table represents data related to customer reviews, with details about the customer, the product being reviewed, the date of the review, the review score, and the number of helpful votes received.

Step 2: Analyze the DENSE_RANK() Function

In this query, the DENSE_RANK() window function is utilized to rank rows within each partition defined by product_id and review_date. The ranking is determined based on two criteria: review_score in descending order and helpful_votes in descending order. This means that rows with higher review scores and a greater number of helpful votes will be assigned lower ranks.

Step 3: Break Down the Query Structure

Now, let's break down the structure of the query:

SELECT     customer_id,     product_id,     review_date,     review_score,     helpful_votes   FROM     (      SELECT         customer_id,         product_id,         review_date,         review_score,         helpful_votes,         DENSE_RANK() OVER (          PARTITION BY product_id,           review_date           ORDER BY             review_score DESC,             helpful_votes DESC        ) AS rank_within_product       FROM         product_reviews    ) ranked_reviews   WHERE     rank_within_product = 1;
  • SELECT Clause: Specifies the columns that will be included in the final result. It includes customer_id, product_id, review_date, review_score, and helpful_votes.
  • FROM Clause: This part includes a subquery (enclosed in parentheses) that selects columns from the product_reviews table and adds a calculated column using DENSE_RANK(). The calculation is performed over a partition defined by product_id and review_date, and the ranking is based on both review_score and helpful_votes in descending order.
  • DENSE_RANK() Function: This function is applied within the subquery to assign a rank to each row based on the specified criteria. The ranking is done separately for each combination of product_id and review_date.
  • WHERE Clause: Filters the results to include only rows where the rank_within_product is equal to 1. This ensures that only the top-ranked row for each product on each review date is included in the final result.

Step 4: Execute the Query

Executing this query will produce a result set containing the desired information: customer_id, product_id, review_date, review_score, and helpful_votes for the top-ranked review based on both review score and helpful votes within each product and review date combination.

Step 5: Review the Output

The final output table, named top_reviewers, will display the top-ranked reviews for each product on each review date, considering both the review score and the number of helpful votes.

Avoiding Common Mistakes with DENSE_RANK() in SQL

While DENSE_RANK() is a highly useful function in SQL, it’s not uncommon for analysts, especially those new to SQL, to make mistakes when using it. Let’s take a closer look at some of these common errors and how to avoid them.

One common mistake is misunderstanding how DENSE_RANK() handles null values. Unlike some SQL functions, DENSE_RANK() treats all NULLs as identical. This means that if you are ranking data where some values are NULL, DENSE_RANK() will assign the same rank to all NULL values. Be mindful of this when working with datasets that contain NULL values, and consider replacing NULLs with a value that represents their meaning in your context, or excluding them depending on your specific requirements.

Another frequent error is overlooking the importance of partitioning when using DENSE_RANK(). The `PARTITION BY` clause allows you to divide your data into distinct segments and perform the ranking within these partitions. Neglecting to use `PARTITION BY` can lead to erroneous results, particularly when you want ranks to restart for different categories or groups.

Related to this is the improper use of the ORDER BY clause with DENSE_RANK(). DENSE_RANK() assigns ranks in ascending order by default, meaning the smallest value gets the rank of 1. If you need the ranking to be in descending order, you must include the `DESC` keyword in your ORDER BY clause. Failure to do so will produce rankings that might not align with your expectations.

Lastly, some analysts mistakenly use DENSE_RANK() where ROW_NUMBER() or RANK() might be more appropriate, and vice versa. As we have discussed, all three of these functions have unique behaviors. Understanding these nuances and selecting the correct function for your specific use-case is critical to conducting accurate and effective data analysis.

How Mastering DENSE_RANK() Enhances Efficient Data Analysis in SQL

Mastering the use of DENSE_RANK() can significantly enhance the efficiency of data analysis in SQL, particularly where rankings and comparisons are involved. This function offers a nuanced approach to ranking, one that maintains a continuity in the ranking scale by assigning the same rank to identical values without skipping any rank numbers.

This is particularly helpful in analyzing large datasets, where data points can often share identical values. For instance, in a sales dataset, multiple salespeople may have achieved the same sales figures. DENSE_RANK() enables a fair ranking, where each of these salespeople are assigned the same rank. Additionally, the use of DENSE_RANK() in conjunction with `PARTITION BY` allows for focused, category-specific analysis.

This function's application becomes even more potent when dealing with null values. Instead of excluding these from the ranking process, DENSE_RANK() treats all nulls as identical and assigns them the same ranking. This ensures that even though the exact values might be missing, the data points are not ignored, thereby providing a more comprehensive analysis.

Frequently Asked Questions

Where can I practice SQL interview questions, including DENSE_RANK()?

To enhance your SQL skills, we recommend practicing online on platforms such as BigTechInterviews, Leetcode, or similar sites.

What does DENSE_RANK() do in SQL?

DENSE_RANK() is a SQL window function that assigns ranks to rows of data based on a specified column. It handles ties by giving them the same rank without leaving any gaps in the ranking sequence.

What is the difference between RANK(), ROW_NUMBER(), and DENSE_RANK() in SQL?

RANK() and ROW_NUMBER() assign ranks to data, but they handle ties differently. RANK() leaves gaps in ranking for tied data, while ROW_NUMBER() assigns a unique number to each row without considering ties. On the other hand, DENSE_RANK() assigns identical ranks to tied data points without any gaps.

How to use DENSE_RANK() in the WHERE clause in SQL?

DENSE_RANK() is a window function and cannot be directly used in the WHERE clause. Instead, it can be used in combination with other functions like ROW_NUMBER() or RANK(), which can then be used in the WHERE clause to filter data based on rank.

Can DENSE_RANK() be used without PARTITION BY?

No, specifying PARTITION BY is crucial for the proper functioning of DENSE_RANK(). Without it, all data would be treated as one group, leading to inaccurate and meaningless ranking. Mastering the use of DENSE_RANK() in SQL can significantly enhance your data analysis skills.

What is the difference between RANK() and DENSE_RANK()?

The main distinction between RANK() and DENSE_RANK() lies in how they handle ties. While RANK() leaves gaps in ranking for tied data, DENSE_RANK() assigns identical ranks to tied data points without any gaps. Additionally, RANK() always increments the rank number by 1 for each new row, whereas DENSE_RANK() maintains a continuous ranking.

John Hughes was a previous Data Analyst at Uber turned founder of SQL learning platform called BigTechInterviews (BTI). He is passionate about learning new programming languages and helping candidates gain the confidence and skills to pass their technical interviews. He calls Denver, CO home.

More On This Topic

  • Breaking Down AutoGPT
  • Breaking Down Quantum Computing: Implications for Data Science and AI
  • A Step by Step Guide to Reading and Understanding SQL Queries
  • A Guide On How To Become A Data Scientist (Step By Step Approach)
  • How To Structure a Data Science Project: A Step-by-Step Guide
  • A Step-by-Step Guide to Web Scraping with Python and Beautiful Soup

5 FREE Courses on AI and ChatGPT to Take You From 0-100

5 FREE Courses on AI and ChatGPT to Take You From 0-100
Image by DALLE 3

What a time to be alive. And what better time to learn about the elements of AI such as Generative AI, particularly ChatGPT than now! Many people are interested in the sector, but some need more knowledge on how to get there.

This blog provides you with a list of FREE courses from trusted institutions such as Harvard, IBM, DeepLearning.AI, and more.

Let’s get into it.

Introduction to AI with Python (Harvard)

Link: Harvard — Introduction to AI with Python

This is a 7-week course, at self-paced learning to learn about using machine learning in Python for artificial intelligence. In this course, you will learn about the different concepts and algorithms of modern artificial intelligence. You will dive into real use cases such as handwriting recognition, and machine translation.

Not only will you learn about it, but you will also have the opportunity to get hands-on with projects, which will allow you to apply the theory-based knowledge and how it applies to different aspects of machine learning and AI and incorporate them into your own Python program.

By the end of the course, you will have immense knowledge of libraries used in machine learning and the principles of artificial intelligence, so that you can build your own intelligent system.

AI for Everyone: Master the Basics (IBM)

Link: IBM — AI for Everyone: Master the Basics

AI is everywhere, and everybody is talking about it. And if you don’t know a lot about it — this course is for you. In this course, you will master the basics of Artificial Intelligence, as well as understand its applications and key concepts such as machine learning, deep learning and neural networks.

You will also dive into ethical concerns surrounding AI, which is a very popular topic at the moment. With the knowledge you receive from this course, you will also receive expert advice about starting a new career in AI.

Data and AI Fundamentals (Linux)

Link: Linux Foundation — Data and AI Fundamentals

Linux is an operating system, and with this course that they provide, you will learn about the fundamentals of Artificial Intelligence as well as an overview of the Linux Foundation AI & Data projects ecosystem. This is a 10-week course, self-paced learning which is suited for anybody who has an interest in AI, regardless of the professional background and level of technical knowledge.

The course will offer you an entrance into the Linux Foundation AI & Data ecosystem, which is relevant for open-source tools to continue developing new data and AI skills. As mentioned prior, this course is beneficial to anyone who comes from a variety of industries such as finance, manufacturing, and more.

With this course, you will be able to see the different career options that are available in the family of AI technologies.

Fine Tuning Large Language Models (DeepLearning.AI)

Link: DeepLearning — Fine Tuning Large Language Models

Some of you may already have good knowledge based on AI and Large Language Models (LLMs) and may be looking into perfecting your skills or learning something new. This course with DeepLearning.AI will go through the fundamentals of fine tuning an LLM, in a quick 1-hour course.

You will learn about how finetuning differs from prompt engineering, and when to use both, as well as get practical experience using real data sets, and how you can apply these tools and techniques to your own projects.

If you are familiar with the Python language and have a good understanding of deep learning frameworks such as PyTorch and the applications of fine-tuning, this course is for you.

Artificial Intelligence Projects

Link: Artificial Intelligence Projects

When it comes to the tech world, there are a lot of great resources out there for you to learn and develop new skills. However, the important thing to remember is that you have to apply these skills in real-life scenarios — in the form of projects.

This course has been designed to help learners implement the solution and models of Artificial Intelligence to the problems. You will learn about Artificial Neural Networks (ANNs), Time Series Forecasting, Chatbots, and more.

Wrapping it up

This blog is aimed at newcomers to the AI world, however, it is not limited to newbies only. If you want to refine your current skills or adapt to your current ones — these FREE courses can give you that kickstart without having to spend a penny!

Nisha Arya is a Data Scientist and Freelance Technical Writer. She is particularly interested in providing Data Science career advice or tutorials and theory based knowledge around Data Science. She also wishes to explore the different ways Artificial Intelligence is/can benefit the longevity of human life. A keen learner, seeking to broaden her tech knowledge and writing skills, whilst helping guide others.

More On This Topic

  • Read This Before You Take Any Free Data Science Course
  • How Many AI Neurons Does It Take to Simulate a Brain Neuron?
  • Federated Learning: Google’s Take
  • How Long Does It Take to Learn Data Science Fundamentals?
  • 5 Free Courses on ChatGPT
  • KDnuggets News, May 4: 9 Free Harvard Courses to Learn Data…

Colossyan uses GenAI to create corporate training videos

Colossyan uses GenAI to create corporate training videos Kyle Wiggers 16 hours

Most people don’t watch corporate training videos — or, in cases where the training’s mandatory, don’t give them their full attention. According to a recent poll from Kaltura, the video tech provider, 75% of staffers admit to skimming through training videos, watching them without sound or listening to them while multitasking.

So, given that training videos aren’t cheap to produce, is there a way to make them more engaging and thus less of a money sink? Dominik Mate Kovacs, the co-founder and CEO of Colossyan, thinks there is — and it involves GenAI.

Colossyan taps AI to generate workplace learning videos, remixing, re-animating and editing footage of one of several virtual avatars against changeable backdrops. Users can enter a script to have it “read” aloud by Colossyan’s text-to-speech (TTS) engine, which also translates the script into over 70 languages.

Colossyan

Image Credits: Colossyan

“To generate a video with Colossyan’s AI video platform, all you have to do is input a script and select from a diverse range of avatars,” Kovacs told TechCrunch in an email interview. “Any company can create a video about almost anything efficiently, without the need for conventional filming resources.”

Kovacs founded Colossyan in 2020 after leaving Defudger, a deepfakes detection platform, which he helped to co-launch. An engineer and data scientist by training, Kovacs says that he was inspired to start Colossyan by the budding corporate interest in GenAI.

“Enterprises are leveraging AI in diverse areas such as IT automation, customer care and digital labor — highlighting the broad applicability and potential impact of AI technologies in streamlining operations and enhancing service delivery,” Kovacs said. “The barriers to AI adoption, such as limited AI skills and data complexity, are significant yet surmountable challenges that many organizations are actively working to overcome. ”

For the heck of it, I gave Colossyan’s platform, which offers a free trial, a go to see if I could make a training video that’d successfully hold the attention of my ADHD brain — admittedly a high bar. The avatars were a bit too stiff and cartoonish for my liking and the TTS engine too robotic, at least compared to some of the more sophisticated GenAI tools out there (e.g. ElevenLabs). But I’ve certainly seen worse corporate videos.

Colossyan also doesn’t generate videos as quickly as I’d expect — a 38-second clip takes ~11 minutes. Granted, that’s a lot faster than creating trainings from scratch. But frankly, faced with the prospect of generating more than a handful of videos for whatever purpose, I’d be tempted to go the PowerPoint or Canva route instead.

I’m not Colossyan’s target market, of course. And it seems that several household brands are happy to pay for a subscription to Colossyan as it exists today, including Novartis, Porsche, Vodafone, HPE and Paramount, claims Kovacs.

Kovacs attributes the customer traction to features like integrations with learning management systems and a “conversation mode’ that allows two avatars to hold a dialogue with each other. He doesn’t deny that there’s a fair amount of competition in the GenAI video space — see CommonGround, Synthesia and Surge plus solutions from tech giants like Microsoft — but he thinks that Colossyan’s focus on “interactivity and engagement,” as he puts it, will continue to set the platform apart.

Perhaps he’s right. Colossyan today announced that it raised $22 million in a funding round led by Lakestar with participation from Launchub, Day One Capital and Emerge Education. The proceeds will be put toward tripling Colossyan’s headcount across its New York, London and Budapest offices, Kovacs says, and developing new capabilities like branching videos and knowledge checks.

“For C-suite and IT department leaders, our platform represents a scalable, cost-efficient solution to training and development challenges,” he added.

AI Brings 2000 Year Old Script Back to Life

The Vesuvius Challenge, initiated ten months ago to tackle the enigma of the Herculaneum Papyri, has achieved a historic breakthrough, as announced by Nat Friedman. The project successfully decoded a portion of the ancient scrolls that were preserved in the aftermath of Mount Vesuvius’ eruption in 79 AD.

Ten months ago, we launched the Vesuvius Challenge to solve the ancient problem of the Herculaneum Papyri, a library of scrolls that were flash-fried by the eruption of Mount Vesuvius in 79 AD.
Today we are overjoyed to announce that our crazy project has succeeded. After 2000… pic.twitter.com/fihs9ADb48

— Nat Friedman (@natfriedman) February 5, 2024

The winning team, composed of Youssef Nader, Luke Farrito, and Julian Schilliger, secured the Vesuvius Challenge Grand Prize of $700,000. Youssef is an Egyptian PhD student in Berlin who successfully read a few columns of text back in October, earning him the second-place First Letters Prize.

Luke is a 21-year-old college student and SpaceX intern from Nebraska. Julian is a Swiss robotics student at ETH Zürich, who won three Segmentation Tooling prizes for his incredible work on the Volume Cartographer.

The deciphered text, originating from the first scroll, sheds light on the musings of the probable author, Philodemus, an Epicurean philosopher. Philodemus discusses various subjects, including music, food, and the pursuit of life’s pleasures. Notably, the text concludes with subtle criticism directed at unnamed ideological adversaries, believed to be the stoics, who are accused of having little to say about pleasure.

The winning solution utilised a final canonical model based on the timesformer small architecture featuring a divided space-time attention mechanism. This innovative approach allowed for a comprehensive understanding of the ancient text, marking a significant breakthrough in the quest to unveil the mysteries of the past.

The dataset underwent meticulous expansion and cleaning, involving approximately 15 rounds of refinement to enhance the accuracy of the labels. It also consisted of 2 other architectures, Resnet3D-101 with pretrained weights, I3D with non-local block and maxpooling.

The Vesuvius Challenge is set to continue in 2024. The objective now is to progress from decoding isolated passages to reading entire scrolls. To spur further advancements, a new $100,000 grand prize has been introduced for the first team capable of reading at least 90% of all four scanned scrolls.

The post AI Brings 2000 Year Old Script Back to Life appeared first on Analytics India Magazine.

IIT Kanpur Develops India’s First Hypervelocity Expansion Tunnel Test Facility

Indian Institute of Technology (IIT) Kanpur has achieved a significant milestone by successfully developing and testing India’s inaugural Hypervelocity Expansion Tunnel Test Facility.

Named S2, this advanced facility positions India among a select group of nations with hypersonic testing capabilities. S2 can simulate flight speeds ranging from 3-10 km/s, replicating hypersonic conditions experienced during atmospheric entry of vehicles, asteroid entry, scramjet flights, and ballistic missiles.

“Nicknamed ‘Jigarthanda’, is a 24-meter-long facility indigenously designed and developed over a period of three years with funding and support from the Aeronautical Research and Development Board and the Department of Science and Technology, Government of India.

“It represents a tremendous achievement for IITK and a major capacity boost for India’s space and defence sectors. With sophisticated hypervelocity testing capabilities now available domestically, India is better positioned to develop advanced hypersonic technologies and systems,” IIT Kanpur said.

“Building S2 has been extremely challenging, requiring in-depth knowledge of physics and precision engineering. The most crucial and challenging aspect was perfecting the ‘free piston driver’ system, which requires firing a piston at high pressure between 20-35 atmospheres down a 6.5 m. compression tube at speeds of 150-200 m/s, and bringing it to a complete stop or ‘soft landing’ at the end,” Professor Mohammed Ibrahim Sugarno, Associate Professor, Department of Aerospace Engineering and Centre for Lasers & Photonics at IIT Kanpur said.

The post IIT Kanpur Develops India’s First Hypervelocity Expansion Tunnel Test Facility appeared first on Analytics India Magazine.

The Essential Guide to SQL’s Execution Order

The Essential Guide to SQL’s Execution Order
Image by Author

SQL has become a must-have language for any data professional.

Most of us use SQL in our daily work, and after writing many queries, we all get our own style and have our habits, both good and bad.

SQL is usually learned by use, and in most cases, people do not usually understand the logic behind it.

This is why, today, we're diving into the intriguing world of SQL’s execution order, where the sequence of events can sometimes feel like a puzzle.

So, let's fine-tune our understanding with a spotlight on the most common SQL query structure.

SQL as a declarative language

The first thing to understand is that SQL is a declarative programming language, which means that we specify the desired result but not what steps are required to achieve it.

This is quite the opposite of procedural languages, which define each step that needs to be performed to achieve our desired output.

But what does this mean?

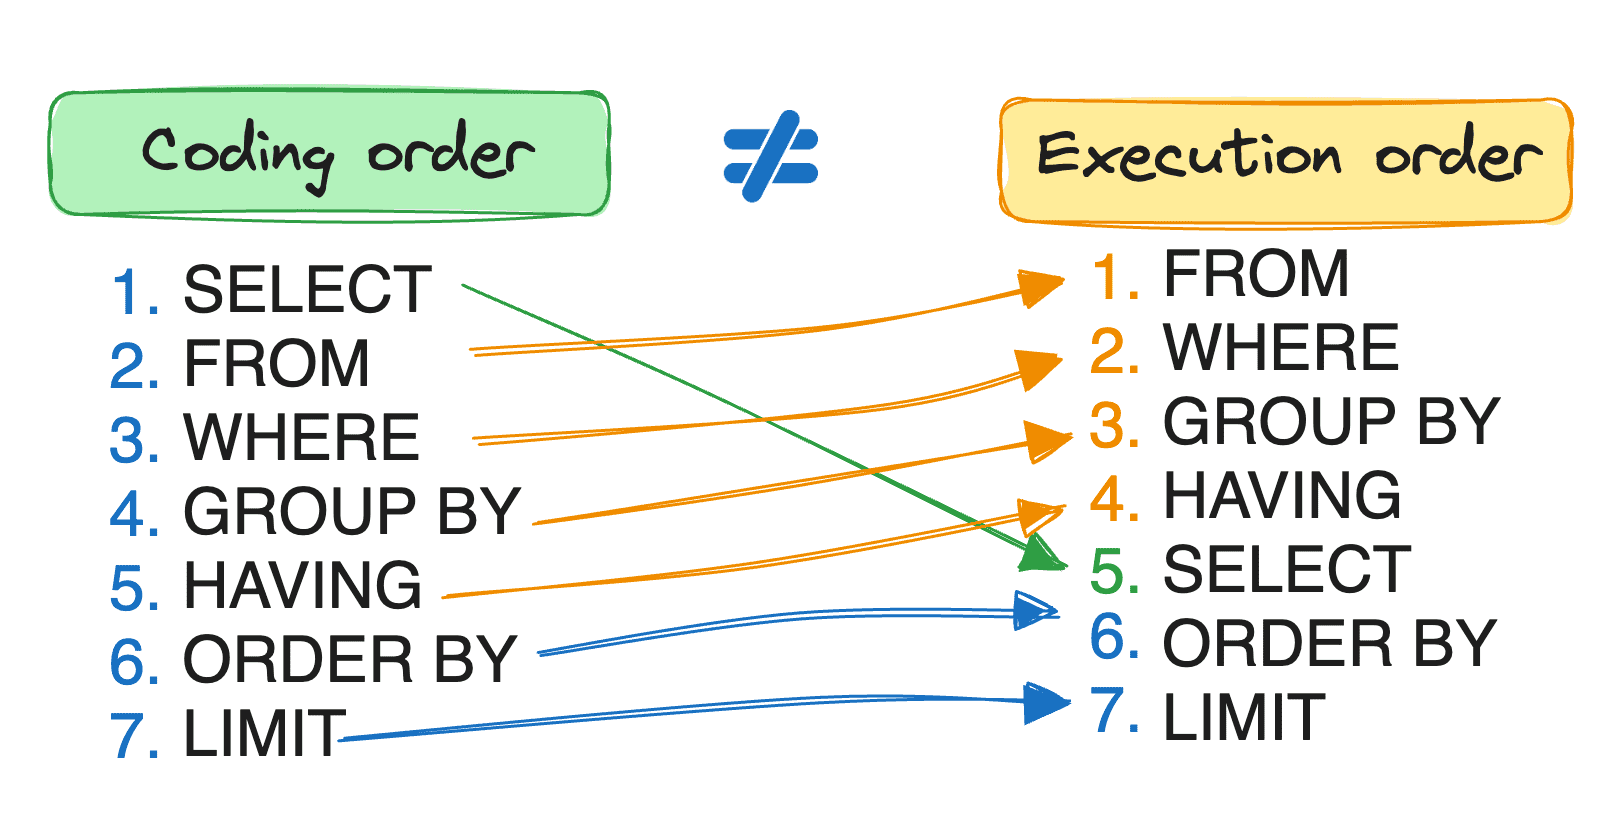
It means that SQL requires commands to be coded in a certain syntax. Yet the order in which we write these commands doesn't mirror the order in which SQL processes them.

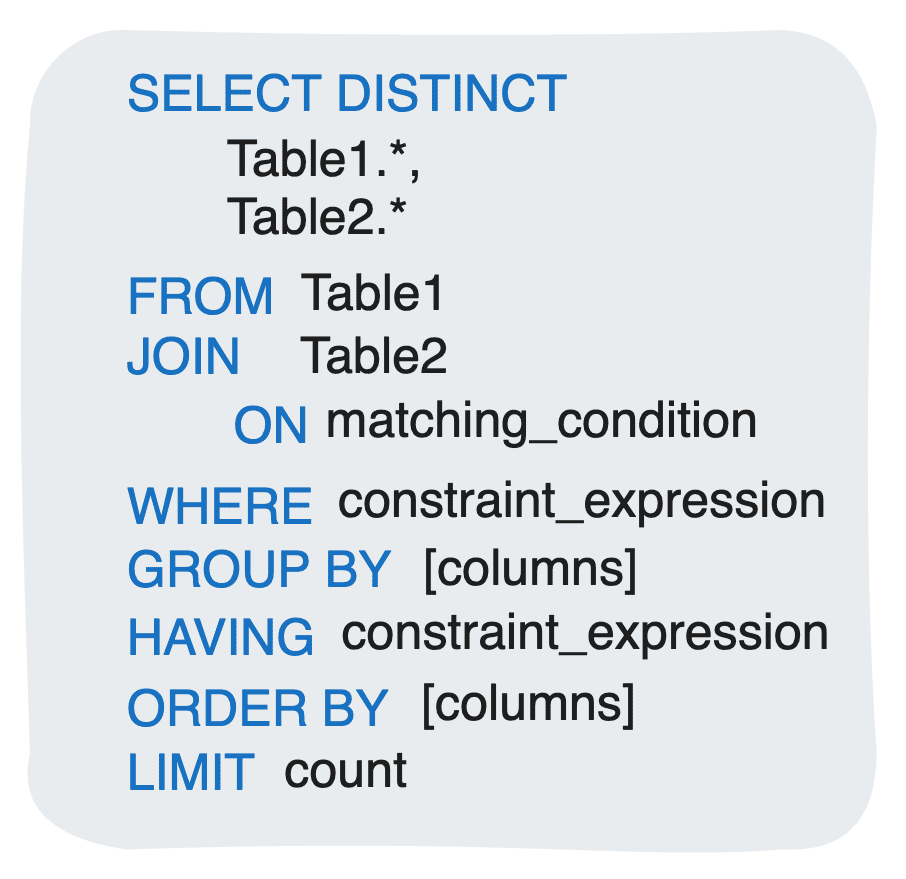
Typically, a query unfolds with a structure like this:

The Essential Guide to SQL’s Execution Order
Image by Author

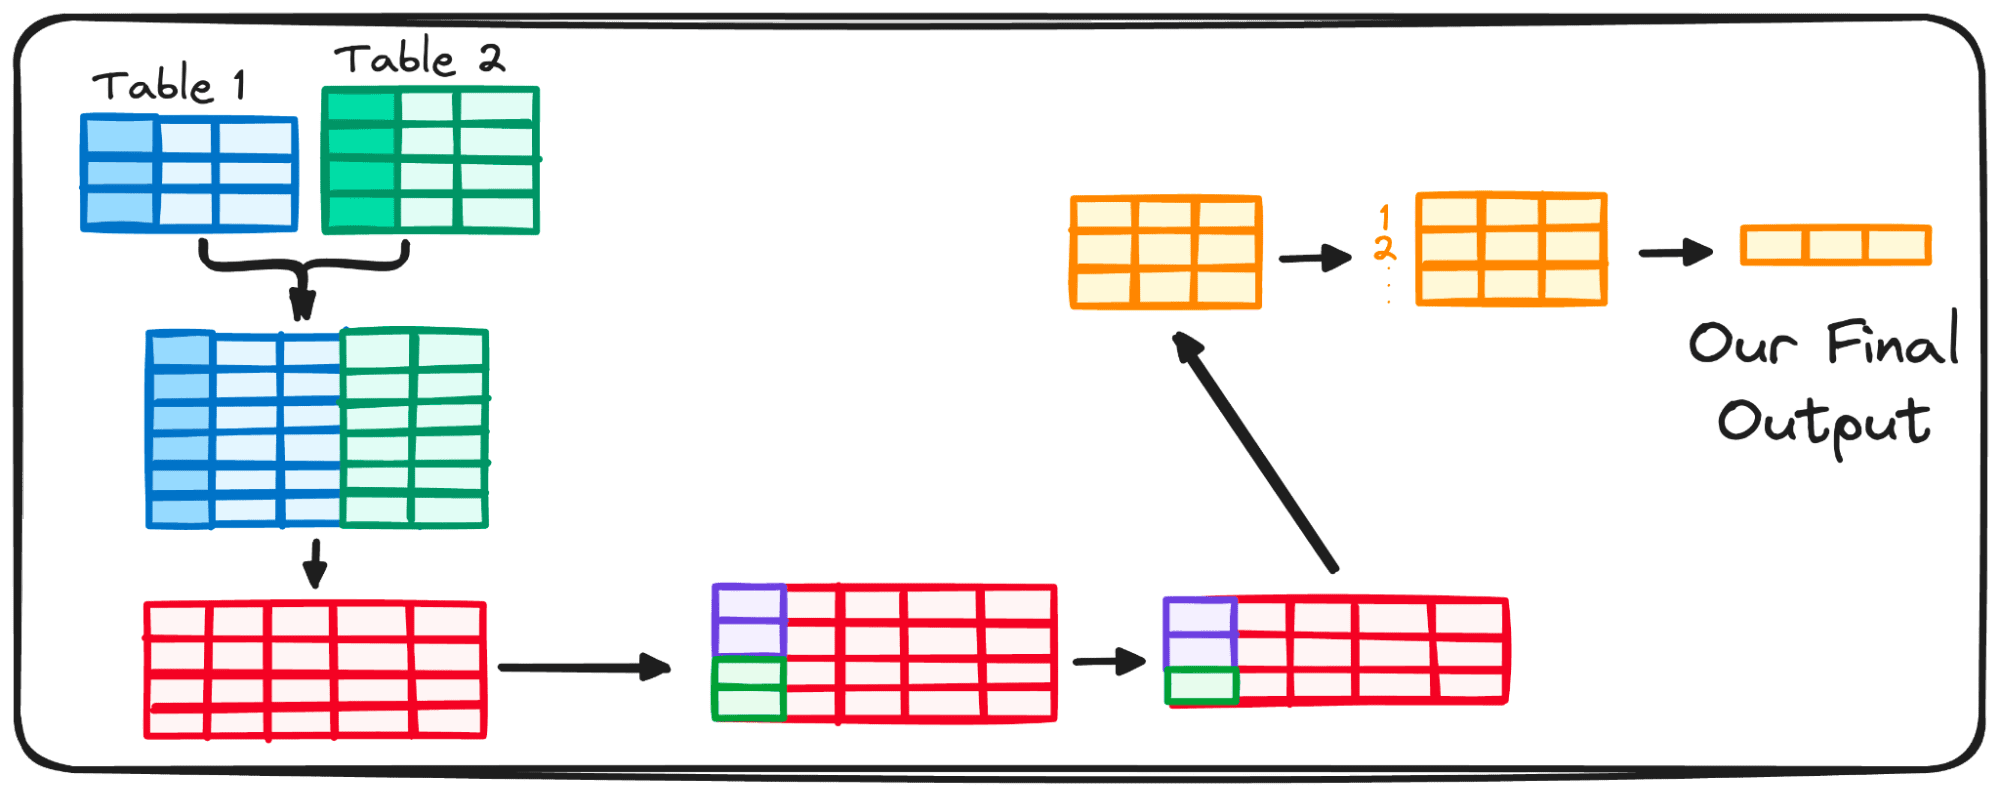
Even though a person would read and code, following the previous structure, when considering how this code is executed, the order changes completely.

The Essential Guide to SQL’s Execution Order
Image by Author

For instance, though written as the first command, the SELECT clause isn’t evaluated until almost the end.

Visual representation of the execution order

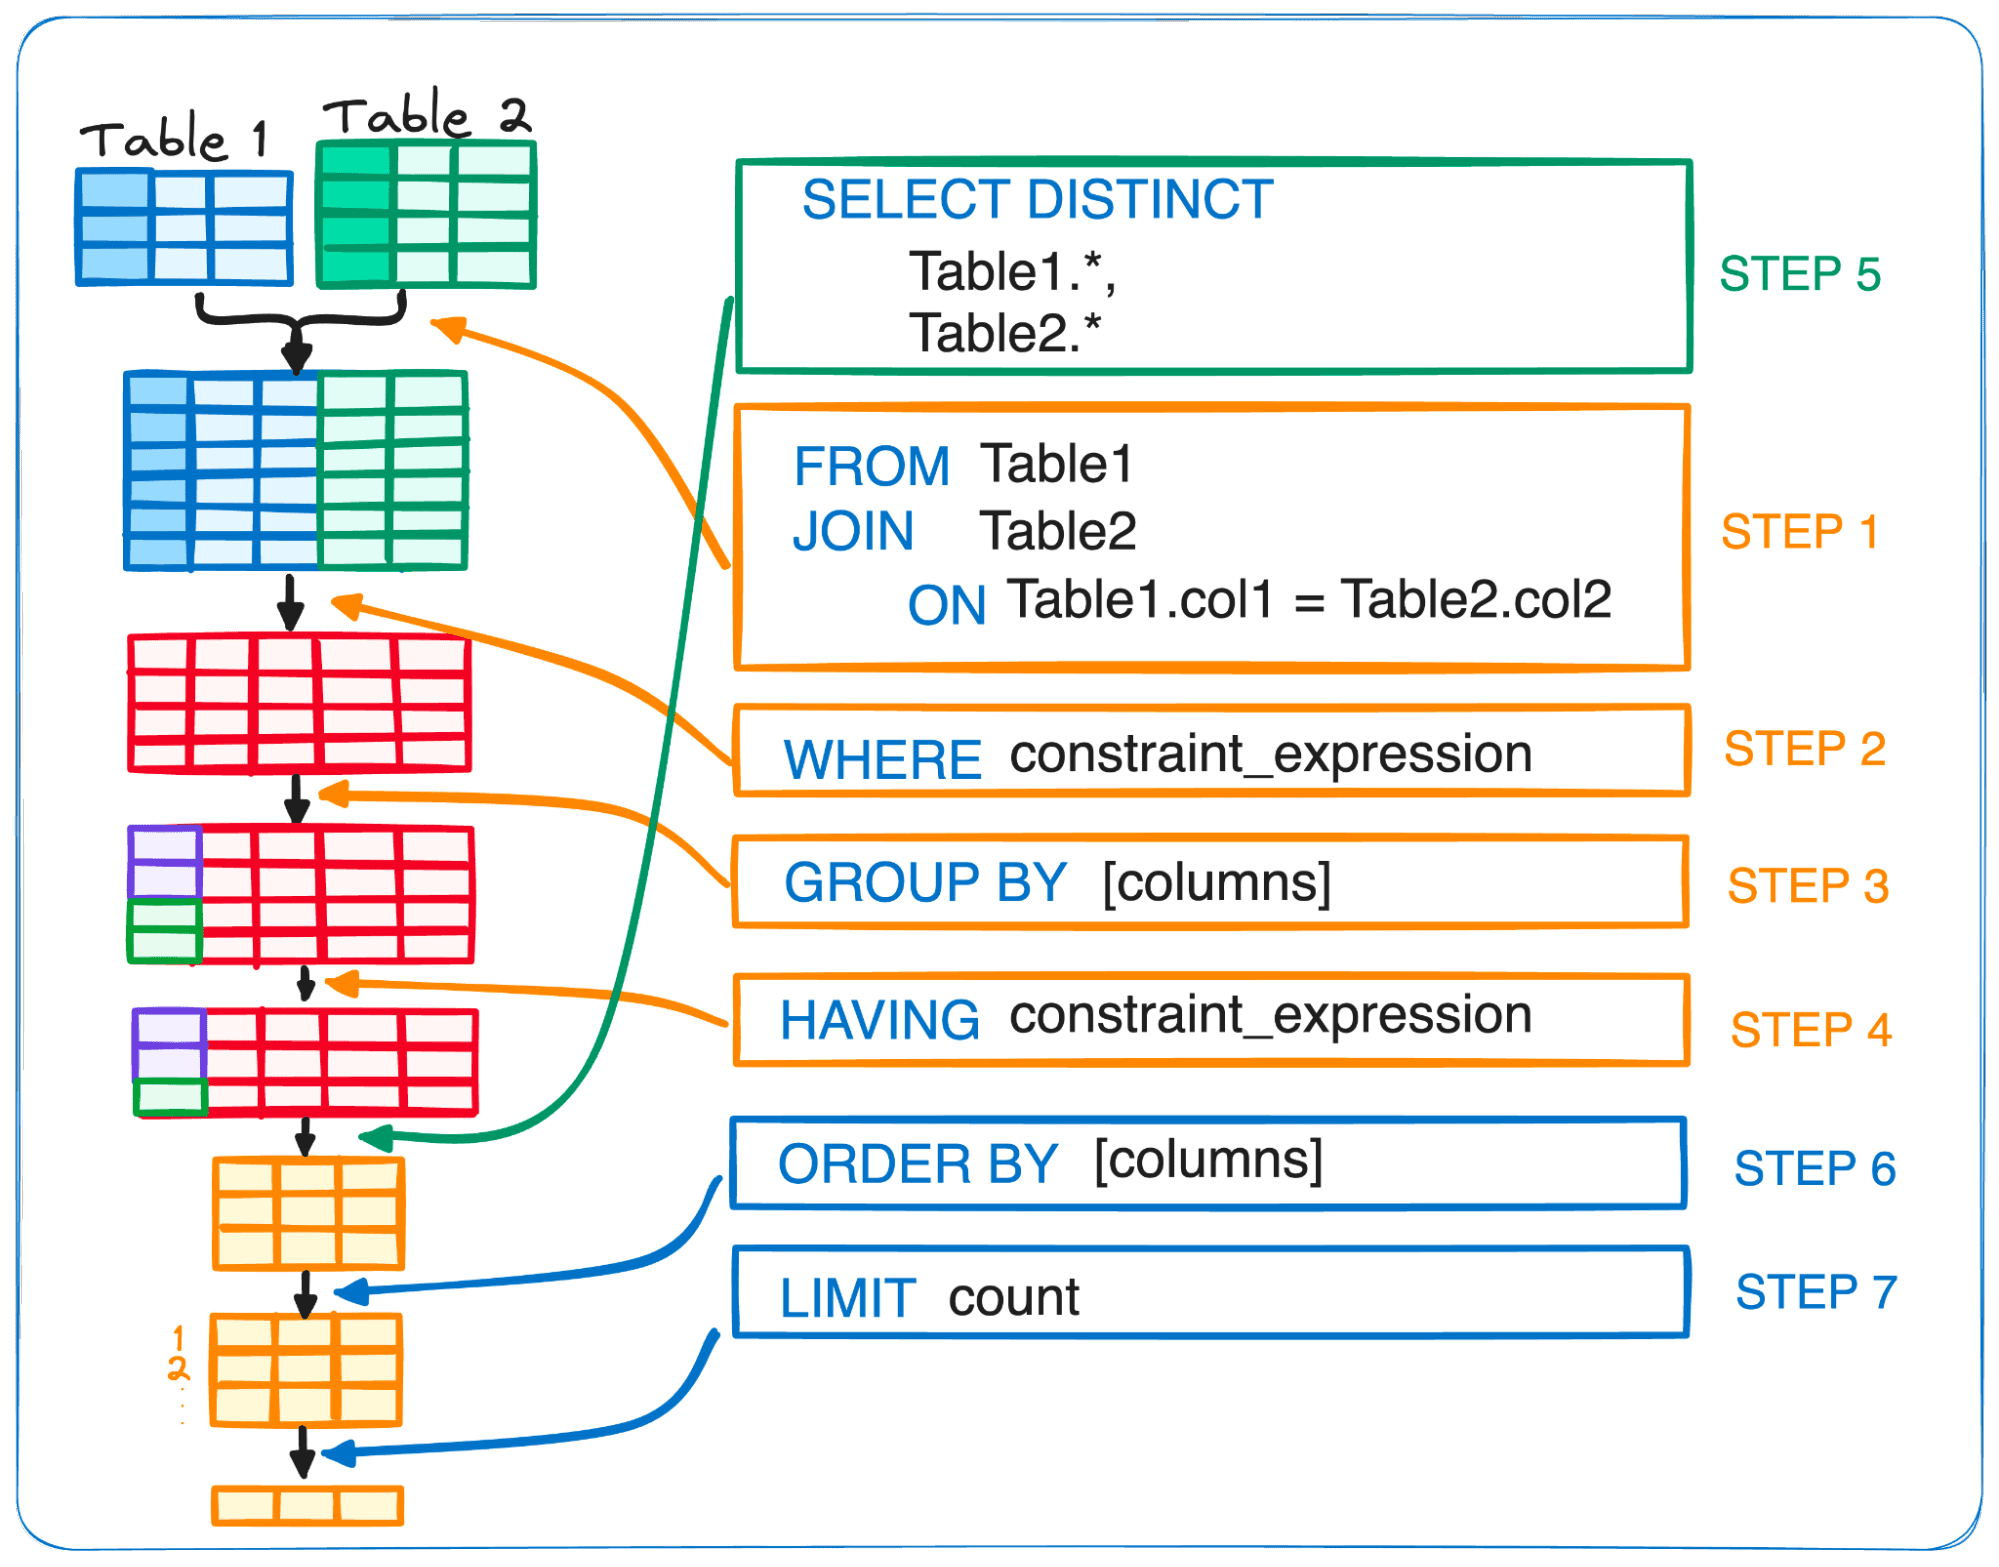
To further understand this execution order, let’s go step by step and see what SQL does with every command we code.

The Essential Guide to SQL’s Execution Order
Image by Author

Step 1 — FROM and JOIN

The journey of a SQL query begins with the FROM clause, which points to the data's origin. While straightforward queries might tap into just one table, the data we seek frequently is contained across several tables.

That's where the JOIN command steps in, hand in hand with FROM, to merge together the data strands.

This pairing always takes the lead, setting the stage by pinpointing the data that will play a role in our query.

Step 2 — WHERE

Following the initial selection, the WHERE clause takes center stage.

Its primary role is to sift through the foundational table or the merged output from the join, ensuring only the rows that satisfy a specific condition are kept.

Step 3 — GROUP BY

The GROUP BY clause steps in to orchestrate the data, arranging it into clusters according to the values in one or more columns. This enables us to perform aggregations or summaries.

Consider it the maestro of data, reducing the multitude of variables to a singular value for each unique element or combination of elements.

This clause is the core command behind data aggregation, setting the stage for summary performances with functions like COUNT(), SUM(), MIN() and MAX() among others.

Step 4 — HAVING

The HAVING clause comes into play as a discerning filter, eliminating those groupings that fail to meet the set criteria.

Imagine it as a gatekeeper, ensuring that only the groups that align with our aggregate conditions are allowed to proceed. It steps in after the GROUP BY clause has done its part, allowing us to apply filters on the now aggregated data.

At this juncture, the database is already aware of the computed aggregations, which means we can use these aggregated values in subsequent statements.

To address the common misconception of why the WHERE clause can’t call aggregated variables while HAVE can:

It's because WHERE takes the stage before the GROUP BY clause, at a time when individual data points haven't yet been compiled into groups. On the other hand, HAVING takes place when the GROUP BY has already been computed.

Step 5 — SELECT

The SELECT clause defines the columns we want to keep in our table, along with any grouped or aggregated fields — that have been computed during the execution process.

Here, we can apply column aliases using the AS operator.

The SELECT command is usually used together with the DISTINCT, which allows us to discard any row with duplicate values in all columns marked as DISTINCT.

Step 6 — ORDER BY

With the foundational tasks completed, the ORDER BY clause steps in, orchestrating the sorted presentation of values in either ascending (ASC) or descending (DESC) order.

Picture this as the final act in our query.

We've gathered the data from our source tables, refined it with filters, crafted meaningful groups and summaries, and pinpointed the columns to showcase in our final output.

Step 7 — LIMIT

Finally, the LIMIT clause helps define the number of rows we want back.

It is particularly useful when dealing with large tables, especially during the development and testing stages.

Why is this important?

Understanding the sequence of SQL's execution order might seem trivial at the outset, especially when queries are yielding the correct results.

Why fuss over the mechanics if the engine runs fine, right?

Yet, for those diving into the deeper waters of complex queries, knowledge of this order isn't just useful—it's crucial.

Without this insight, troubleshooting becomes a maze of confusion, with errors lurking like all around. For adept debugging and smoother query crafting, a solid grasp of how SQL processes its clauses is indispensable. Two common mistakes are:

Mistake 1

A typical pitfall in SQL is the attempt to filter aggregated data using the WHERE clause—a misstep that leads to an error.

The Essential Guide to SQL’s Execution Order
Image by Author

As we have already seen throughout this article, the WHERE clause is computed before the GROUP BY one, therefore, we cannot use aggregated values during the WHERE step.

Mistake 2

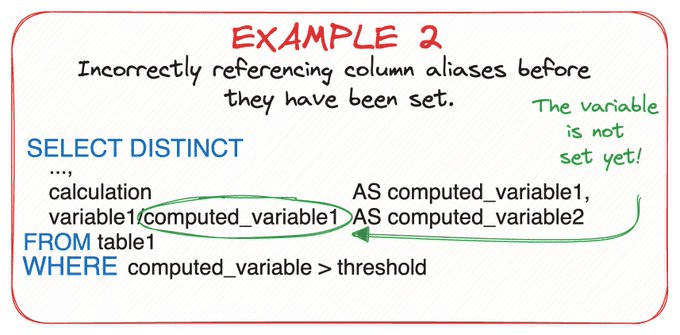
Referencing column aliases of aggregated values that have not been set yet. In this case, we cannot use an alias that has been defined in the very same SELECT, as the computation phase is the same.

Therefore, SQL is not aware of this new alias yet.

The Essential Guide to SQL’s Execution Order
Image by Author Final Conclusions

Understanding SQL's execution order is crucial for data professionals to craft effective, efficient queries.

This insight allows one to anticipate query behavior, especially in complex datasets.

Mastering SQL involves moving beyond syntax and embracing its logic for strategic data manipulation.

The journey we have performed together, from the FROM clause to LIMIT, is a strategic blueprint for data handling and shaping information to fit specific needs.

Hope next time you are coding SQL, you keep this execution order in mind!

Josep Ferrer is an analytics engineer from Barcelona. He graduated in physics engineering and is currently working in the Data Science field applied to human mobility. He is a part-time content creator focused on data science and technology. You can contact him on LinkedIn, Twitter or Medium.

More On This Topic

  • 3 Tools to Track and Visualize the Execution of Your Python Code
  • KDnuggets™ News 22:n01, Jan 5: 3 Tools to Track and Visualize…
  • 10 Essential SQL Commands for Data Science
  • The Essential Guide to Transformers, the Key to Modern SOTA AI
  • Essential Machine Learning Algorithms: A Beginner's Guide
  • A Data Scientist’s Essential Guide to Exploratory Data Analysis

15 big ideas that will revolutionize industries and economies, led by AI

ARK Invest logo on phone balanced on keyboard

More tech-led transformation is coming and artifical intelligence (AI) will be at the heart of that change, says a report by ARK Invest, which is an investment management firm that focuses on disruptive innovation in public equity markets.

"We're all about finding the next big thing. Those hewing to the benchmarks, which are backwards looking, are not about the future. They are about what has worked. We're all about what is going to work," says Cathie Wood, founder, CEO, and chief investment officer of ARK.

Also: 4 ways to help your organization overcome AI inertia

ARK publishes a Big Ideas report annually, which provides a comprehensive analysis of technological convergence and its potential to revolutionize industries and economies:

The ARK Big Ideas 2024 report is titled 'Disrupting the Norm, Defining the Future' and it highlights 15 big ideas, which are:

  1. Technological Convergence — The global equity market value associated with disruptive innovation could increase to 60% by 2030.
  2. Artificial Intelligence — Scaling global intelligence and redefining work: AI training costs should continue to fall 75% per year.
  3. Smart Contracts — Powering the internet-native financial system, smart contract networks could generate fees of $450bn in 2030.
  4. Digital Wallets — Digital wallets could grow select vertical software platforms' revenues to $27-$50bn in 2030.
  5. Robotics — Generalizing automation, thanks to the convergence of AI software and hardware. Generalizable robotics represent a $24 trillion-plus global revenue opportunity.
  6. Digital Consumers — Transitioning toward digital leisure, where spending could teach $23 trillion in 2030.
  7. Electric Vehicles — Lower battery costs powering adoption mean EV sales could reach 74 million in 2030.
  8. Robotaxis — Robotaxi platforms could create $28 trillion in enterprise value in 2030.
  9. Multiomic Tools & Technology — Translating biological insights into economic value: R&D spending could decline by more than 25%, thanks to multiomic tools and technology.
  10. Reusable Rockets — Satellite connectivity revenues could exceed $130bn per year in 2030.
  11. Autonomous Logistics — Global autonomous delivery revenue could reach $900bn by 2030.
  12. Bitcoin Allocation — Growing the role of bitcoin in investment portfolios. During the last seven years, bitcoin's annualized return has averaged around 44%.
  13. Bitcoin in 2023 — After challenges in 2022, bitcoin's price surged 155% last year, reaching $827 billion in market cap.
  14. Precision Therapies — Curing disease more efficiently and less expensively. The enterprise value of companies focused on precision therapies could reach $4.5 trillion by 2030.
  15. 3D Printing — Revenues could grow 40% at an annual rate to $180bn by 2030.

The 2024 Big Ideas report by ARK identifies five innovation platforms converging and defining the technological era: AI, public blockchains, energy storage, robotics, and multiomic sequencing. ARK also looks at the historic impact of converging technologies and estimated economic impacts.

The company identifies AI as the central technology catalyst. Let's take a deeper dive into the AI chapter of the 2024 BIg Ideas report.

AI: Redefining Work

The research suggests coding assistants are early success stories that have boosted the productivity and job satisfaction of software developers. AI-powered assistants are increasing the performance of knowledge workers and, interestingly, benefiting underperforming workers relatively more than high performers:

Foundational models are improving across domains. With larger training datasets and more parameters, GPT-4 outperforms GPT-3.5 significantly. Increasingly, foundation models are becoming "multimodal" — supporting text, images, audio, and video — and are not only more dynamic and user-friendly, but also more performant. The analysis says the cost of authoring the written word has collapsed:

AI-training performance is rapidly improving. What's more, training costs should continue to fall 75% per year. The research notes that after focusing initially on large language model (LLM) training-cost optimization, researchers are now prioritizing inference costs. Based on enterprise-scale use cases, inference costs seem to be falling at an annual rate of around 86%, which is even faster than the fall in training costs. Today, the inference costs associated with GPT-4 Turbo are lower than those for GPT-3 a year ago:

The open-source community is competing with private models. ARK states that the performance of open-source models is improving faster than closed-source models. LLM performance advances will require nuanced techniques, with the Stanford HELM framework highlighted as an example in the report.

Also: Why open-source generative AI models are still a step behind GPT-4

ARK also notes that computing power and high-quality training data appear to be the primary contributors to model performance. As models grow and require more training data, will a lack of fresh data cause model performance to plateau? Research institute Epoch AI estimates that high-quality language/data sources, such as books and scientific papers, could be exhausted by 2024, although a larger set of untapped vision data still exists:

The reserach suggests the acceleration of employee productivity using AI could have a multi-trillion dollar impact. AI has the potential to automate most tasks in knowledge-based professions by 2030, dramatically increasing the average worker's productivity. Software solutions that automate and accelerate knowledge work tasks should be prime beneficiaries:

The ARK Invest Big Idea 2024 report is the gold standard for detailing the disruptive technologies that will shape industries and economies for the next decade. The summary of the report's AI chapter includes potential possibilities for AI beyond 2030, and potential scenarios by 2040:

The report also includes other great content. The Digital Consumer and Digital Wallet chapters of the report are important for business leaders in any sector and any size. For example, the report suggests social commerce should grow 32% at an annual rate, from $730bn today to over $5 trillion in 2030.

Also: Five ways to use AI responsibly

The Big Ideas report is a comprehensive study of disruptive technologies, with more than 160 pages of analysis. To learn more about the research, you can visit here.

Artificial Intelligence