
Image by Author
The world of technology is advancing at an unprecedented pace, and companies are constantly striving to stay ahead of the game by either integrating generative AI or developing their own using open-source models and datasets. As a data scientist seeking employment in this era, it is crucial to acquire a diverse range of tools and skills to remain competitive in the job market.
In this blog, we will discuss what are the core topics you need to focus on to become an AI Data Scientist and get hired by your favorite company. We will focus on learning about statistics, core data science concepts, NLP, prompt engineering, data science portfolio, preparing for interviews, and AIOps. By mastering these core topics, you'll be well on your way to becoming a successful AI Data Scientist and securing your dream job at your favorite company.
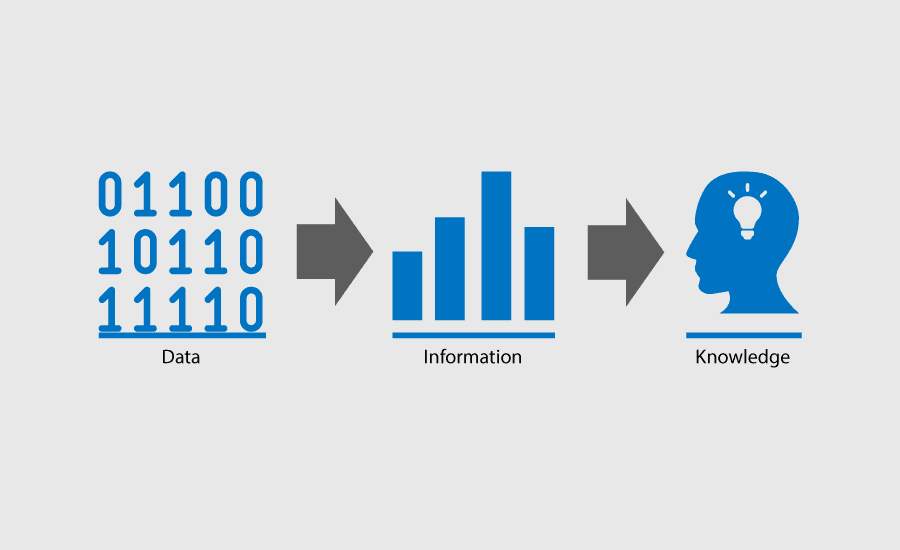
Statistics
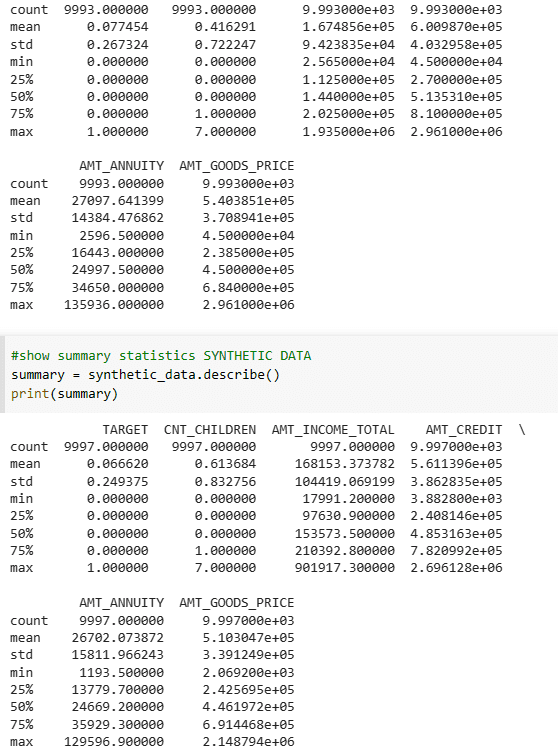
Even though you can ask GPT-4 to interpret the result, you need to understand statistical terminology to come up with a conclusion or even ask a question. After the interpretation of the results, you need to come up with a plan that is suitable for your company. GPT-4 is not good at coming up with the right answer when there are multiple moving parts. It is where our knowledge of statistical analysis will come in handy.

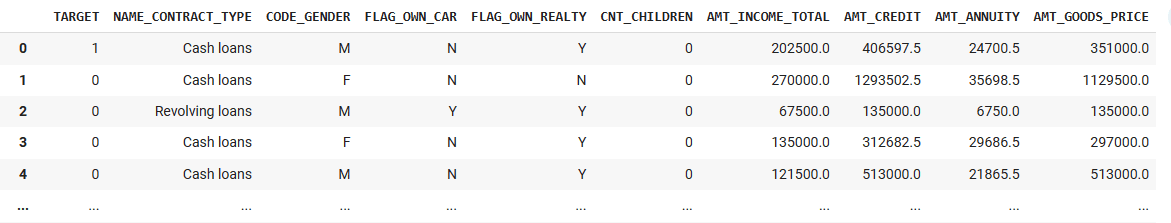
Photo by Kaboompics .com Core Data Science Concepts
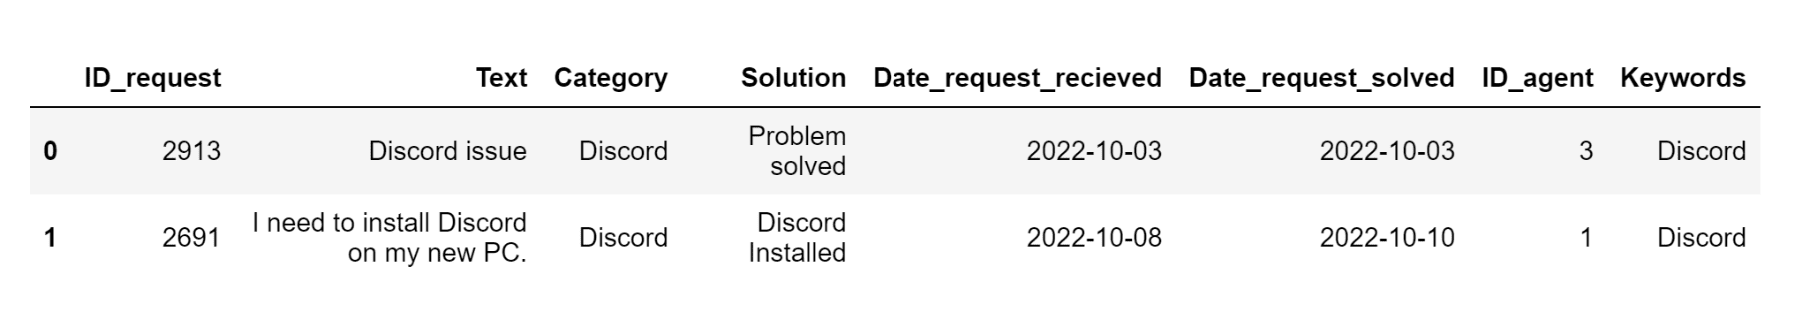
ChatGPT and GPT-4 are not good at devising customizable plans for your data project. You have to write too many follow-up prompts just to get the right action plan. And even then, you need to double-check the project plan before you present it to your manager. All of the follow-up promptings require an understanding of data core concepts like data ingestion, data cleaning, data manipulation, data visualizations, data analysis, and data modeling.
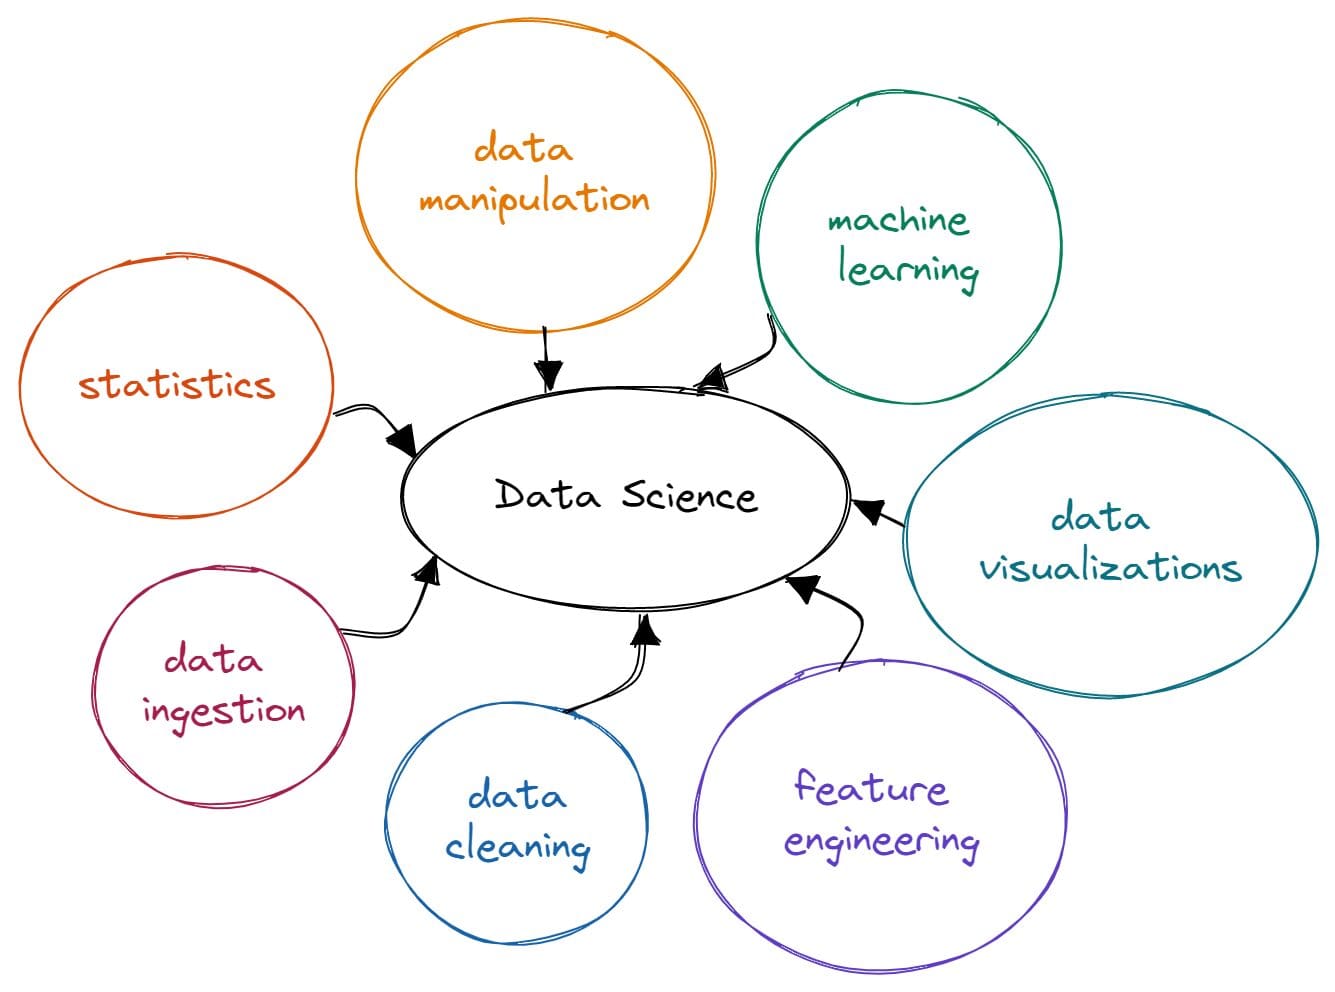
Image by Author
Even then, there are so many things where GPT-4 fails like debugging, research, coming up with the latest API, and adding specialized code.
Learn more about 20 Core Data Science Concepts for Beginners.
Natural Language Processing (NLP)
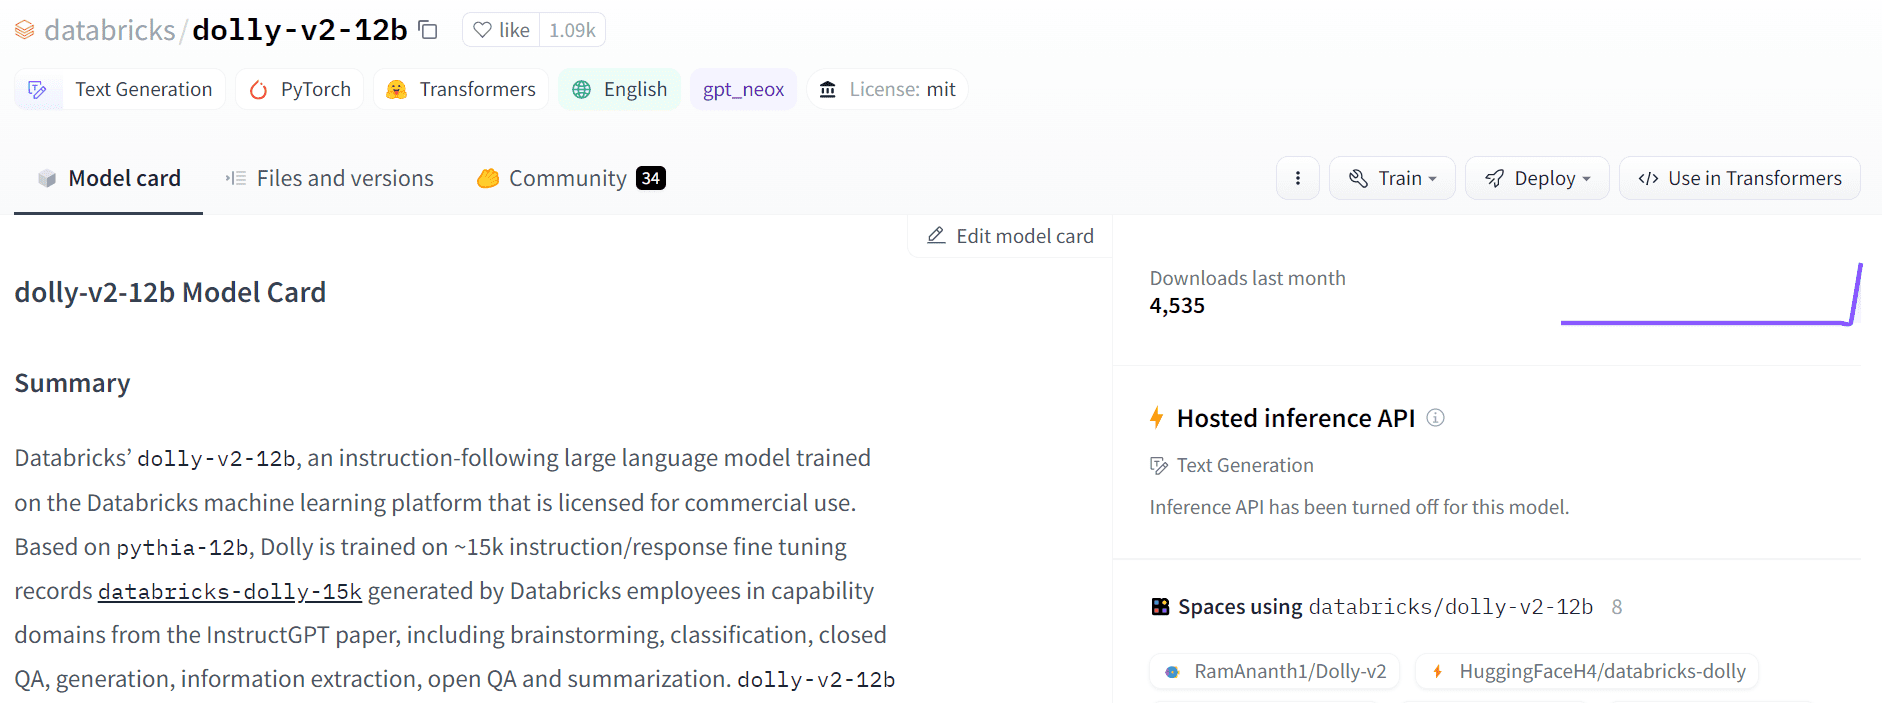
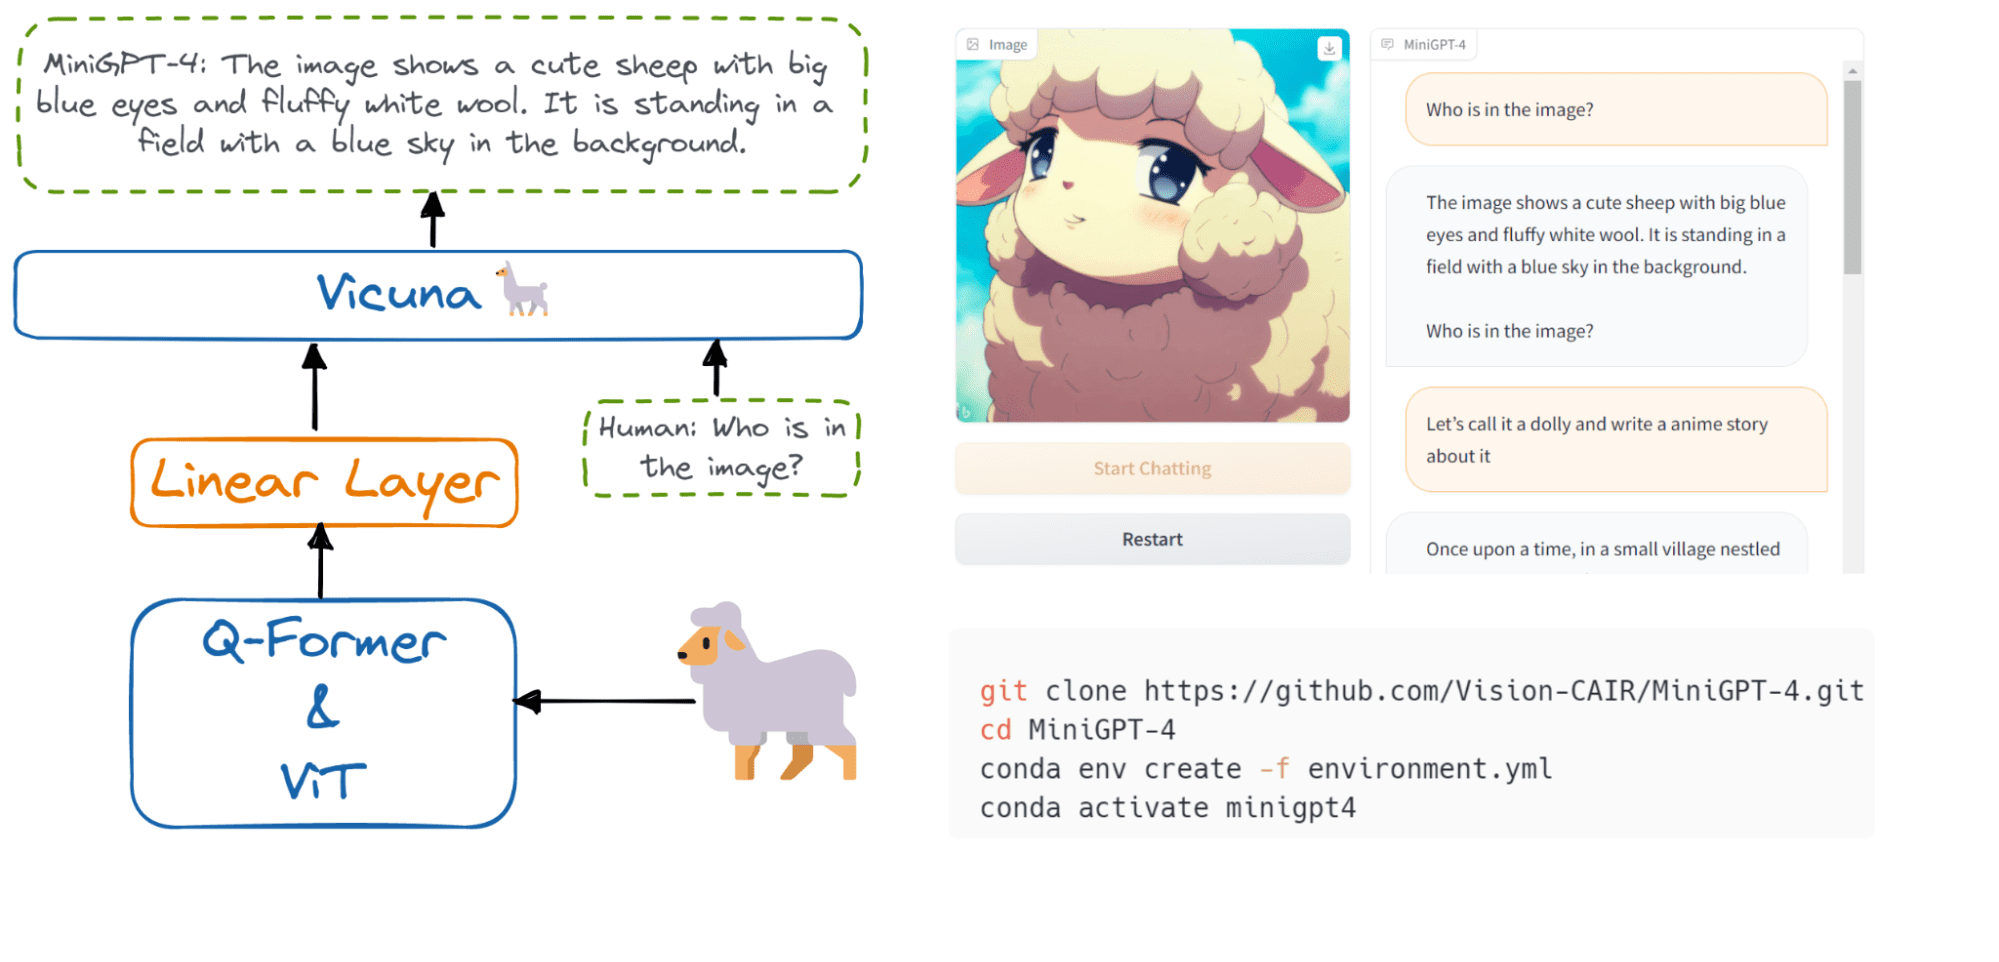
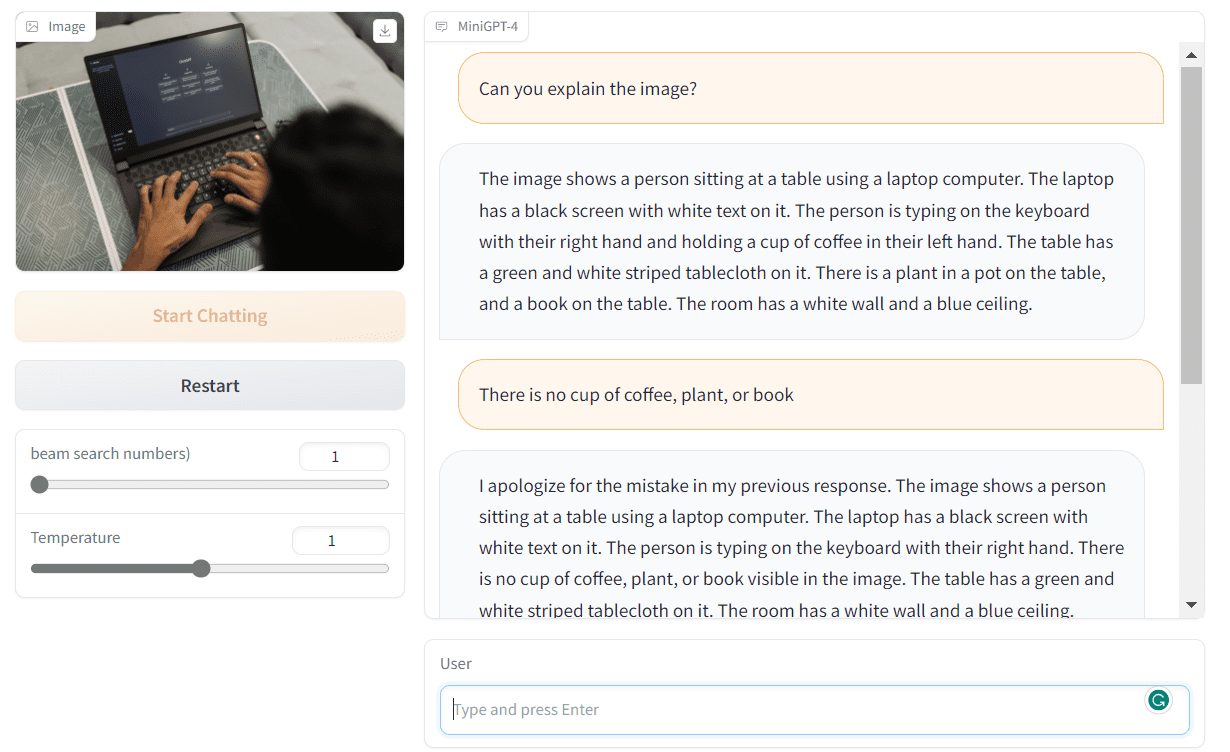
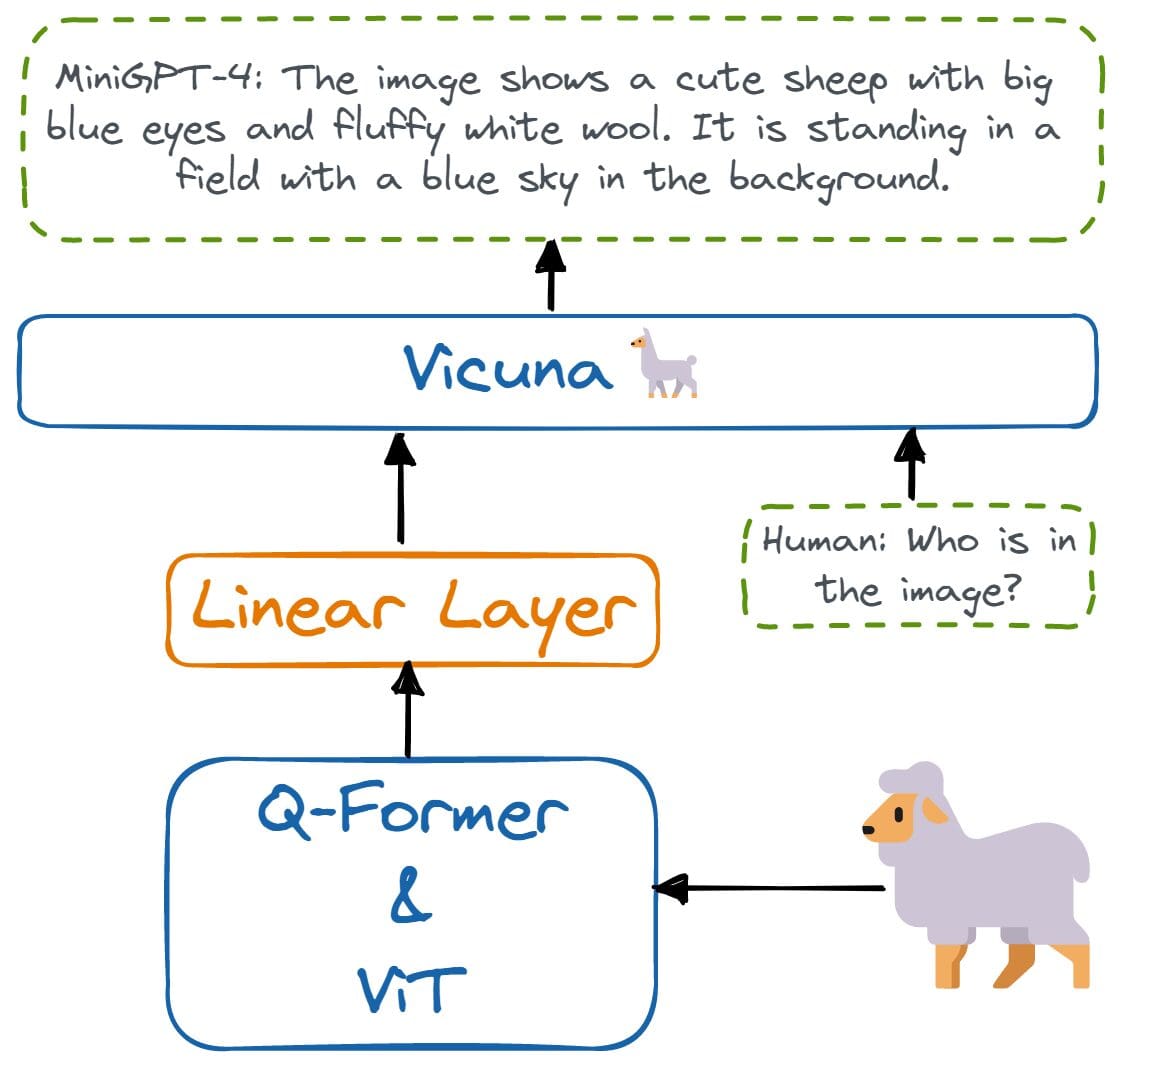
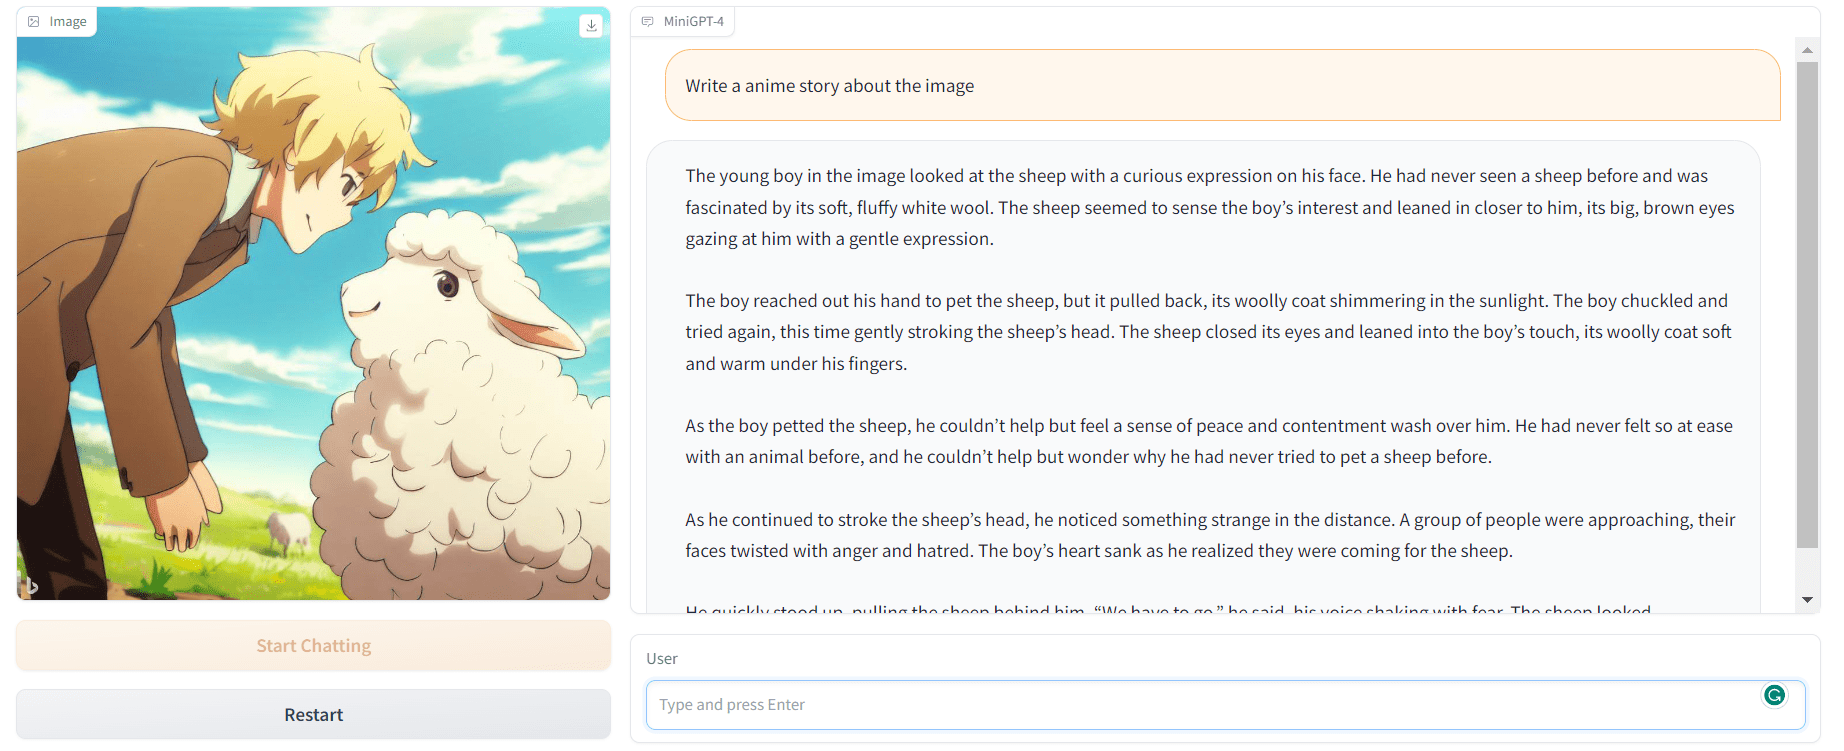
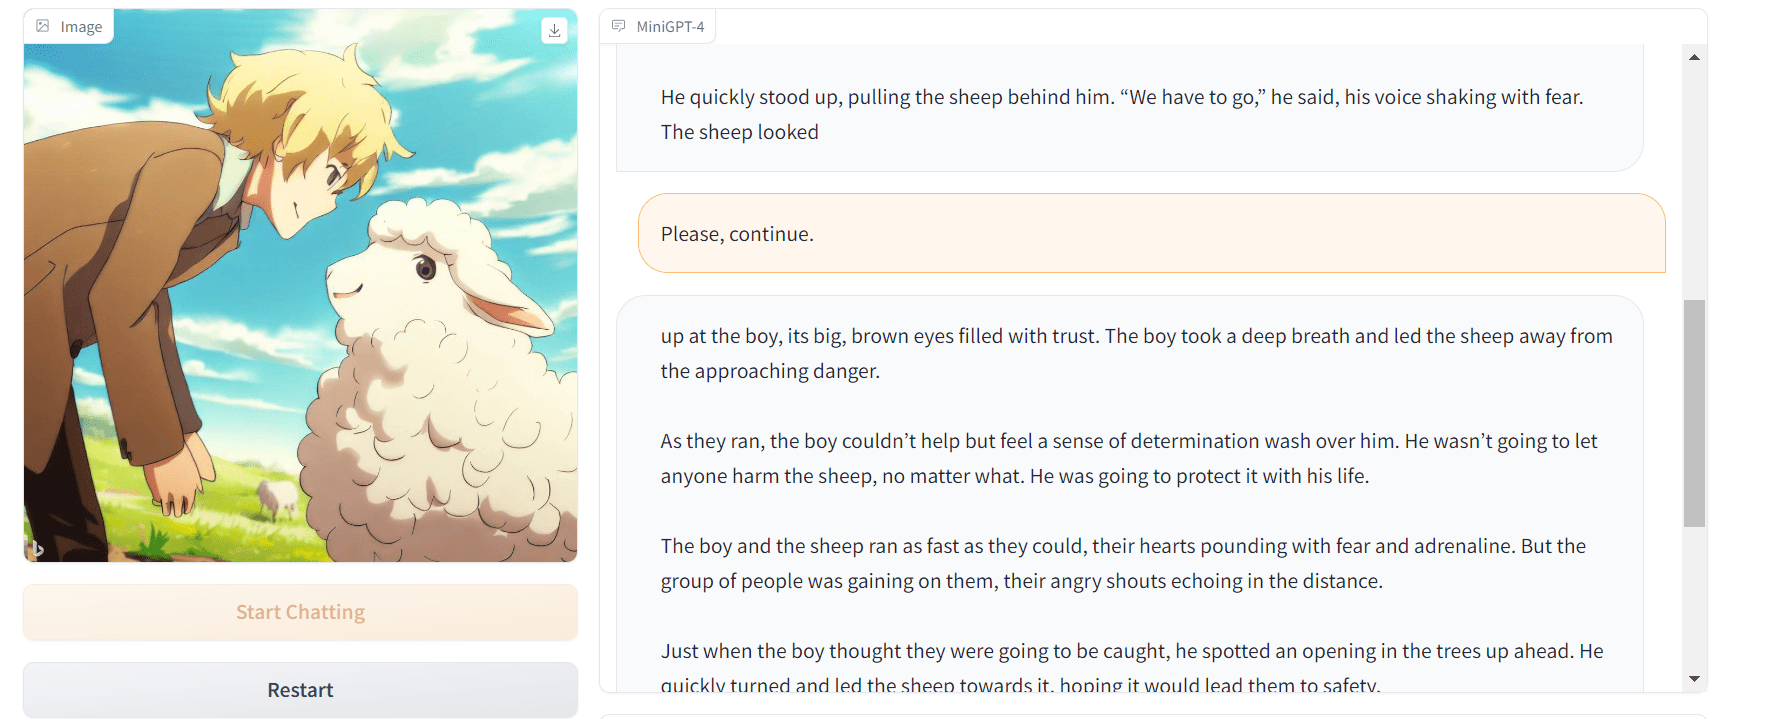
Both text-to-image and text-to-text generation models require expert knowledge of natural language processing. Without it, you won't be able to fine-tune the model, improve the results, or even come up with your solution. With the launch of ChatGPT, NLP, and Reinforcement learning have become hot jobs.
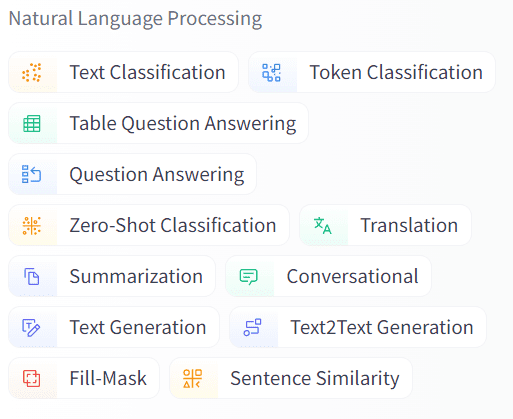
Image from Hugging Face
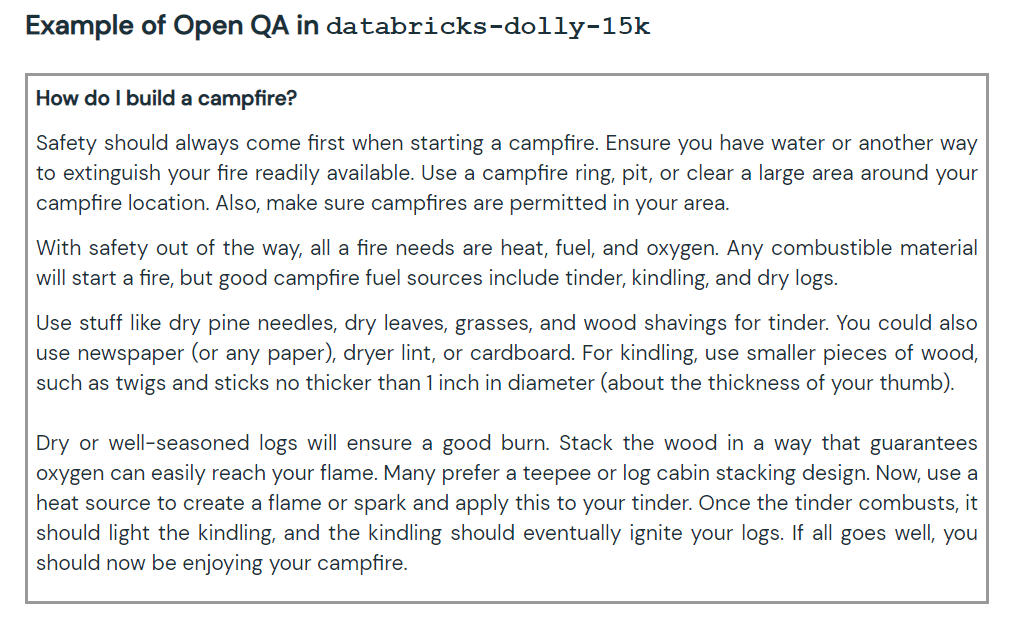
The large language models can be used for text classification, language translation, code generation, question answering, summarization, and more. Without knowledge about NLP, you won't be able to perform text analysis or create AI applications for specific tasks.
NLP core concepts are also required for security, understanding model architecture, and datasets. Without it, it will be hard for you to even pass the initial stage of interviews.
AI Prompt Engineering
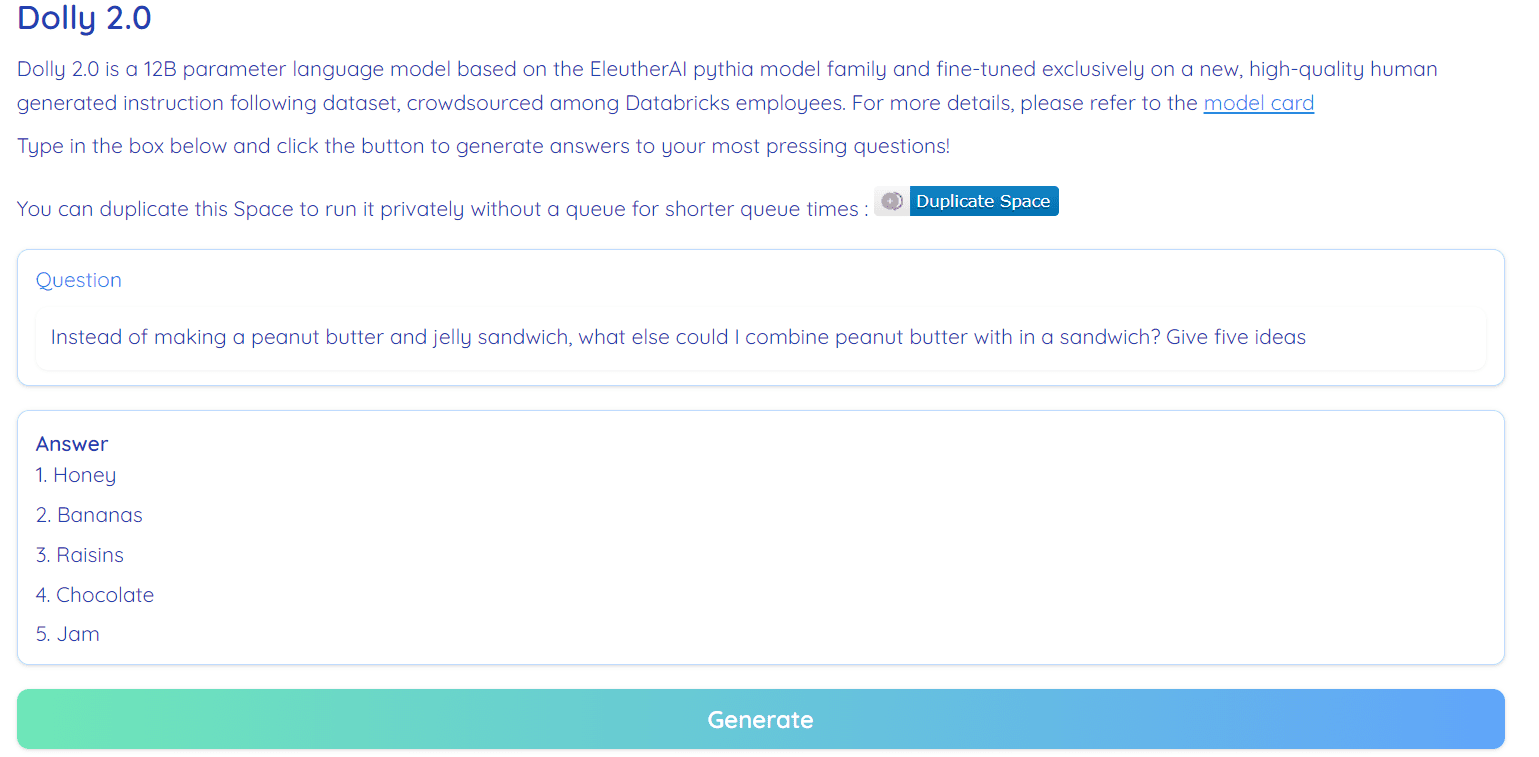
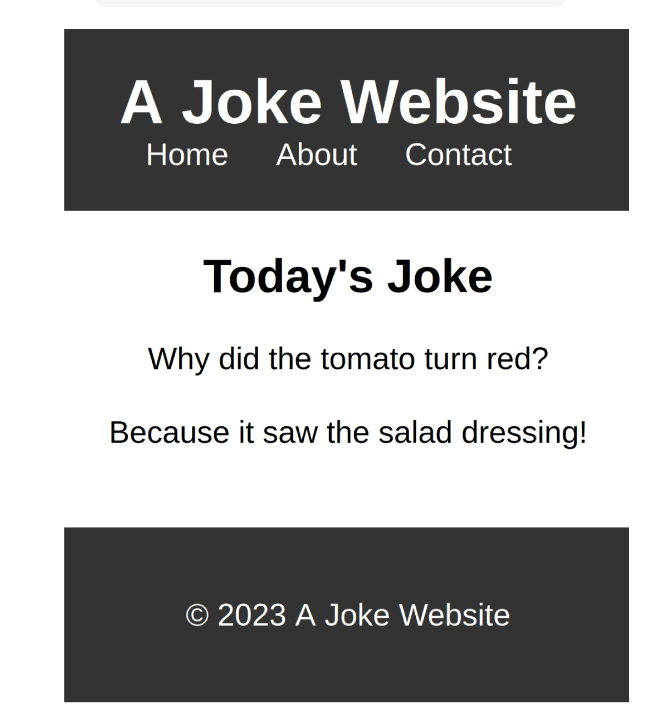
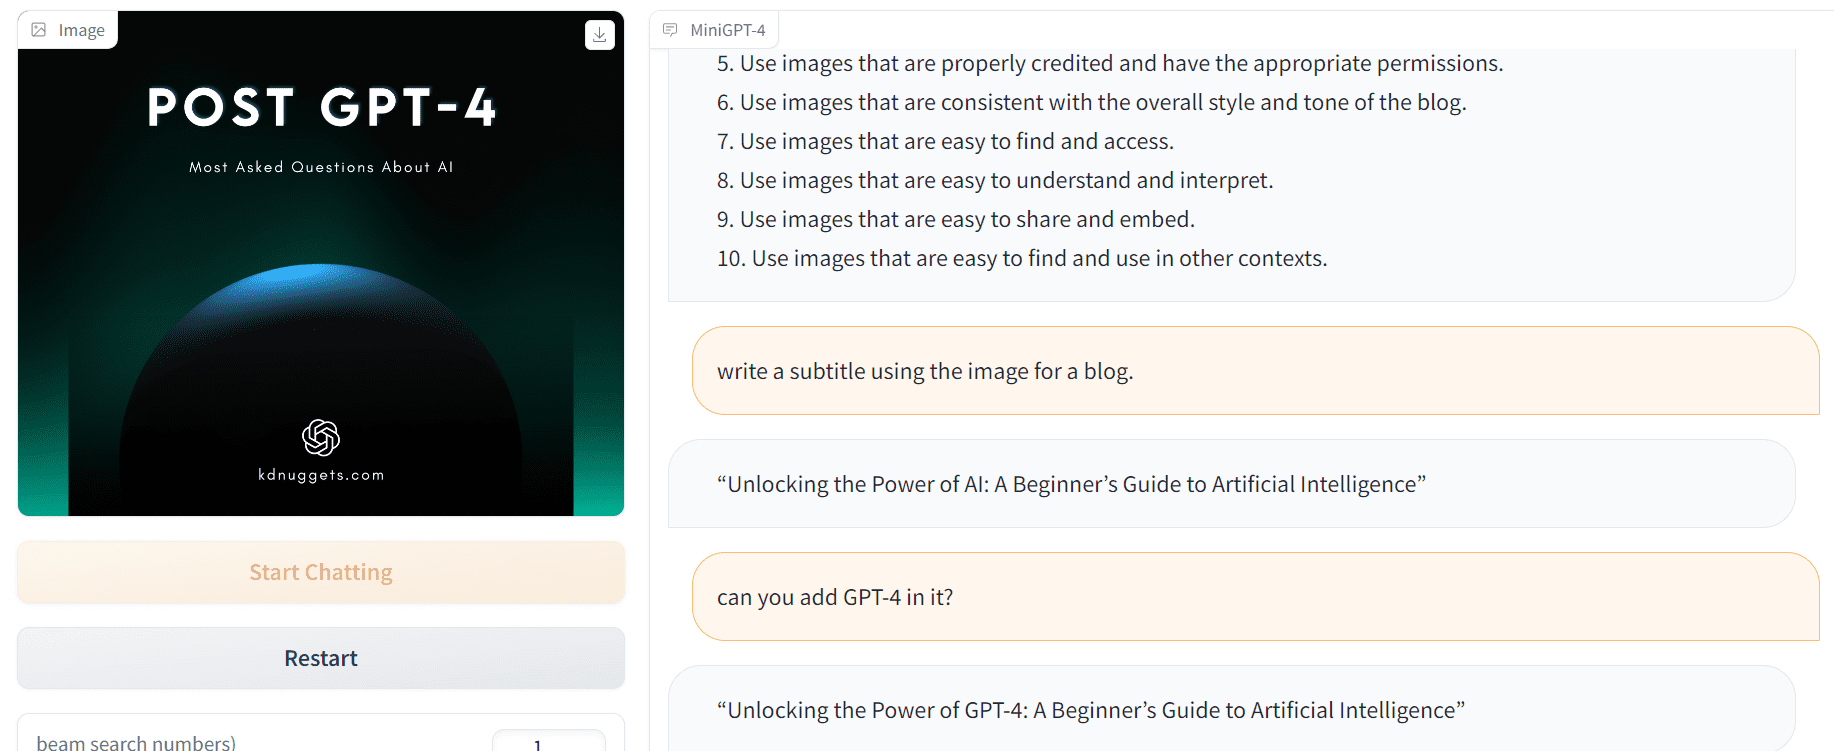
AI Prompt engineering is becoming an increasingly essential skill for all tech workers. Mastering this skill can enable you to write code that is both fast and efficient, devise comprehensive project plans, troubleshoot problems effectively, quickly adapt to new technologies, and produce top-quality reports and documentation. The potential applications of this AI are virtually limitless.

Image by Author
AI Prompt engineering makes you better at communicating with AI and believe me or not. AI is not here to replace us, but to assist us in our workspace. We can write a program or a report in 5 minutes. The only thing that you need to do is double-check the results.
Check out ChatGPT for Data Science Cheat Sheet, or learn about Prompt Engineering by looking at Top Free Resources To Learn ChatGPT.
Data Science Portfolio
Working on portfolio projects and showcasing your portfolio profile is important. You need to have good data science projects on GitHub or DagsHub, Kaggle, and Huggingface. You can even create your website by using templates like mine: Abid's Portfolio, or check out my blog on 7 Free Platforms for Building a Strong Data Science Portfolio.
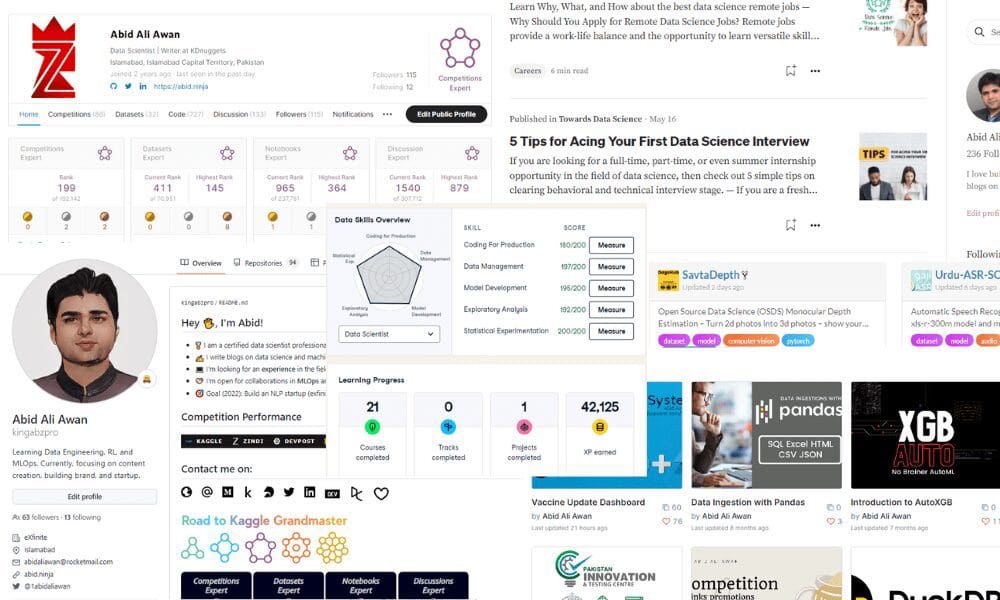
Image by Author
In today's digital age, maintaining a strong online presence on LinkedIn has become essential. As evidenced by the job offers I continue to receive through LinkedIn and GitHub, being active in online discussions and continuously working on your portfolio can significantly increase your chances of getting hired. Once you've finalized your project, it's important to showcase your results or create a brief tutorial, which you can share on platforms like Medium and KDnuggets. Don't forget to promote your projects on various social media platforms, as well as tech-focused Discord or Slack groups.
Interviews Preparation
For data science multiple interview sessions, you need to prepare for behavioral, situational, statistics, Python code, SQL, NLP, machine learning, and data analysis questions.
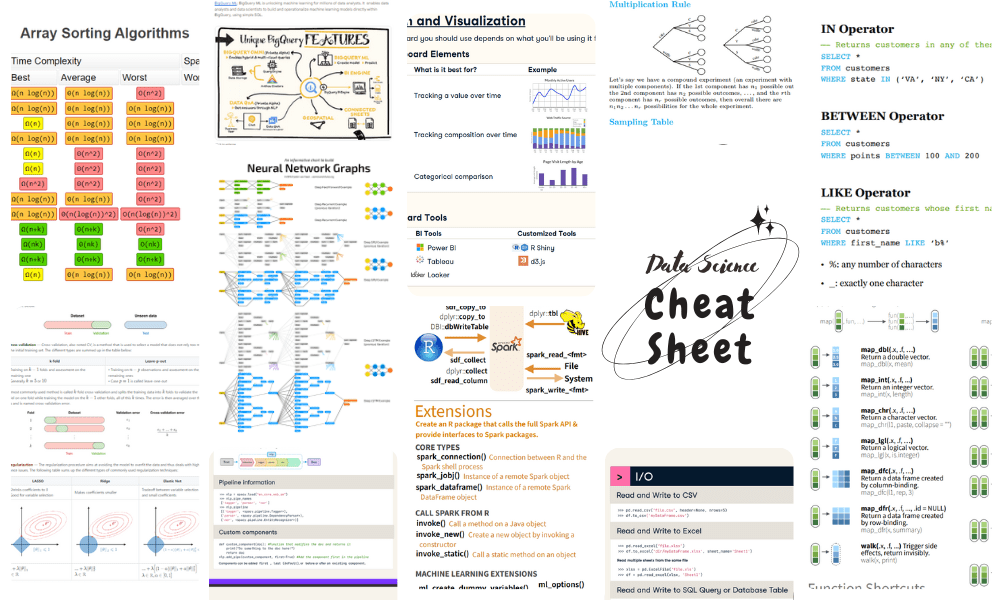
Image by Author
- You can improve your chances of passing the interview stage by working on versatile projects. Check out the complete collection of data science projects – Part 1 and Part 2
- Review mock interviews for every topic. Check out the complete collection of data science interviews – Part 1 and Part 2.
- Revise forgotten data science concepts using cheat sheets. Check out the complete collection of data science cheat sheets – Part 1 and Part 2.
- Research company profile, product category, and employees to understand what they are looking for and try to curate your answer accordingly.
- Showcase the knowledge of the latest tech and the ability to use AI to improve workflow.
AIOps
As I mentioned earlier, many companies are seeking data scientists and engineers to integrate AI into their existing products or build entirely new ones. Therefore, it's crucial to be mentally prepared to answer questions related to AI operations.

Image by Author
For example:
- How would you deploy a large language model
- Do you know how to build, debug, and run data pipelines
- Do you know how to use docker / kubernetes?
- Do you have experience with Azure, GCP, or AWS?
- How would you monitor models in production?
- How would you update your language model?
These questions are becoming common as companies are looking for data scientists with the knowledge about DevOps or MLOps. You can Learn MLOps with This Free Course.
Abid Ali Awan (@1abidaliawan) is a certified data scientist professional who loves building machine learning models. Currently, he is focusing on content creation and writing technical blogs on machine learning and data science technologies. Abid holds a Master's degree in Technology Management and a bachelor's degree in Telecommunication Engineering. His vision is to build an AI product using a graph neural network for students struggling with mental illness.
- Hiring or Looking to Get Hired in Data Science/Analytics? The INFORMS…
- Data Science Portfolio Project Ideas That Can Get You Hired (Or Not)
- 20 Machine Learning Projects That Will Get You Hired
- How to be a 10x data scientist
- What Does a Data Scientist Do?
- How I Got My First Job as a Data Scientist