Protean and NPCI Join Forces to Enhance ONDC’s Payments & Settlements

Protean eGov Technologies(formerly NSDL e-Governance Infrastructure), has partnered with NPCI Bharat BillPay Limited (NBBL) to enhance trust in payments and settlements on the Open Network for Digital Commerce (ONDC).

In collaboration with NPCI Bharat BillPay Limited (NBBL), Protean launched its Recon & Settlement Product (RSP) on NBBL’s NOCS platform, serving as a Settlement Agency (SA). The RSP is a decentralised settlement framework that enables secure, transparent, and seamless fund settlements on the ONDC platform. The partnership aims to streamline payment settlements and eliminate manual intervention or supervision.

Early adopters of Protean’s RSP on ONDC include various network participants such as Addble, Bizom, Eksecond, Esamuday, GrowthFalcons, Jakkur Technoparks Private Limited, Kotak Bank App, MyStore, ndhgo, nStore, placeorder.com (Rapidor), Bech.app, OrderDe.com (SignCatch), Spice Money, Snapbizz, Uengage, Vanghee, and more.

Protean’s RSP is designed to handle transaction volumes at population scale and offers features like automated rule-driven transaction reconciliation, integrated tax calculations, a comprehensive admin panel and dashboard, exception handling capability, and control reports for operational control and governance.

The launch of Protean’s RSP on NBBL’s NOCS platform would possibly empower network participants to focus on their core business activities while ensuring streamlined, accurate, and hassle-free payment settlements.

This also enhances operational efficiency and strengthens trust in the ONDC network, which ONDC CTO, Mitin Mishra, revealed that they were vouching for, during an interview with AIM.

He explained that with the whole unbundling and interoperability, since there would be no direct contact with a central platform to negotiate between the buyers and sellers, building trust is a challenge.

“In a network mode where the interfaces are becoming, you know, very blurred in a sense that now the seller do not need to know where the product is coming from and buyer do not know where their products are coming from. In this sense, making people understand, and then building trust that this model actually works(is a challenge).” Mishra said.

Protean has been introducing innovative products and interventions on the ONDC network since its inception.

With over 28 years of experience, Protean has played a crucial role in various government initiatives, including the development of PAN cards, the Tax Information Network, the National Pension System, and Aadhaar enrollments.

NBBL aims to redefine trust in payments and settlements on the ONDC by leveraging its technological expertise and the decentralised settlement framework.

Recently, Shiprocket, an e-commerce enablement platform, also announced the integration of its seller app with ONDC. Shiprocket aims to provide a seamless onboarding and post-support experience for sellers on ONDC, offering an additional low-cost demand channel.

The integration aims to generate increased revenue for merchants by onboarding their MSME (Micro, Small, and Medium Enterprises) along with leading brands such as GIVA and Boult Audio onto the ONDC platform.

The post Protean and NPCI Join Forces to Enhance ONDC’s Payments & Settlements appeared first on Analytics India Magazine.

From Theory to Practice: Building a k-Nearest Neighbors Classifier

Another day, another classic algorithm: k-nearest neighbors. Like the naive Bayes classifier, it’s a rather simple method to solve classification problems. The algorithm is intuitive and has an unbeatable training time, which makes it a great candidate to learn when you just start off your machine learning career. Having said this, making predictions is painfully slow, especially for large datasets. The performance for datasets with many features might also not be overwhelming, due to the curse of dimensionality.

In this article, you will learn

  • how the k-nearest neighbors classifier works
  • why it was designed like this
  • why it has these severe disadvantages and, of course,
  • how to implement it in Python using NumPy.

As we will implement the classifier in a scikit learn-conform way, it’s also worthwhile to check out my article Build your own custom scikit-learn Regression. However, the scikit-learn overhead is quite small and you should be able to follow along anyway.

You can find the code on my Github.

Theory

The main idea of this classifier is stunningly simple. It is directly derived from the fundamental question of classifying:

Given a data point x, what is the probability of x belonging to some class c?

In the language of mathematics, we search for the conditional probability p(c|x). While the naive Bayes classifier tries to model this probability directly using some assumptions, there is another intuitive way to compute this probability — the frequentist view of probability.

The naive View on Probabilities

Ok, but what does this mean now? Let us consider the following simple example: You roll a six-sided, possibly rigged die and want to compute the probability of rolling a six, i.e. p(roll number 6). How to do this? Well, you roll the die n times and write down how often it showed a six. If you have seen the number six k times, you say the probability of seeing a six is around k/n. Nothing new or fancy here, right?

Now, imagine that we want to compute a conditional probability, for example

p(roll number 6 | roll an even number)

You don’t need Bayes’ theorem to solve this. Just roll the die again and ignore all the rolls with an odd number. That’s what conditioning does: filtering results. If you rolled the die n times, have seen m even numbers and k of them were a six, the probability above is around k/m instead of k/n.

Motivating k-Nearest Neighbors

Back to our problem. We want to compute p(c|x) where x is a vector containing the features and c is some class. As in the die example, we

  • need a lot of data points,
  • filter out the ones with features x and
  • check how often these data points belong to class c.

The relative frequency is our guess for the probability p(c|x).

Do you see the problem here?

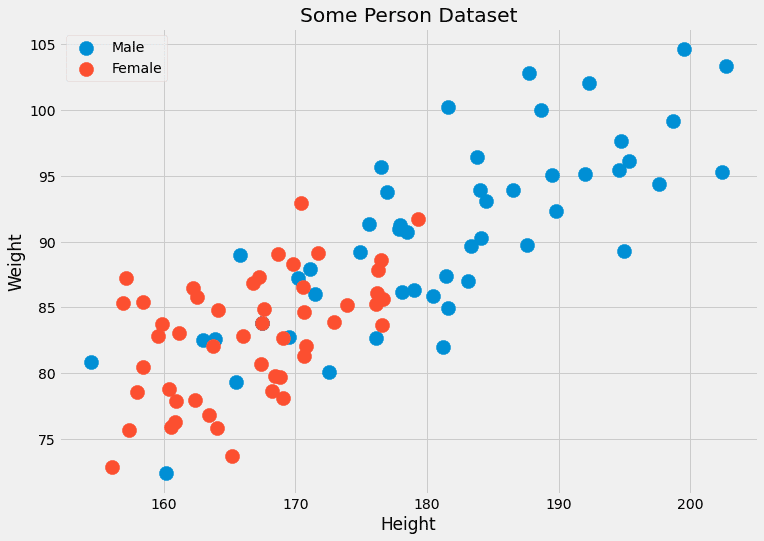
Usually, we don’t have many data points with the same features. Often only one, maybe two. For example, imagine a dataset with two features: the height (in cm) and the weight (in kg) of persons. The labels are male or female. Thus, x=(x?, x?) where x? is the height and x? is the weight, and c can take the values male and female. Let us look at some dummy data:

From Theory to Practice: Building a k-Nearest Neighbors Classifier
Image by the Author.

Since these two features are continuous, the probability of having two, let alone several hundred, data points is negligible.

Another problem: what happens if we want to predict the gender for a data point with features we have never seen before, such as (190.1, 85.2)? That is what prediction is actually all about. That’s why this naive approach does not work. What the k-nearest neighbor algorithm does instead is the following:

It tries to approximate the probability p(c|x) not with data points that have exactly the features x, but with data points with features close to x.

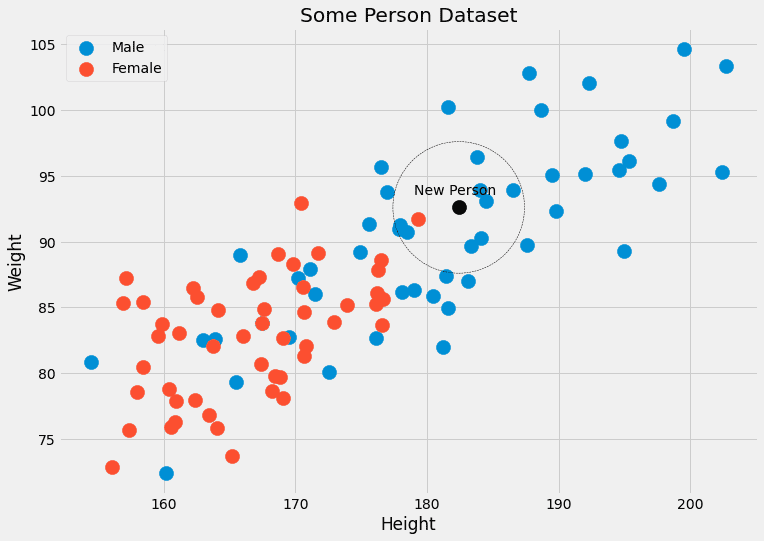
It is less strict, in a sense. Instead of waiting for a lot of persons with height=182.4 and weight=92.6, and checking their gender, k-nearest neighbors allows considering people close to having these characteristics. The k in the algorithm is the number of people we consider, it is a hyperparameter.

These are parameters that we or a hyperparameter optimization algorithm such as grid search have to choose. They are not directly optimized by the learning algorithm.

From Theory to Practice: Building a k-Nearest Neighbors Classifier
Image by the Author.

The Algorithm

We have everything we need now to describe the algorithm.

Training:

  1. Organize the training data in some way. During prediction time, this order should make it possible to give us the k closest points for any given data point x.
  2. That’s it already! 😉

Prediction:

  1. For a new data point x, find the k closest neighbors in the organized training data.
  2. Aggregate the labels of these k neighbors.
  3. Output the label/probabilities.

We can’t implement this so far, because there are a lot of blanks we have to fill in.

  • What does organizing mean?
  • How do we measure proximity?
  • How to aggregate?

Besides the value for k, these are all things we can choose, and different decisions give us different algorithms. Let’s make it easy and answer the questions as follows:

  • Organizing = just save the training dataset as it is
  • Proximity = Euclidean distance
  • Aggregation = Averaging

This calls for an example. Let us check the picture with the person data again.

From Theory to Practice: Building a k-Nearest Neighbors Classifier

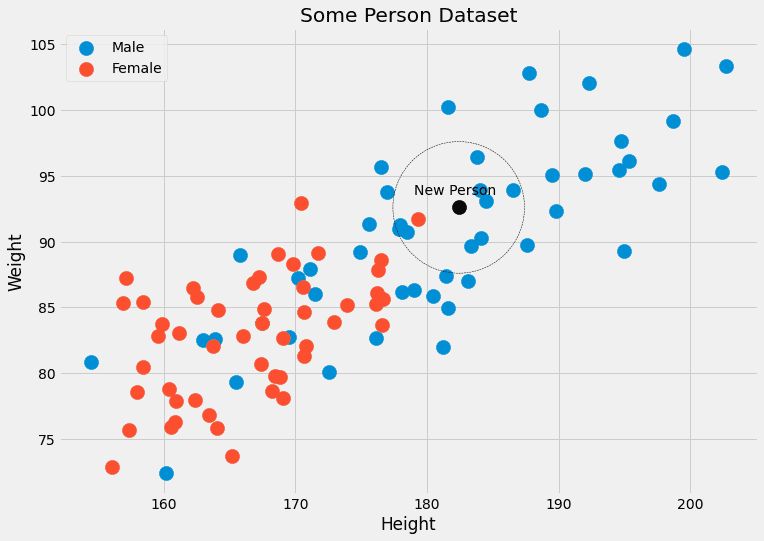
We can see that the k=5 closest data points to the black one have 4 male labels and one female label. So we could output that the person belonging to the black point is, in fact, 4/5=80% male and 1/5=20% female. If we prefer a single class as output, we would return male. No problem!

Now, let us implement it.

Implementation

The hardest part is to find the nearest neighbors to a point.

A quick primer

Let us do a small example of how you can do this in Python. We start with

import numpy as np    features = np.array([[1, 2], [3, 4], [1, 3], [0, 2]])  labels = np.array([0, 0, 1, 1])    new_point = np.array([1, 4])

From Theory to Practice: Building a k-Nearest Neighbors Classifier
Image by the Author.

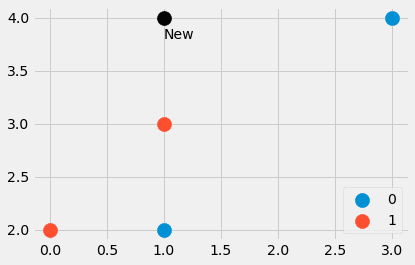
We have created a small dataset consisting of four data points, as well as another point. Which are the closest points? And should the new point have the label 0 or 1? Let us find out. Typing in

distances = ((features - new_point)**2).sum(axis=1)

gives us the four values distances=[4, 4, 1, 5], which is the squared Euclidean distance from new_point to all other points in features . Sweet! We can see that point number three is the closest, followed by points number one and two. The fourth point is furthest away.

How can we extract the closest points now from the array [4, 4, 1, 5]? A distances.argsort() helps. The result is [2, 0, 1, 3] which tells us that the data point with index 2 is the smallest (out point number three), then the point with index 0, then with index 1, and finally the point with index 3 is the largest.

Note that argsort put the first 4 in distances before the second 4. Depending on the sorting algorithm, this could also be the other way around, but let’s not go into these details for this introductory article.

How if we want the three closest neighbors, for example, we could get them via

distances.argsort()[:3]

and the labels correspond to these closest points via

labels[distances.argsort()[:3]]

We get [1, 0, 0], where 1 is the label of the closest point to (1, 4), and the zeroes are the labels belonging to the next two closest points.

That’s all we need, let’s get to the real deal.

The final Code

You should be quite familiar with the code. The only new function is np.bincount which counts the occurrences of the labels. Note that I implemented a predict_proba method first to compute probabilities. The method predict just calls this method and returns the index (=class) with the highest probability using an argmaxfunction. The class awaits classes from 0 to C-1, where C is the number of classes.

Disclaimer: This code is not optimized, it only serves an educational purpose.

import numpy as np  from sklearn.base import BaseEstimator, ClassifierMixin  from sklearn.utils.validation import check_X_y, check_array, check_is_fitted    class KNNClassifier(BaseEstimator, ClassifierMixin):      def __init__(self, k=3):          self.k = k            def fit(self, X, y):          X, y = check_X_y(X, y)          self.X_ = np.copy(X)          self.y_ = np.copy(y)          self.n_classes_ = self.y_.max() + 1                    return self            def predict_proba(self, X):          check_is_fitted(self)          X = check_array(X)                    res = []          for x in X:              distances = ((self.X_ - x)**2).sum(axis=1)              smallest_distances = distances.argsort()[:self.k]              closest_labels = self.y_[smallest_distances]              count_labels = np.bincount(                  closest_labels,                  minlength=self.n_classes_              )                            res.append(count_labels / count_labels.sum())                    return np.array(res)            def predict(self, X):          check_is_fitted(self)          X = check_array(X)                    res = self.predict_proba(X)                    return res.argmax(axis=1)

And that’s it! We can do a small test and see if it agrees with the scikit-learn k-nearest neighbor classifier.

Testing the Code

Let us create another small dataset for testing.

from sklearn.datasets import make_blobs  import numpy as np    X, y = make_blobs(n_samples=20, centers=[(0,0), (5,5), (-5, 5)], random_state=0)  X = np.vstack([X, np.array([[2, 4], [-1, 4], [1, 6]])])  y = np.append(y, [2, 1, 0])

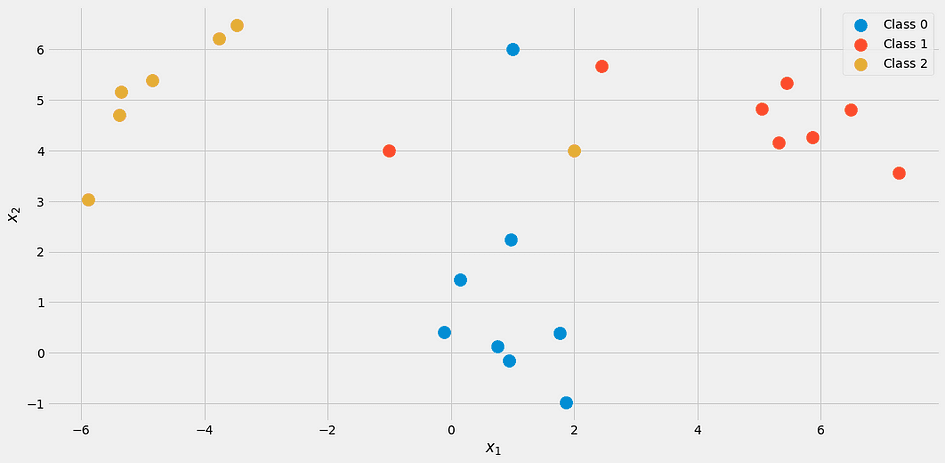
It looks like this:

From Theory to Practice: Building a k-Nearest Neighbors Classifier
Image by the Author.

Using our classifier with k = 3

my_knn = KNNClassifier(k=3)  my_knn.fit(X, y)    my_knn.predict_proba([[0, 1], [0, 5], [3, 4]])

we get

array([[1.        , 0.        , 0.        ],         [0.33333333, 0.33333333, 0.33333333],         [0.        , 0.66666667, 0.33333333]])

Read the output as follows: The first point is 100% belonging to class 1 the second point lies in each class equally with 33%, and the third point is about 67% class 2 and 33% class 3.

If you want concrete labels, try

my_knn.predict([[0, 1], [0, 5], [3, 4]])

which outputs [0, 0, 1]. Note that in the case of a tie, the model as we implemented it outputs the lower class, that’s why the point (0, 5) gets classified as belonging to class 0.

If you check the picture, it makes sense. But let’s reassure ourselves with the help of scikit-learn.

from sklearn.neighbors import KNeighborsClassifier    knn = KNeighborsClassifier(n_neighbors=3)  knn.fit(X, y)    my_knn.predict_proba([[0, 1], [0, 5], [3, 4]])

The result:

array([[1.        , 0.        , 0.        ],         [0.33333333, 0.33333333, 0.33333333],         [0.        , 0.66666667, 0.33333333]])

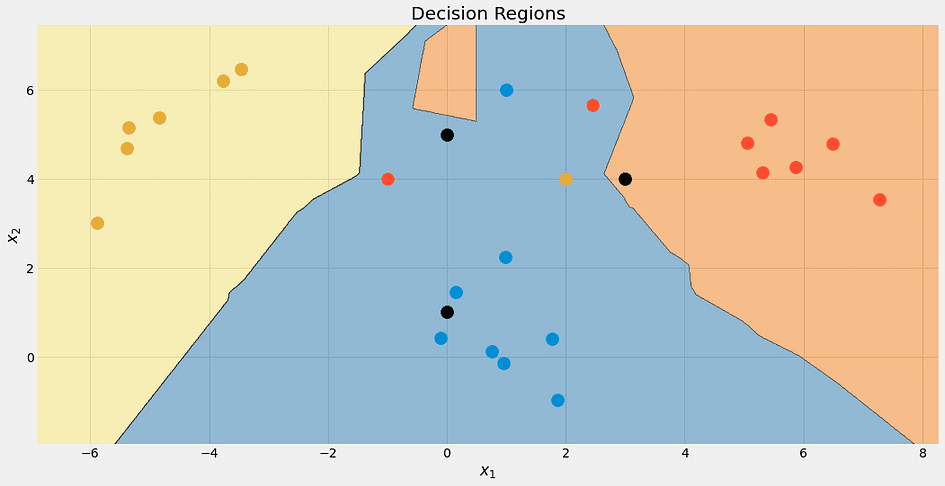
Phew! Everything looks good. Let us check the decision boundaries of the algorithm, just because it’s pretty.

From Theory to Practice: Building a k-Nearest Neighbors Classifier
Image by the Author.

Again, the top black point is not 100% blue. It’s 33% blue, red and yellow, but the algorithm decides deterministically for the lowest class, which is blue.

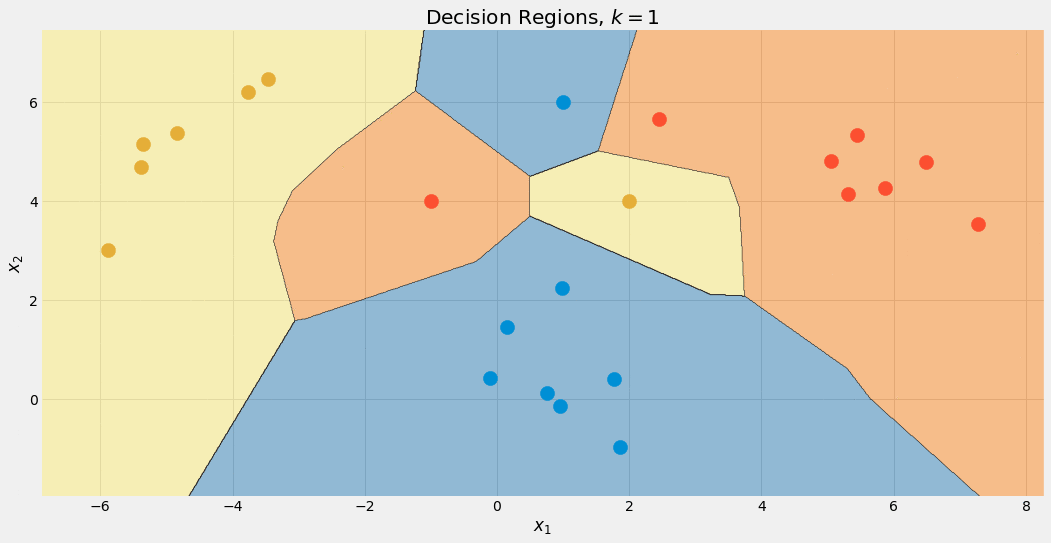
We can also check the decision boundaries for different values of k.

From Theory to Practice: Building a k-Nearest Neighbors Classifier
Image by the Author.

Note that the blue region gets bigger in the end, because of this preferential treatment of this class. We can also see that for k=1 the boundaries are a mess: the model is overfitting. On the other side of the extreme, k is as large as the size of the dataset, and all points are used for the aggregation step. Thus, each data point gets the same prediction: the majority class. The model is underfitting in this case. The sweet spot is somewhere in between and can be found using hyperparameter optimization techniques.

Before we get to the end, let us see which problems this algorithm has.

Drawbacks of k-Nearest Neighbors

The problems are as follows:

  1. Finding the nearest neighbors takes a lot of time, especially with our naive implementation. If we want to predict the class of a new data point, we have to check it against every other point in our dataset, which is slow. There are better ways to organize the data using advanced data structures, but the problem still persists.
  2. Following problem number 1: Usually, you train models on faster, stronger computers and can deploy the model on weaker machines afterward. Think about deep learning, for example. But for k-nearest neighbors, the training time is easy and the heavy work is done during prediction time, which is not what we want.
  3. What happens if the nearest neighbors are not close at all? Then they don’t mean anything. This can already happen in datasets with a small number of features, but with even more features the chance of encountering this problem increases drastically. This is also what people refer to as the curse of dimensionality. A nice visualization can be found in this post of Cassie Kozyrkov.

From Theory to Practice: Building a k-Nearest Neighbors Classifier

Especially because of problem 2, you don’t see the k-nearest neighbor classifier in the wild too often. It’s still a nice algorithm you should know, and you can also use it for small datasets, nothing wrong with that. But if you have millions of data points with thousands of features, things get rough.

Conclusion

In this article, we discussed how the k-nearest neighbor classifier works and why its design makes sense. It tries to estimate the probability of a data point x belonging to a class c as well as possible using the closest data points to x. It is a very natural approach, and therefore this algorithm is usually taught at the beginning of machine learning courses.

Note that it is really simple to build a k-nearest neighbor regressor, too. Instead of counting occurrences of classes, just average the labels of the nearest neighbors to get a prediction. You could implement this on your own, it’s just a small change!

We then implemented it in a straightforward way, mimicking the scikit-learn API. This means that you can also use this estimator in scikit-learn’s pipelines and grid searches. This is a great benefit since we even have the hyperparameter k that you can optimize using grid search, random search, or Bayesian optimization.

However, this algorithm has some serious issues. It is not suitable for large datasets and it can’t be deployed on weaker machines for making predictions. Together with the susceptibility to the curse of dimensionality, it is an algorithm that is theoretically nice but can only be used for smaller data sets.

Dr. Robert Kübler is a Data Scientist at METRO.digital and Author at Towards Data Science.

Original. Reposted with permission.

More On This Topic

  • Nearest Neighbors for Classification
  • K-nearest Neighbors in Scikit-learn
  • Exploring The Brute Force K-Nearest Neighbors Algorithm
  • How to Build An Image Classifier in Few Lines of Code with Flash
  • How to Train a Joint Entities and Relation Extraction Classifier using BERT…
  • What is Graph Theory, and Why Should You Care?

An algorithm for checking for palindrome numbers

Introduction
Checking whether a number is a palindrome can be a common problem in programming, and there are different approaches to solving it. In this article, we will discuss an algorithm for checking if a number is a palindrome number. We will explain the steps involved in the algorithm, provide examples to illustrate it, and explore its time and space complexity.
In this article, we will understand the general algorithm for checking palindrome numbers. But there are different approaches and special cases. If you want to learn more about this and see solutions in multiple programming languages. We will focus on Java implementation in this article.

What is Palindrome Number?
A palindrome number is a number that reads the same forward and backward. In other words, if you reverse the digits of a palindrome number, you get the same number.
For example, 121 is a palindrome number because if you read it backward, it is still 121.

Screenshot-2023-06-22-at-12.18.43-AM

Another example of a palindrome number is 132231. If you read 132231 backward, it is still 132231.
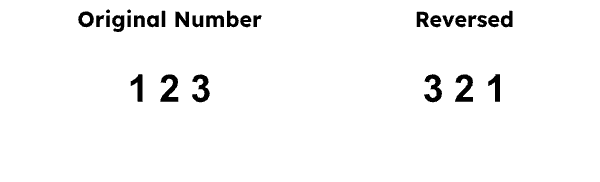
However, a number like 123 is not a palindrome number because if you read it backward, it becomes 321, which is not the same as the original number.

Screenshot-2023-06-22-at-6.13.58-PM

Palindrome numbers are interesting and useful in many areas, including mathematics, computer science, and cryptography.

Problem Statement
Given a positive integer number num, Print whether the number is a palindrome number or not.
Example 1:
Input:
1256521
Output: Yes, It is a palindrome number

Example 2:
Input:
12345421
Output: No, It is not a palindrome number

So before moving to see the solution, first give try on solving this problem on your own. You can practice it here.

Approach 1:
One approach to checking if a number is a palindrome is to reverse the digits of the number and compare it with the original number. If the reversed number is the same as the original number, then the number is a palindrome.

To understand this approach better, let’s take an example. Suppose we want to check if the number 12321 is a palindrome. We can reverse the digits of the number to get 12321. We can then compare this with the original number, which is also 12321. Since the reversed number is the same as the original number, we can conclude that 12321 is a palindrome number. So let’s see the working algorithm for this approach.

Algorithm
Suppose the input is given as a positive integer num.

  • Initialize a new variable reverseNum to 0.
  • Initialize a new variable temp to num
  • While temp is not equal to 0:
  • Calculate the remainder when the temp is divided by 10 and store it in a variable digit.
  • Multiply reverseNum by 10 and add the digit to it.
  • Divide temp by 10 and discard any remainder.
  • If num is equal to reverseNum, return true. (num is a palindrome number)
  • Otherwise, return false. (num is not a palindrome number)

Implementation

import java.util.Scanner; public class Main { public static void main(String args[]) { Scanner input = new Scanner(System.in);
    // Getting the user input     int num = input.nextInt();      // Initialize variables     int reverseNum = 0;     int temp = num;      // Reverse the digits of the number     while (temp != 0) {         int digit = temp % 10;         reverseNum = reverseNum * 10 + digit;         temp = temp / 10;     }      // Check if the original number is equal to the reversed number     if (num == reverseNum) {         System.out.println(" Yes, "+ num +" is a palindrome number");     } else {         System.out.println(" No, "+ num +" is not a palindrome number.");     } } }

Run this Code

Input: 123

Output: No, 123 is not a palindrome number.

Input: 12321

Output: Yes, 12321 is a palindrome number.

In the first approach, we used the method of reversing the number. However, this approach has a drawback, which is that it may not work for large input numbers that cannot fit in an integer or float data type. In such cases, the second approach can be used.

Approach 2:
We can take the input from the user in the form of a string or convert the number to a string format. With the help of two pointers pointing at the start and end of the string, we can iterate over the string and check whether it is a palindrome or not. The algorithm below explains the steps to solve this.

Algorithm:

  1. Convert “num” into a string “str”
    Initialize two pointers “left” and “right” pointing to the start and end of “str”, respectively
    While “left” is less than or equal to “right”, do the following:
    If the characters at “left” and “right” are not equal, set “isPalindrome” to false and break the loop
    Otherwise, increment “left” and decrement “right”
    If the loop completes without breaking, set “isPalindrome” to true
    Return “isPalindrome”

Code:

import java.util.Scanner;  public class PalindromeNumber { public static void main(String[] args) { Scanner sc = new Scanner(System.in); System.out.print("Enter a number: "); int num = sc.nextInt(); boolean isPalindrome = checkPalindrome(num); if (isPalindrome) { System.out.println(num + " is a palindrome number"); } else { System.out.println(num + " is not a palindrome number"); } sc.close(); }
public static boolean checkPalindrome(int num) {     String str = Integer.toString(num);     int left = 0;     int right = str.length() - 1;     while (left <= right) {         if (str.charAt(left) != str.charAt(right)) {             return false;         }         left++;         right--;     }     return true; } }
Input: 123 Output: 123 is not a palindrome number.  Input: 12321 Output: 12321 is a palindrome number.

Time Complexity: O(log n), where n is the input number. This is because we need to iterate over each digit of the input number, and the number of digits in the number is proportional to its logarithm base 10.

Space complexity: O(1), as we only use a constant amount of additional memory to store a few variables.

Conclusion
In conclusion, we have seen how to check if a number is a palindrome using two approaches in Java. The first approach involves reversing the digits of the number and checking if the original number is equal to the reversed number. The second approach involves comparing the first and last digits of the number, then iteratively checking the remaining digits. Both approaches have a time complexity of O(log n) and a space complexity of O(1), making them efficient and practical for checking large numbers.

Cosmetic product recognition system for product categorization using AI & ML

medium-shot-smiley-women-market_23-2149148500

Welcome to the shining world of beauty and wellness. This is where makeup artists, skincare devotees, and beauty enthusiasts come together to find the right potion to enhance their beauty. There is, however, a comical conundrum hidden amongst the sea of cosmetic products – the constant struggle to categorize them all! Let’s explore the mysteries of cosmetic product recognition using machine intelligence, cutting-edge technology, and artificial intelligence. Imagine a squad of robotic assistants armed with magnifying glasses, sassy attitudes, and impeccable fashion sense, poised to categorize cosmetic products. Each lipstick shade, pore-refining serum, and volumizing mascara they review is scrutinized with their microchips humming and a sparkle in their circuitry. This scene could easily be adapted from a sci-fi comedy, where artificial intelligence meets the shimmering world of beauty.

With so many shades, shimmers, and sparkles in the world of cosmetics, keeping track of all the products can be challenging. The beauty sleuths are on the case! Do not be alarmed, however. Cosmetic Product Recognition System is a technological innovation that ensures to simplify the complex world of care, beauty, and wellness.

In the beauty and wellness industry, accurate categorization of cosmetic products is essential for managing inventory, providing personalized recommendations, and improving customer service. Due to the wide variety of products available, categorizing the products manually is time-consuming and subject to human error. By utilizing the power of machine learning, a cosmetic product recognition system can automate the categorization process, allowing businesses to customize their catalogs and provide customers with an enhanced shopping experience.

Collecting and preprocessing data:

In order to train a cosmetic product recognition system, it is important to provide an explanation of why high-quality data is essential. Investigate the method used to collect product information, such as images, descriptions, ingredients, and labels. It is necessary to preprocess data, including resizing images, extracting features, and normalizing text, in order to prepare it for machine learning algorithms.

A machine learning model must be trained by the book:

Convolutional neural networks (CNNs) and recurrent neural networks (RNNs) are two types of machine learning algorithms that can be used to recognize cosmetic products. It is imperative that the splitting of the datasets, the design of the model architecture, the tuning of hyperparameters, and optimization techniques are reviewed during the training process. In order for training data to be useful, it must include a wide range of cosmetic products.

Representation and extraction of features:

Explain how meaningful features can be extracted from images and text data of cosmetic products. What is the process by which CNNs are able to learn visual features from product images, such as color, shape, and texture? Using natural language processing techniques, demonstrate how ingredients analyses, benefits, and usage instructions can be extracted from product descriptions through natural language processing.

The following categories and classifications have been established:

What are the different categories of cosmetic products that the trained model can be used to categorize, such as skincare products, haircare products, makeup products, and fragrance products? Evaluate the performance of the model using the evaluation metrics such as accuracy, precision, recall, and F1 score. In order to achieve optimal results, it is important to continually refine and update your categorization model.

Application and integration:

Explain how the cosmetic product recognition system can be incorporated into e-commerce platforms, mobile applications, or in-store kiosks in order to facilitate seamless categorization and personalized recommendations for customers. Provide a brief overview of the potential benefits, such as enhanced search functionality, a more enjoyable customer experience, and a higher conversion rate. Scalability, real-time, and adaptability are essential requirements.

Ethical considerations and future directions:

Develop a method for recognizing cosmetic products that incorporates augmented reality (AR) or virtual try-on features. Provide an overview of ethical considerations pertaining to data privacy, bias mitigation, and categorization that ensures inclusivity. To address these challenges, it is essential to continue research, collaborate, and develop industry standards.

Finally, we conclude:

Make a case for the importance of a machine learning-powered system for recognizing cosmetic products in the beauty and wellness industry. Describe how automated categorization can lead to more efficient inventory management, personalized recommendations, and enhanced customer satisfaction. Ensure that cosmetic product categorization is fair and transparent, and emphasize the potential for continued innovation.

A cosmetic product recognition system allows businesses to improve their operation in the digital age by improving their accuracy in categorizing products, providing customers with more accurate categorizations, and offering personalized beauty and wellness services.

Automation Game-Changer: Exploring GPT Function Call with AWS S3 Integration

1_AD7SIBJ5RDqpI0N3oXp7Iw

The state-of-the-art models like GPT-4 and PaLM 2 have demonstrated the ability to perform complex tasks requiring reasoning and decision-making, pushing the boundaries of automated processes. Adding to this advancement, OpenAI’s recent API update empowers developers to define functions and parameters when prompting ‘gpt-4’ and ‘gpt-3.5’ models , making the automation of tasks more practical.

This development paves the way for creating active bots that interact with users and execute actions based on the conversations, automating manual processes without the need for complex dependencies. In this article, we will explore the function capabilities with a practical example of automating AWS S3 tasks in a conversation-based implementation.

Fundamentals

Before diving into the implementation details, it is essential to understand the underlying mechanisms for the LLMs. PaLM-2 and GPT-4 are large language models built upon the transformer architecture, a type of neural network designed for natural language processing tasks and handling long contextual inputs. Transformers can effectively capture relationships between words in natural language text and manage long-range dependencies by utilizing self-attention mechanisms that weigh the importance of different words in a sequence.

Few-shot learning is an approach employed with large language models, where these models learn new tasks from just a few examples. Unlike traditional machine learning methods, LLMs do not require massive datasets of examples to learn effectively. Instead, they are initially trained on extensive corpuses of text and code, enabling them to comprehend the statistical relationships between words and generalize to new tasks with only a few examples provided. This training method allows the model to associate user input with the most suitable function by utilizing the given descriptions without additional re-training.

The Function Calling Value

OpenAI released a function calling capability to the GPT-based models allowing them to connect with external tools and APIs. By describing the functions and their arguments, developers can leverage the ability to detect when a function needs to be called based on user input. This opens up numerous possibilities for automation, such as:

1. Virtual assistant with External API Integration: developers can create chatbots that go beyond answering questions. By integrating external APIs and performing actions such as scheduling appointments. For example, a chatbot integrated with a CRM can send personalized emails using a send_email function.

2. Natural Language Processing (NLP) to Fetch Data Sources: it becomes easier to access data sources as part of the chatbot conversation. For example, users can ask questions like “Who are my top customers this month?” and have the system transform the query into a data source through a defined function, like get_customers_by_revenue(start_date, end_date, limit) to receive the desired information in real-time.

3. Automatic Task Delegation: by integrating GPT models with project management tools, users can delegate tasks to team members through natural language commands. For instance, the user say, “Assign Adam to finish the presentation draft by Friday.” The model will identify the related functions to execute the task and return them for execution.

These are a few automation scenarios among countless examples. While it was possible to achieve automation through multiple dependencies and action chaining, the latest GPT update has streamlined the process as part of the ongoing conversation.

Practical Example: AWS S3 Integration

Automation Game-Changer: Exploring GPT Function Call with AWS S3 Integration

To demonstrate the capabilities of OpenAI’s function calling, let’s walk through a practical example involving AWS S3 — a widely used cloud storage service. We will use Python code to interact with S3 and perform various operations through a conversation-driven chatbot. The user input will go through three stages: First the chatbot with the functions context to select the most relevant one. Second, we will extract the specific function and its arguments from the model output in order to execute the intended operation. Finally, the function output will go to a summary model to formalize the responses.

Step 1: Importing Libraries and Setting Up Credentials

Start by importing relevant libraries and setting up the credentials needed for AWS S3 and Openai access.

Replace with code block for Github Gist: https://gist.github.com/Barqawiz/97573f8e25eb3c491953ca2e6ac9d251

Step 2: Defining Functions for S3 Operations

Next, create functions that encapsulate different S3 operations such as listing buckets, listing objects within a bucket, downloading files, uploading files, and search. These functions interact directly with the S3 API and consolidate required parameters.

Replace with code block for Github Gist: https://gist.github.com/Barqawiz/519bb6fc55445c307c1a1e155871f110

It is essential to provide a description dictionary for the model providing each function argument details and requirements with the following fields:

  • name: the exact function name for the model to return it when the conversation trigger a function call.
  • description: string description for the expected action from this function.
  • parameters: a dictionary including all the input properties and whether they are mandatory or not.

Replace with code block for Github Gist: https://gist.github.com/Barqawiz/5f5d6eb48fb0e16e5eefdb846f73610b

Step 3: Implementing the Conversation Flow:

In this step we will design a conversation flow using OpenAI’s chat completions API, where users engage with the chatbot to execute various S3 operations. As users enter commands or ask questions, the chatbot identifies when a suitable function should be called and generates JSON objects conforming to the specified function signatures.

The chat completion function:

Replace with code block for Github Gist: https://gist.github.com/Barqawiz/a4c1977c2167c49093cb3cb908b9c24e

The conversation logic starts by sending the user’s input and the function details to the chatGPT, the model will verify the most suitable function to return or ask the user for extra clarification. When the model return the function and the argument, we will call a dictionary returning a function to execute based on the key name:

Replace with code block for Github Gist: https://gist.github.com/Barqawiz/95a2bd9b1a88c7aa2b60e2c0b3cceb56

For the full s3 bucket automation code check this GitHub repo.

Examples of the function’s chatbot output

Let’s explore the chatbot responses with expectation to clarify the missing information before executing the request action:

user: list my s3 buckets
bot: Here are your S3 buckets along with their creation dates:
1. “bakcup-ahm-test” – Creation Date: 2023-06-172. “elasticbeanstalk-eu-west-1” – Creation Date: 2023-03-173. “illinois-paper” – Creation Date: 2023-06-17
user: search for a file reflections.zip in all buckets
bot: I found the file “reflections.zip” in the following S3 buckets:
1. Bucket: “bakcup-ahm-test”, Last Modified: “2023-06-17T16:05:16+00:00”, Size: 4862255 bytes, Storage Class: STANDARD2. Bucket: “illinois-paper”, Last Modified: “2023-06-17T12:38:24+00:00”, Size: 4862255 bytes, Storage Class: STANDARD
user: search for a file
bot: please provide the name of the file and the name of the S3 bucket?
user: what is the weather today
bot: I am only able to assist with S3 bucket functions.
user: download Reflections.zip from illinois-paper bucket to current directory
bot: I have successfully downloaded the file “Reflections.zip” from the “illinois-paper” bucket.
user: upload ./resource/Reflections.zip to bakcup-ahm-test bucket
bot: The file `Reflections.zip` is successfully uploaded to the bucket.

GPT functions help me manage my s3 bucket tasks without a third-party agent, improving the ability to extract arguments from user messages and call the relevant actions.

Evaluation and Future Directions

During the evaluation, the model identified the appropriate function successfully using the input message’s semantic meaning. Additionally, it was able to avoid responding to off-topic commands or questions. One issue I encountered was that the model occasionally populated arguments with unexpected parameters when the user did not provide a value, despite being instructed not to do so. However, this behavior was infrequent, and in most cases, chatGPT came back with questions when a parameter was missing.

It is crucial to assess the effectiveness of the GPT models function and mitigate any potential risks with it by having a human in the loop “at least at the beginning” before executing the output actions. Prioritizing ongoing research to assess the performance and reliability of function features is imperative before applying it in production. While integrating with external tools and APIs may offer automation benefits, safety must be the priority.

References:

  • OpenAI Functions documentation.
  • Language Models are Few-Shot Learners.
  • Github code repo.

Author

Ahmad Albarqawi – [email protected]

https://www.linkedin.com/in/barqawi/

The benefits of automated data capture  

https://techfalcon.ae/automated-data-capture-and-its-benefits/

Introduction

In this era of digitization, enterprises receive and send many documents daily. One area that often poses challenges to enterprises is the extraction of unstructured data from various documents, such as invoices and purchase orders. Over 80% of data nowadays is unstructured, and unstructured data is projected to grow in 2023 and beyond.

However, this process has been revolutionized with the advent of automated data capture technology, offering businesses many benefits.

Automated data capture different vs. manual entry

Data entry clerks must analyze each document individually and manually enter information into a target system, such as an Excel table.

Nowadays, data extraction software has the power to automate the entire process. Once a document is received, they can automatically parse it, validate stats, and upload the information to the required destination in seconds. Alongside automation, enterprises are embracing intelligent document processing (IDP) solutions. These solutions leverage AI to parse data from documents of various formats and sizes, bypassing the need to create templates for each specific document type.

Enhanced accuracy

Automated data capture technology leverages advanced optical character recognition (OCR) algorithms and machine learning capabilities to extract data from documents accurately. OCR technology can intelligently interpret different fonts, handwriting styles, and even complex layouts, ensuring high accuracy in data extraction. This eliminates the errors that can occur with manual data entry, such as typos, transpositions, and omissions. Businesses can rely on the extracted information for critical processes like financial analysis, inventory management, and decision-making by ensuring data accuracy. The improved accuracy also leads to better compliance with regulatory requirements, reducing the risk of penalties or legal issues.

Increased efficiency

Automated data capture significantly improves efficiency by eliminating manual entry and streamlining document processing workflows. It can process large volumes of documents in a fraction of the time it would take a human operator. Automated systems can extract data from multiple documents simultaneously, reducing processing time and allowing employees to focus on more strategic tasks.

This increased efficiency translates into faster turnaround times, improved customer service, and enhanced operational productivity. It also helps businesses to scale their operations without additional personnel, supporting growth and expansion.

Cost savings

Automating processes brings substantial cost savings to businesses. Manual data entry requires significant human resources, training, and supervision, leading to higher labor costs. Organizations can reduce or eliminate the need for dedicated data entry personnel by adopting automated solutions.

Additionally, the risk of errors and subsequent costs associated with rework and reconciliation is minimized. Automation reduces paper-based processes, lowering printing, storage, and document handling expenses. This cost optimization allows businesses to allocate resources more efficiently and invest in other areas of growth and development.

  1. Improved Data Accessibility and Searchability: Information capture software convert extracted data into a digital format, making it easily accessible and searchable. Digitized data can be stored in structured databases, enabling quick and efficient retrieval based on specific criteria. This enhanced accessibility and searchability empower businesses to easily find and retrieve information, supporting timely decision-making, audits, compliance checks, and data-driven analysis. It also enables seamless collaboration and information sharing across departments and stakeholders, fostering a more connected and efficient work environment. Organizations can extract valuable insights and gain a competitive advantage by unlocking the potential of data assets.
  2. Seamless Integration with Existing Systems: These solutions are designed to seamlessly integrate existing software and systems within an organization. They can easily interface with enterprise resource planning (ERP) systems, customer relationship management (CRM) software, accounting software, and other business applications, ensuring a smooth data flow between different systems and minimizing data entry duplication and errors. It also allows for real-time synchronization, ensuring that data is up to date across various platforms. The seamless integration enhances operational efficiency and data integrity while maximizing the value of existing technology investments. It also simplifies IT management and reduces the need for complex manual data transfers or data import/export processes.
  3. Enhanced Compliance and Security: Modern data capture systems prioritize data security and compliance by implementing robust encryption and access control measures. They adhere to stringent data protection regulations, ensuring the confidentiality and integrity of sensitive information within documents.

Businesses can enforce consistent security protocols and track data access and usage by automating data capture. The enhanced security measures also contribute to building trust with customers, partners, and stakeholders, enhancing the overall reputation and credibility of the organization.

The way forward

In conclusion, automated data capture technology offers businesses a wide range of benefits. Enterprises should look to switch if they are still utilizing manual methods. Even small firms that only receive a few documents daily can benefit from automating data capture.
By leveraging automation, organizations can optimize their document processing workflows, and unlock the value of their data.

Human and AI translations: How to skillfully combine them

Human and AI Translations

In today’s fast-paced world, technology is constantly pushing the boundaries of content translation. The question of whether to rely on AI or human translation services has sparked a lively debate. However, rather than viewing it as an “either-or” situation, a more effective approach is to combine the strengths of both. By leveraging the power of artificial intelligence alongside human expertise, we can enhance translation quality while reducing manual effort. Let’s explore the exciting possibilities that arise from this hybrid approach.

The gains and losses of AI translation tools and human translation services

When comparing machine translation and human translation, it’s essential to consider the advantages and disadvantages of each approach. Let’s delve into the pros and cons of both to determine which option best suits your translation project.

Machine translation advantages

Accuracy

Machine translation systems leverage sophisticated algorithms and machine learning to achieve impressive accuracy levels. They can swiftly process large volumes of text, ensuring consistency and reducing the risk of human error.

Efficiency

Machine translation enables fast turnaround times, making it ideal for time-sensitive projects. The automated nature of AI allows for quick and streamlined translations, saving valuable time and resources.

Cost-effectiveness

With machine translation, the need for manual labor is significantly reduced, leading to cost savings for businesses. It eliminates the need to hire human translators for every project, making it a more affordable option for large-scale translations.

Machine translation disadvantages

Contextual understanding

While AI excels at processing vast amounts of data, it can need help with understanding nuanced contexts and cultural subtleties. It may miss idiomatic expressions, context-specific meanings, and cultural references, resulting in less nuanced translations.

Lack of creativity

Machine translation systems rely on predetermined patterns and algorithms, limiting their ability to provide creative adaptations. Translations produced by AI translation tools may need more artistic touch and finesse that humans bring to the table.

Constant updates

Machine translation models require continuous updates to keep up with evolving languages, terminologies, and linguistic nuances. Staying up-to-date with the updates required for AI translation tools can be a time-consuming process.

AdobeStock_209246973-768×529-1
https://global-translationsuk.com/wp-content/uploads/2021/08/AdobeStock_209246973-1024×705.jpeg

Advantages of using human translators

Linguistic expertise

A human translator deeply understands language nuances, idiomatic expressions, and cultural contexts. They can capture the intended meaning accurately, ensuring high-quality translations that resonate with the target audience.

Cultural sensitivity

Professional translators are well-versed in the cultural aspects of both the source and target languages. A human translator can navigate cultural nuances, adapt the content appropriately, and ensure that the translated material respects cultural sensitivities.

Creative adaptability

A Human translator can bring creativity and adaptability to the translation process, which neural machine translation tools cannot do. Professionals performing human translations can creatively rephrase and convey messages conveyed in written or spoken words, capturing the original content’s tone, style, and voice.

Disadvantages of using human translators

Time-consuming

Human translation is a labor-intensive process that takes time, especially for large projects. The manual effort involved in translating each word and sentence can result in longer turnaround times.

Cost

Hiring human translators can be more expensive, particularly for extensive or ongoing translation needs. The need for skilled professionals adds to the overall project cost.

Subjectivity

Human translations are inherently subjective, as different translators may have varying interpretations and styles. Achieving consistent translations across multiple projects and translators can be challenging.

While exploring the pros and cons of machine translation versus human translation, it is essential to consider the broader scope of language services. Interpreting, for instance, plays a crucial role in facilitating real-time communication. The essential guide to interpreting explains the various modes of interpretation, such as consecutive and simultaneous interpreting, and provides insights into best practices and industry standards.

By considering these pros and cons, you can decide whether to opt for AI translation, human translation, or a hybrid approach that combines the strengths of both methods.

Human and AI Translations
https://pollion.net/wp-content/uploads/2023/04/aivshumen.jpg

Embracing a hybrid approach: combining AI and human translation

Rather than choosing between AI translation and human translation, a compelling alternative is to embrace a hybrid approach that combines the strengths of both methods. This approach recognizes the value of AI technology in terms of speed, efficiency, and cost-effectiveness, while acknowledging the unique expertise and creative adaptability that human translators bring.

In a hybrid model, AI translation is the foundation, leveraging its ability to process large volumes of text and swiftly generate initial translations. This saves valuable time and resources, especially for projects with tight deadlines. The AI system provides a solid translation starting point, ensuring consistency and accuracy.

However, human translators play a vital role in refining and enhancing these initial AI-generated translations. They possess the linguistic expertise and cultural sensitivity required to understand subtle nuances, idiomatic expressions, and contextual complexities. Human translators can ensure that the translated content captures the intended meaning accurately and resonates with the target audience.

Taking a balanced approach, rather than viewing AI translation and human translation as opposing forces, provides a deeper understanding of how much more effective the translation process can be. Translation is fundamentally about managing information, and when dealing with transferring information from one language to another, maximizing productivity becomes paramount.

Quality assurance in hybrid translation: ensuring accurate and refined translations

In hybrid translation projects combining AI and human expertise, quality assurance is critical in delivering accurate and refined translations. While AI technology provides a strong foundation, it is the human touch that fine-tunes and polishes the translations to ensure the highest level of quality. Several strategies and methodologies are employed to maintain rigorous quality control throughout the process.

Proofreading

Proofreading is a fundamental step in quality assurance. Human proofreaders meticulously review the translated content, comparing it with the source text to identify any errors or discrepancies. They focus on grammar, syntax, punctuation, and spelling, ensuring that the final translation adheres to linguistic conventions and is error-free. This human intervention helps catch any inaccuracies that may have been overlooked by the AI translation system.

Editing

Editing is another vital aspect of quality assurance in hybrid translation. Human editors scrutinize the translated text to enhance its clarity, coherence, and readability. They refine sentence structures, adjust word choices, and ensure that the message remains faithful to the source while flowing naturally in the target language. Editors also pay attention to cultural appropriateness, ensuring that the translations align with the norms and sensitivities of the target audience.

Human review

Human review serves as the final quality control checkpoint. Expert linguists with subject matter expertise assess the translations for accuracy, context, and technical precision. They verify that the translated content conveys the intended meaning, captures the nuances of the source text, and remains consistent throughout. This human review ensures that the translations are linguistically accurate, contextually appropriate, and relevant.

In short, quality assurance is a critical pillar in hybrid translation projects. The combination of proofreading, editing, and human review ensures that the AI-generated translations are refined, accurate, and aligned with the desired quality standards. By leveraging the strengths of both AI technology and human expertise, businesses can confidently deliver translations that resonate with their target audience while maintaining linguistic accuracy and precision.

Final thoughts

In the evolving landscape of translation, the hybrid approach that combines AI and human translation emerges as a compelling solution. By harnessing the strengths of both methods, businesses can achieve accurate, refined, and culturally relevant translations while maximizing efficiency and productivity.

Integrating AI technology in translation offers speed, scalability, and cost-effectiveness. AI is a powerful tool for processing large volumes of text and generating initial translations. However, the human touch is indispensable in ensuring linguistic accuracy, cultural sensitivity, and contextual understanding.

Through proofreading, editing, and human review, the hybrid approach refines AI-generated translations, addressing residual errors and enhancing the overall quality. Collaboration and feedback loops between AI systems and human translators contribute to continuous improvement, refining the underlying algorithms and increasing the accuracy of future translations.

As the translation industry advances, the hybrid approach will continue to evolve and adapt. According to the ultimate guide to localization, companies are embracing advanced translation techniques to cater to global audiences and achieve seamless communication across borders. The seamless integration of AI and human translation promises improved efficiency, accuracy, and cultural adaptation. By embracing this hybrid model, businesses can confidently communicate with their global audience, expanding their reach and establishing meaningful connections.

Evolution of the Data Landscape

Co-Author by Srujan and Travis Thompson

The data domain has matured profusely and has come a long way since the advent of thick files in the basement. The journey has been nothing short of fascinating and equally thrilling as the software revolution. The good part is we are right in the middle of the data revolution and have the opportunity to witness it first-hand.

We were staring at completely different problems 5-10 years ago, and today we are staring at a completely new set. Some sprung up as a consequence of the Cambrian explosion of data, and some surprisingly originated as a consequence of the solutions devised to solve the initial problems.

This led to many transitions across a plethora of data stacks and architectures. However, what stood out were three simple yet fundamentally pivoting stacks: The Traditional Data Stack, the Modern Data Stack, and the Data-First Stack. Let’s see how that played out.

Evolutionary Fundamentals: Patterns that Triggered Change in the Data Landscape

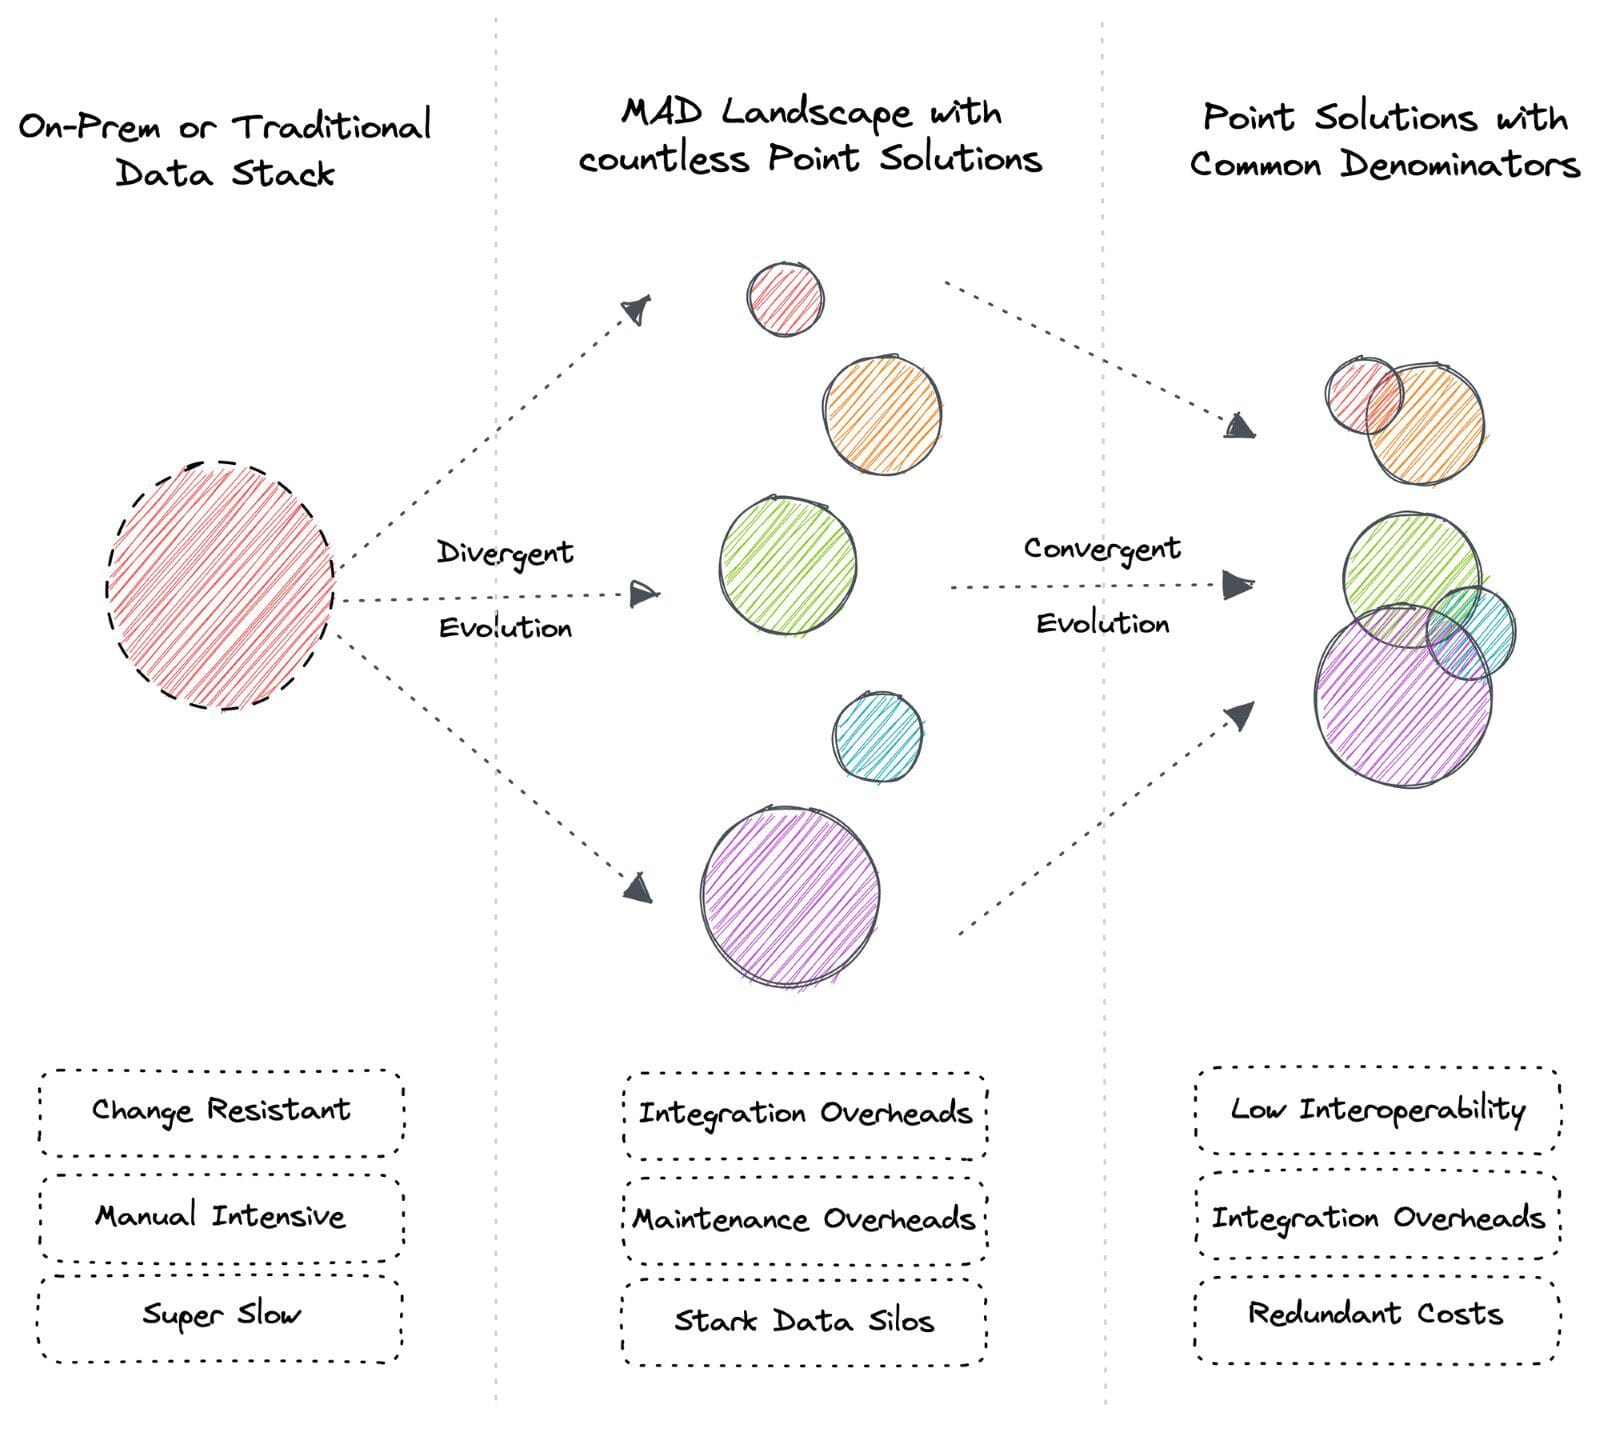
There are two broad patterns of evolution: Divergent and Convergent. These broad patterns apply to the data landscape as well.

Diversity of species on Earth is due to divergent evolution. Similarly, divergent evolution results in a wide range of tools and services in the data industry known as the MAD Landscape today. Convergent evolution creates variants of tools with shared features over time. For instance, both rats and tigers and very different animals, but both have similar features such as whiskers, fur, limbs, and tail.

Convergent evolution results in common denominators across tooling solutions, meaning users pay for redundant capabilities. Divergent evolution results in even higher integration costs and requires experts to understand and maintain each tool's unique philosophy.

Note that common denominators do not mean the point solutions are converging towards a unified solution. Instead, each point is developing solutions that intersect with other solutions by other points based on demand. These common capabilities have separate languages and philosophies and require niche experts.

For example, Immuta and Atlan are data governance and catalog solutions, respectively. However, Immuta is also developing a data catalog, and Atlan is adding governance capabilities. Customers tend to replace secondary capabilities with tools that specialize in them. This results in:

  • Time invested in understanding the language and philosophy of each product
  • Redundant cost of onboarding two tools with similar offerings
  • High resource cost of niche experts; even more challenging since there’s a dearth of good talent
Evolution of the Data Landscape

Now that we have a high-level understanding of evolutionary patterns, let’s look at how they manifest in the data domain. We’ll not go back too far for the sake of brevity.

Rewinding a few Years

The problems we have as a data industry today were starkly different from those 5-6 years ago. The primary challenge that organizations faced during that time was the massive transition from on-prem systems to the cloud. On-prem big data ecosystems and SQL warehouses (or the Traditional Data Stack aka TDS) were not only difficult to maintain with an extremely low uptime but also extremely slow when it came to the length of the data-to-insights journey. In short, scale and efficiency were far out of reach, especially due to the following barriers:

Army of Data Engineers

Any number of data engineers was not enough to maintain in-house systems. Everything from the warehouse and ETL to dashboards and BI workflows had to be engineered in-house, leading to most of the organisation’s resources being spent on building and maintenance instead of revenue-generating activities.

Pipeline Overwhelm

The data pipelines were complicated and interconnected, with many of them created to address new business needs. Sometimes, a new pipeline was necessary to answer a single question or to create a vast number of data warehouse tables from a smaller number of source tables. This complexity could be overwhelming and difficult to manage.

Zero Fault Tolerance

The data was neither safe nor trustworthy without any backup, recovery, or RCA. Data quality and governance were afterthoughts and sometimes even beyond the job description of engineers who toiled beneath the weight of plumbing activities.

Cost of Data Movement

Large data migration among legacy systems was another red flag and ate up huge resources and time. Moreover, it ended up in corrupted data and format issues, which took another bunch of months to solve or were dumped.

Change Resistant

The pipelines in the on-prem systems were highly fragile and, thus, resistant to frequent changes or any change at all, becoming a disaster for dynamic and change-prone data operations and making experiments costly.

Gruelling Pace

Months and years went behind deploying new pipelines to answer generic business questions. Dynamic business requests were out of the question. Not to mention the loss of active business during highly frequent downtimes.

Skill Deficit

High debt or cruft led to resistance in project handoffs due to critical dependencies. The dearth of the right skills in the market didn’t help the case and often led to months of duplicated tracks for critical pipelines.

Solutions at the Time and the Problems as a Result of the Solutions

The Emergence of Cloud and the Obligation to Become Cloud-Native

A decade ago, data was not seen as an asset as much as it is today. Especially since organisations did not have enough of it to leverage as an asset and also because they had to deal with countless issues to generate even one working dashboard. But over time, as processes and organisations became more digital and data-friendly, there was a sudden exponential growth in data generation and capture.

Organisations realised they could improve their processes by understanding historical patterns that were noticeable in volumes larger than their capacity. To address the persistent issues of TDS and empower data applications, multiple point solutions popped up and integrated into a central data lake. We called this combination the Modern Data Stack (MDS). It was undeniably an almost-perfect solution for the problems in the data industry at that point in time.

➡️ Transition to the Modern Data Stack (MDS)

MDS addressed some persistent problems in the data landscape of the time. Its biggest achievement has perhaps been the revolutionary shift to the cloud, which made data not just more accessible but also recoverable. Solutions such as Snowflake, Databricks, and Redshift helped large organisations migrate data to the cloud, pumping up reliability and fault tolerance.

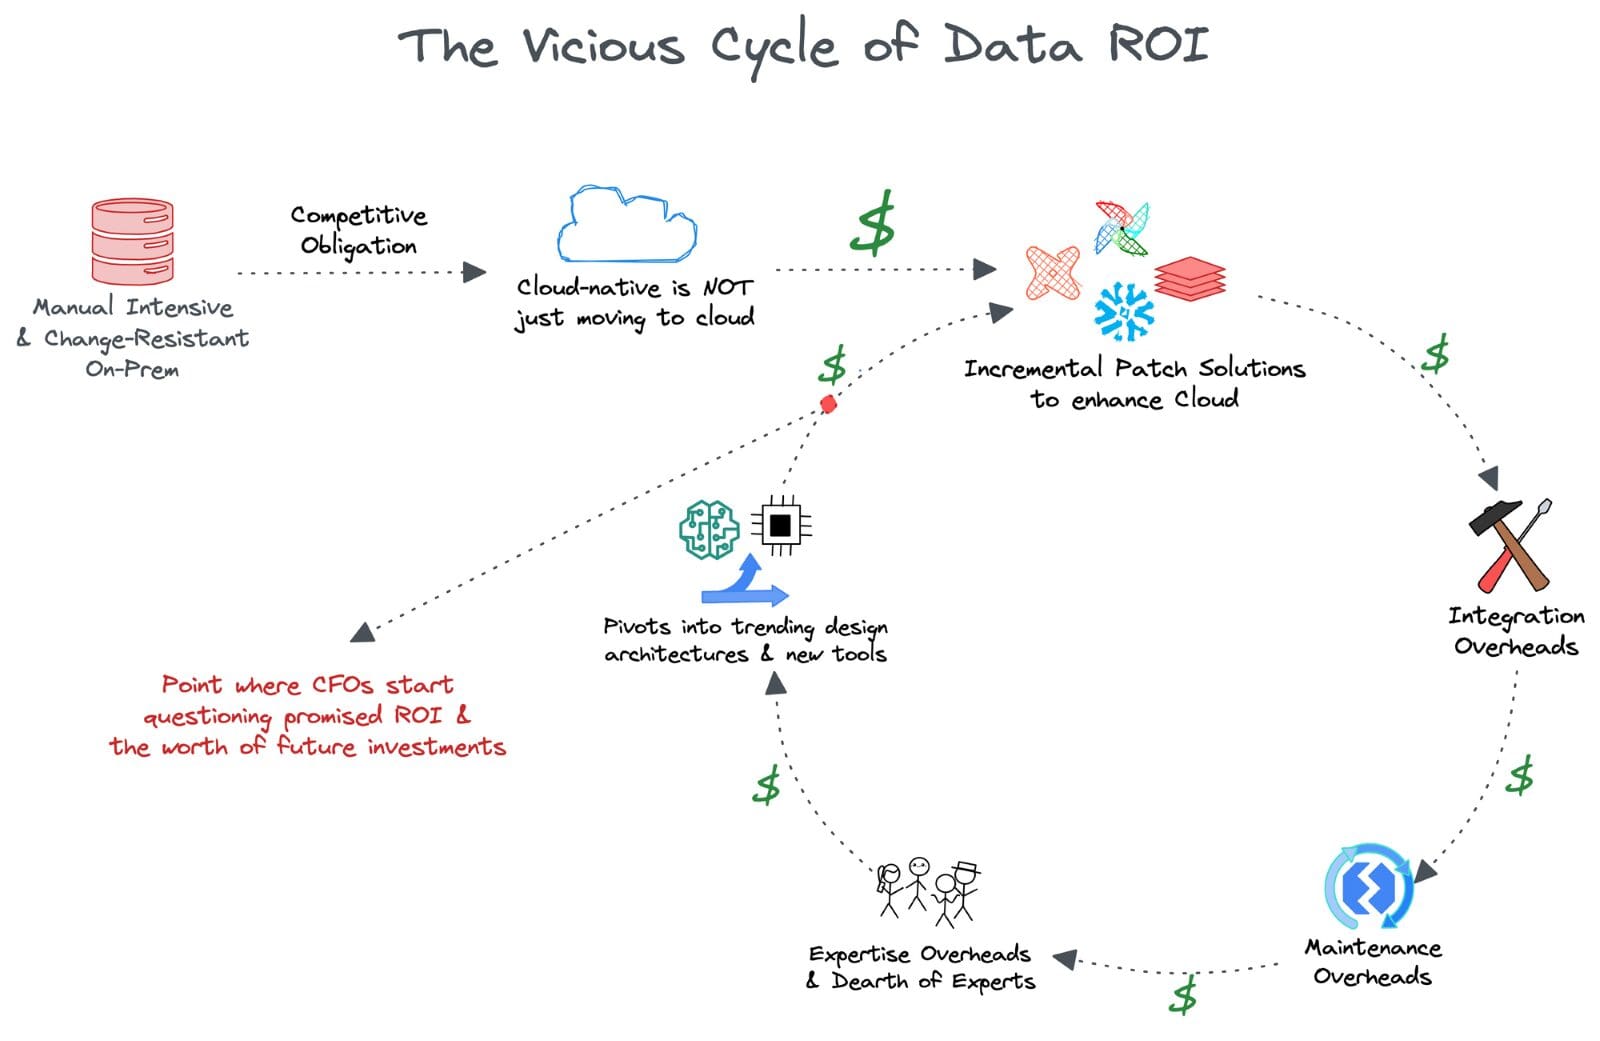
Data leaders who were pro-TDS for various reasons, including budget constraints, felt obligated to move to the cloud and remain competitive after seeing successful transitions in other organizations. This required convincing the CFO to prioritise and invest in the transition, which was accomplished by promising value in the near future.

But becoming cloud-native did not just end in migrating to the cloud, which in itself was a hefty cost. Becoming truly cloud-native also meant integrating a pool of solutions to operationalise the data in the cloud. The plan seemed good, but the MDS ended up dumping all data into a central lake, resulting in unmanageable data swamps across industries.

💰 Investments in Phantom Promises

  • Cost of migrating huge data assets to the cloud
  • Cost of keeping the cloud up and running
  • Cost of individual licences for point solutions required to operationalise the cloud
  • Cost of common or redundant denominators across point solutions
  • Cost of cognitive load and niche expertise to understand varying philosophies of every tool
  • Cost of continuous integration whenever a new tool joins the ecosystem
  • Cost of continuous maintenance of integrations and consequently flooding pipelines
  • Cost of setting up data design infrastructures to operationalise the point solutions
  • Cost of dedicated platform teams to keep the infrastructure up and running
  • Cost of storing, moving, and computation for 100% of the data in data swamps
  • Cost of isolated governance for every point of exposure or integration point
  • Cost of frequent data risks due to multiple points of exposure
  • Cost of de-complexing dependencies during frequent project handoffs

As you can guess, the list is quite far from exhaustive.

🔄 The Vicious Cycle of Data ROI
Evolution of the Data Landscape

Data leaders, including CDOs and CTOs, soon felt the burden of unrealised promises on investments which were at the scale of millions of dollars. Incremental patch solutions created as many problems as they solved, and data teams were back to the fundamental problem of being unable to use the rich data they owned.

The absence of futureproofing was a serious risk for leaders, with their tenure in organizations cut to less than 24 months. To ensure CFOs see returns, they latched onto trending data design architectures and new tooling innovations that unfurled new promises.

At this point, the office of the CFO inevitably started questioning the credibility of the promised results. More dangerously, they started questioning the worth of investing in data-centric verticals themselves. Wouldn’t millions spent on other operations have yielded a much better impact within five years?

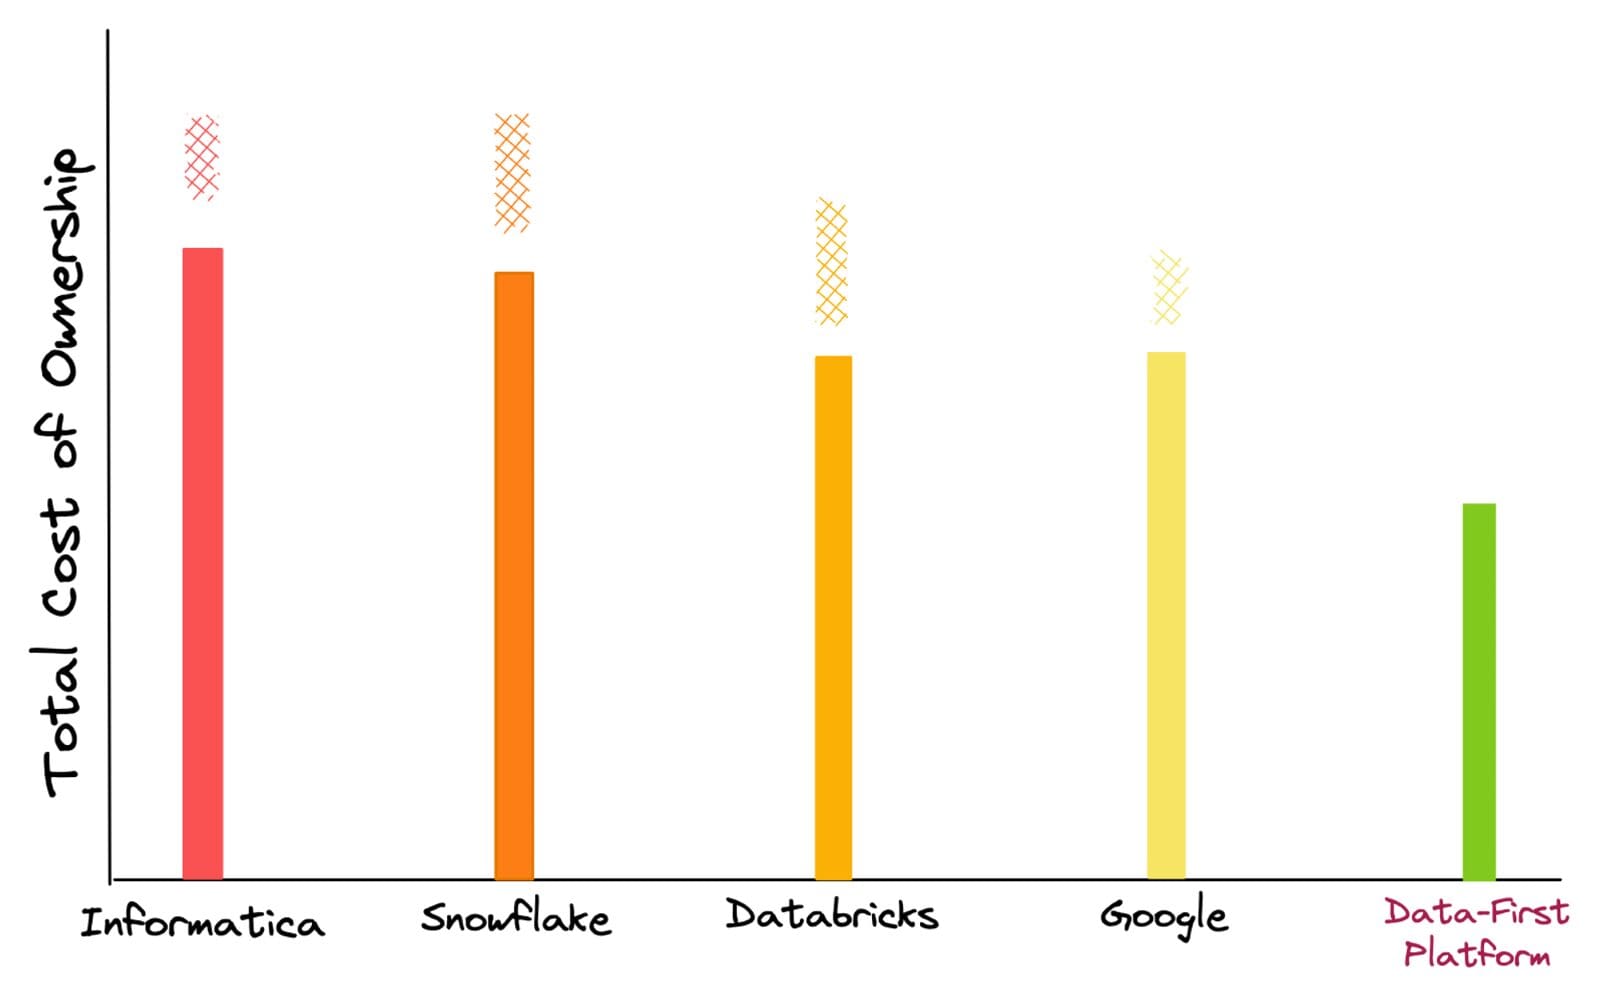
If we look a little deeper and come closer to the actual solutions we discussed above, it will throw more light on how data investments have rusted over the years, especially due to hidden and unexpected costs.

The estimation of TCO is done based on the cost of niche experts, migration, setup, computation for managing a fixed workload, storage, licensing fees, and cumulative cost of point solutions like governance, cataloguing & BI tools. Based on customers' experiences with these vendors, we have added checkered bars at the top as, more often than not, unexpected cost jumps are incurred while using these platforms.
Evolution of the Data Landscape

Due to the versatile nature of these costs, which could be as varied as an increase in workload or background queries to the pricing model itself, they can be best classified as ‘enigmatic costs.’ On the other hand, with a data-first approach that abstracts tooling complexities, there are no unexpected jumps in TCO. There is complete control over Compute provisioned for every Workload & Storage used.

💣 Heavy proliferation of tooling made every stack maintenance-first and data-last.

With abundant tooling, as demonstrated by the MAD Landscape or MDS, it is becoming increasingly difficult for organisations to focus on solution development that actually brings in business results due to consistent attention drawn by maintenance tickets.

Poor data engineers are stuck in a maintenance-first, integration-second, and data-last economy. This involves countless hours spent on solving infrastructure drawbacks and maintaining data pipelines. And the infrastructure required to host and integrate multiple tooling is no less painful.

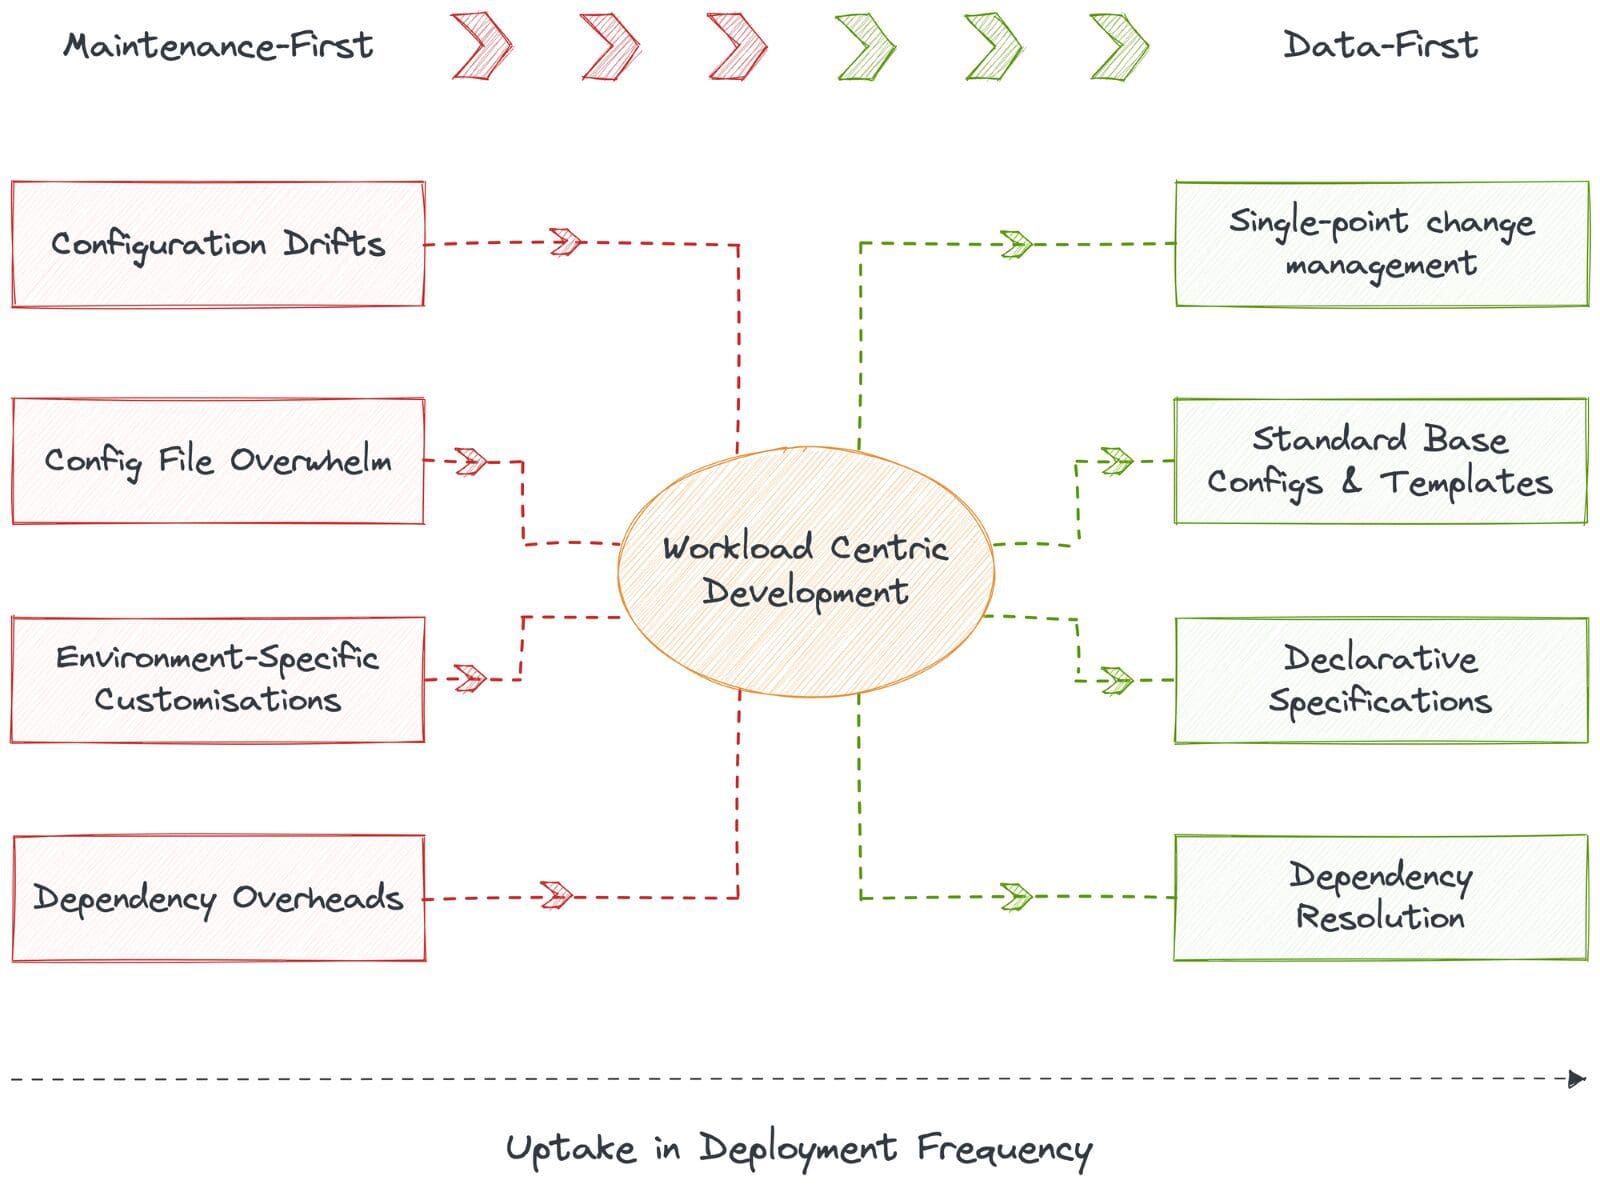
Data engineers are overwhelmed with a vast number of config files, frequent configuration drifts, environment-specific customisations for each file, and countless dependency overheads. In short, data engineers are spending sleepless nights just to ensure the data infra matches the uptime SLOs.

The tooling overwhelm is not just costly in terms of time and effort, but integration and maintenance overheads directly impact the ROI of the engineering teams in terms of literal cost while not enabling any direct improvement for business-driving data applications.

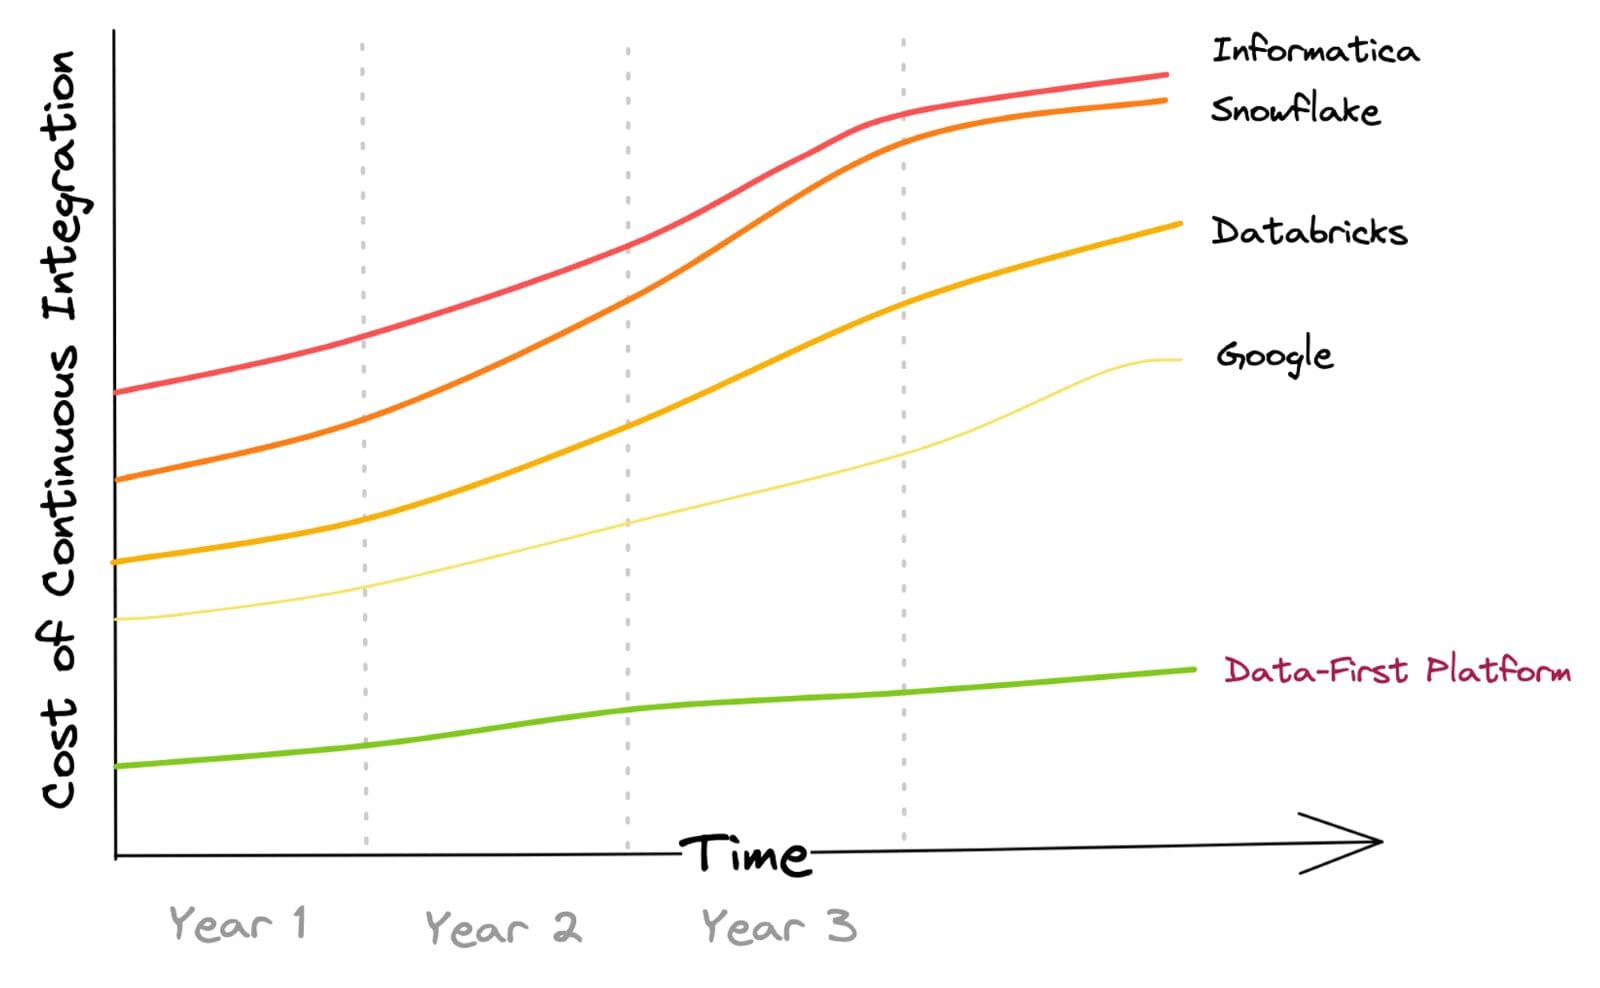
Here’s a representation of enterprise data movement through conventional ETL & ELT methods. It includes the cost of integrating both batch & streaming data sources and the orchestration of data workflows.

The increment in cost over the years is based on the assumption that, with time, the enterprise will increase the platform's usage in terms of the number of source systems integrated and subsequent data processing performed.
Evolution of the Data Landscape

This has been found to be true for most customers across the vendors. In a Data-First approach, the data integration cost is nil to minimal due to its overarching belief in Intelligent Data Movement and abstracted integration management that allows data processing with minimal data movement.

🚧 Organisations are obligated to submit to the philosophy of the tools.

Managing a bundle of different solutions is not the end of it. Organisations are bound to follow these individual tools' pre-defined directions and philosophies. For example, if a Governance tool is onboarded, the data developer learns how to operate the tool, learns the specific ways it talks to other tools, and re-arranges the other tools to match the specifications of the new component.

Every tool has a say in the design architecture as a consequence of its own philosophy, making interoperability much more complex and selective. The lack of flexibility is also a reason behind the high cost of pivoting to new and innovative infrastructure designs, such as meshes and fabrics, that could potentially pump up the promised ROI.

An abundance of tooling with unique philosophies also requires abundant expertise. In practical terms, hiring, training, maintaining, and collaborating with so many data engineers is not possible. More so with the dearth of skilled and experienced professionals in the field.

🧩 Inability to Capture and Operationalise Atomic Insights

Rigid infrastructure, as a result of abundant tooling and integrations, meant low flexibility to tap into and channel atomic data bytes to the right customer-facing endpoints at the right moment. The lack of atomicity is also a result of low interoperability and isolated subsystems that do not have well-established routes to talk to each other.

A good example would be each point tool maintaining its separate metadata engine to operationalise metadata. The metadata engines have separate languages and transmission channels and are hardly able to communicate with each other unless specifically engineered to do so. These newly engineered channels also add to the maintenance tab. Usage data is lost in translation, and parallel verticals are not able to leverage the insights drawn from each other.

Moreover, data operations in the MDS are often developed, committed, and deployed in batches due to the inability to enforce software-like practices across the chaotic spread of MDS. Practically, DataOps is not feasible unless data, the only non-deterministic component of the data stack, is not plugged into a unified tier that could enforce atomic commits, vertical testing along the line of change, and CI/CD principles to eliminate not just data silos but also data code silos.

The Solution that Emerged to Combat the Consequent Problems of MDS

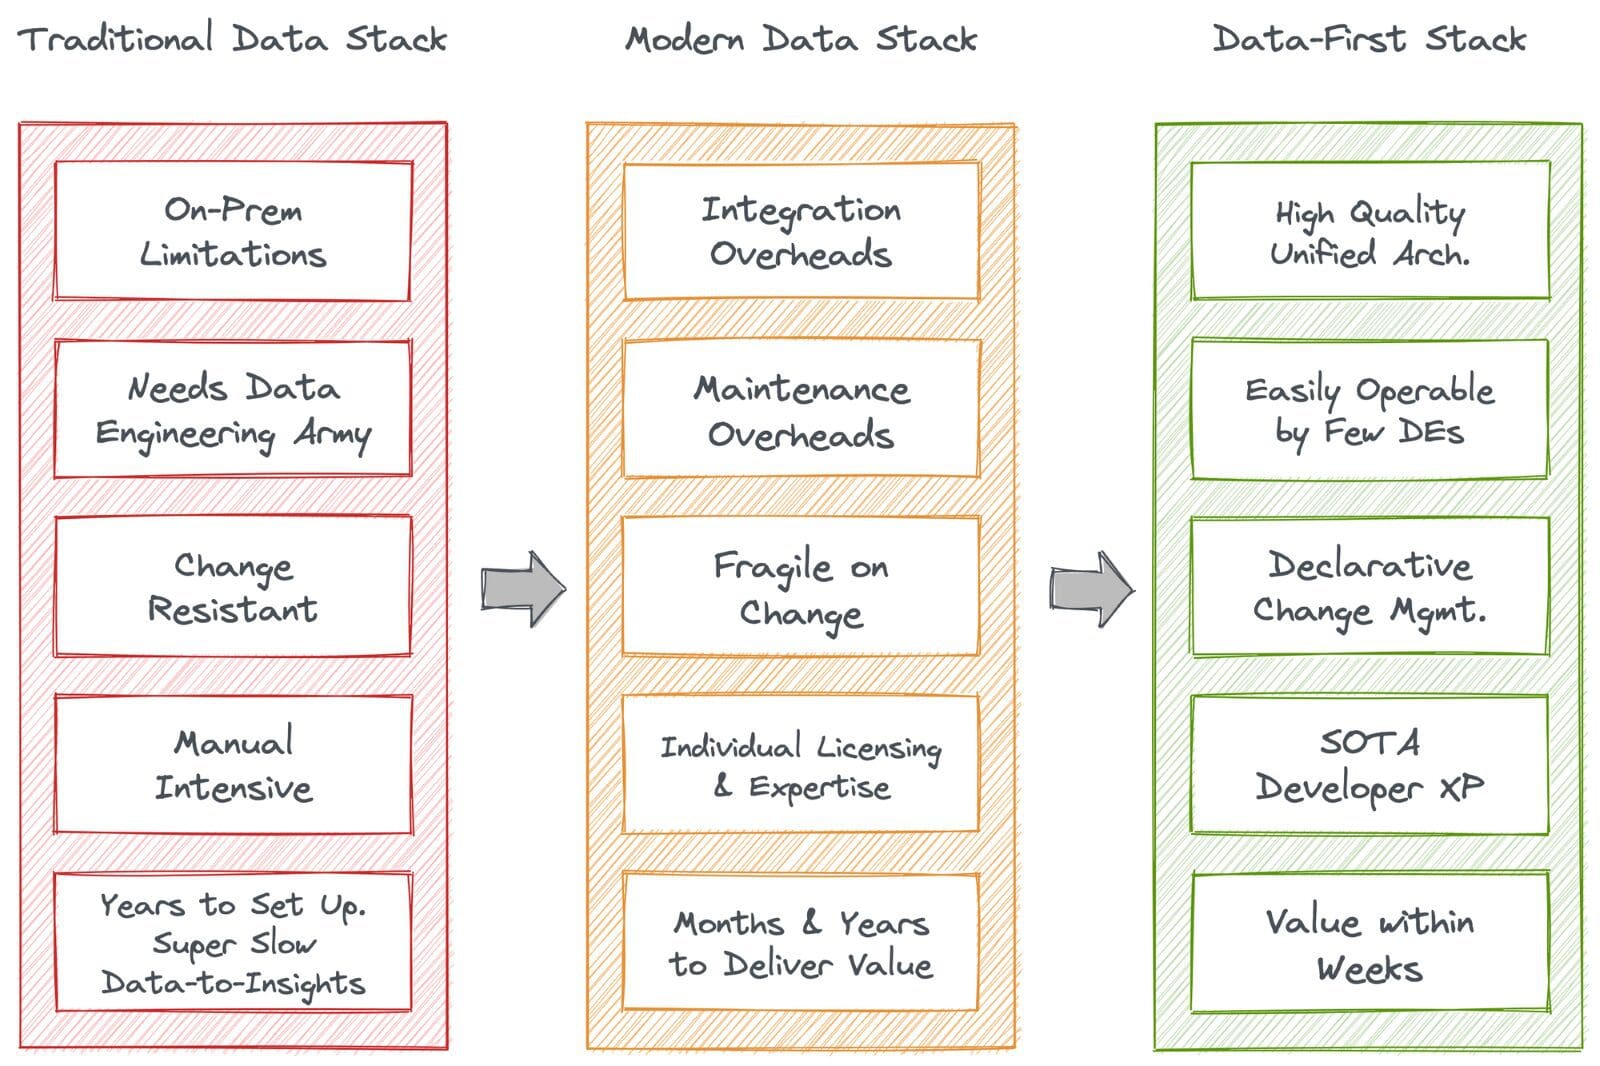
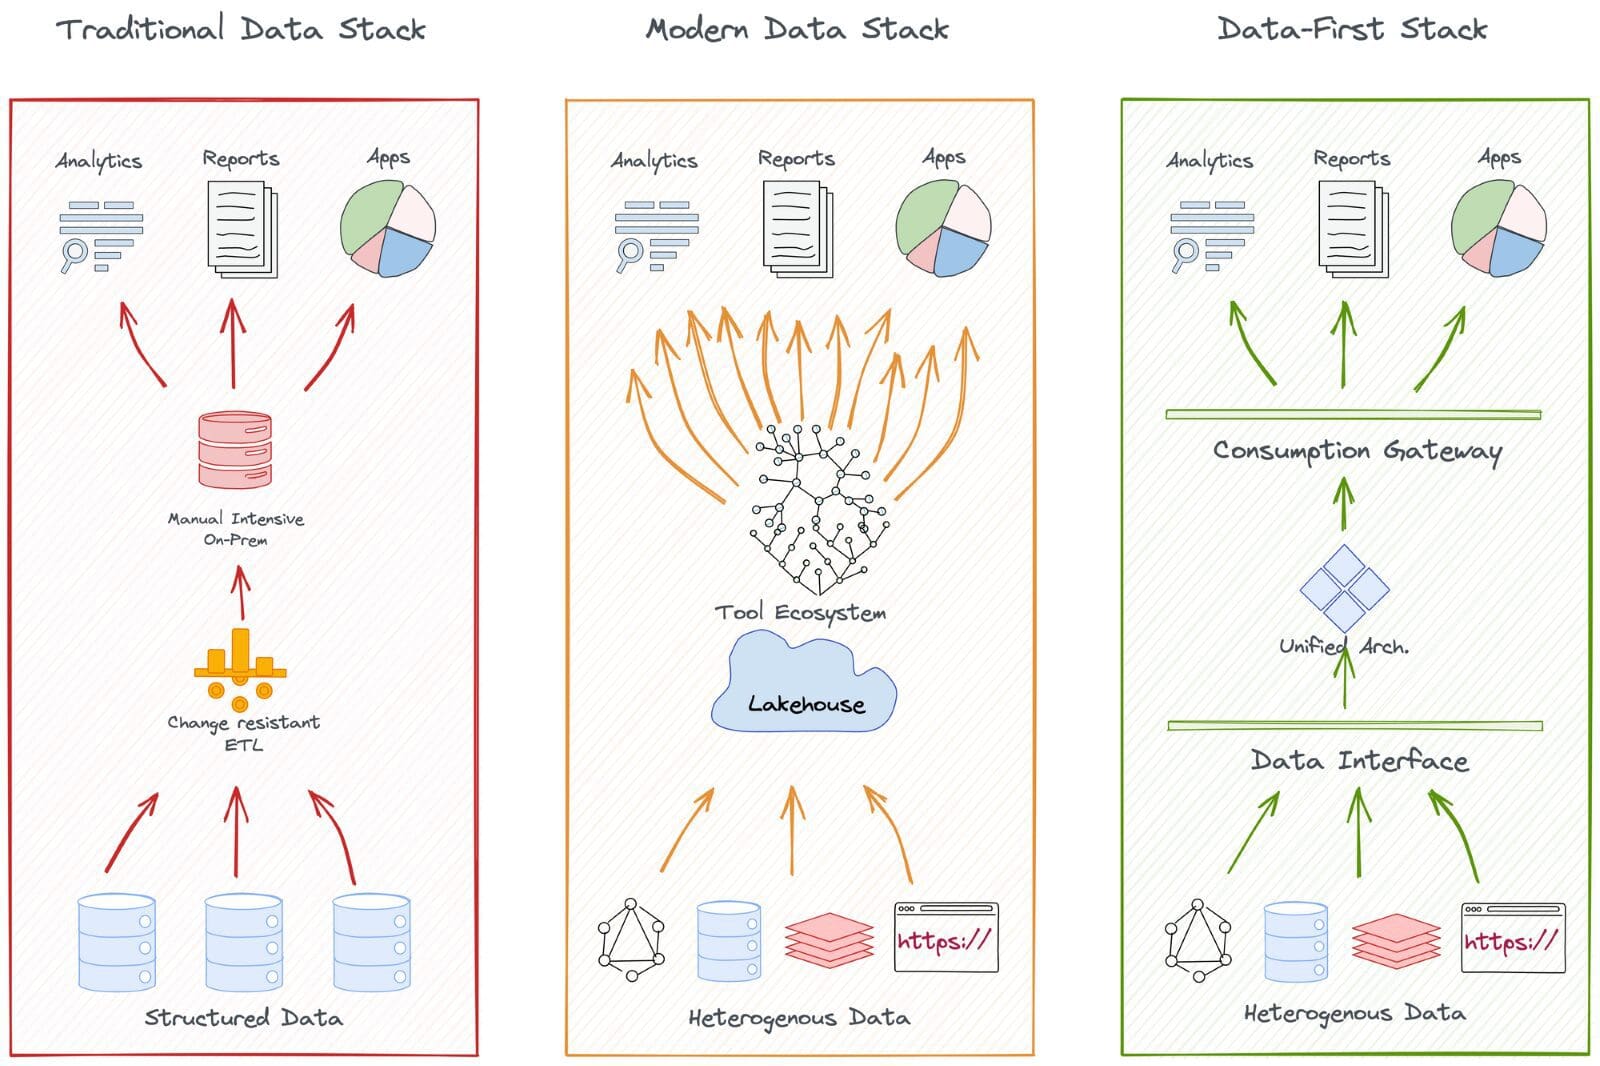
The transition from Traditional Data Stack to Modern Data Stack and then finally to the Data-First Stack (DFS) was largely unavoidable. The requirement for DFS was felt largely due to the overwhelming build-up of cruft (tech debt) within the bounds of data engineering. DFS came up with a unification approach or an umbrella solution that targeted the weak fragments of TDS and MDS as a whole instead of proponing their patchwork philosophy.

DFS brought self-serve capabilities to business teams. They could bring their own compute instead of fighting for IT resources (which is severely limiting business teams’ access to data in many enterprises). Sharing data with partners and monetising it in a compliant manner became easier with DFS. Instead of grinding to integrate hundreds of scattered solutions, users could put data first and focus on the core objectives: Building Data Applications that directly uplift business outcomes.

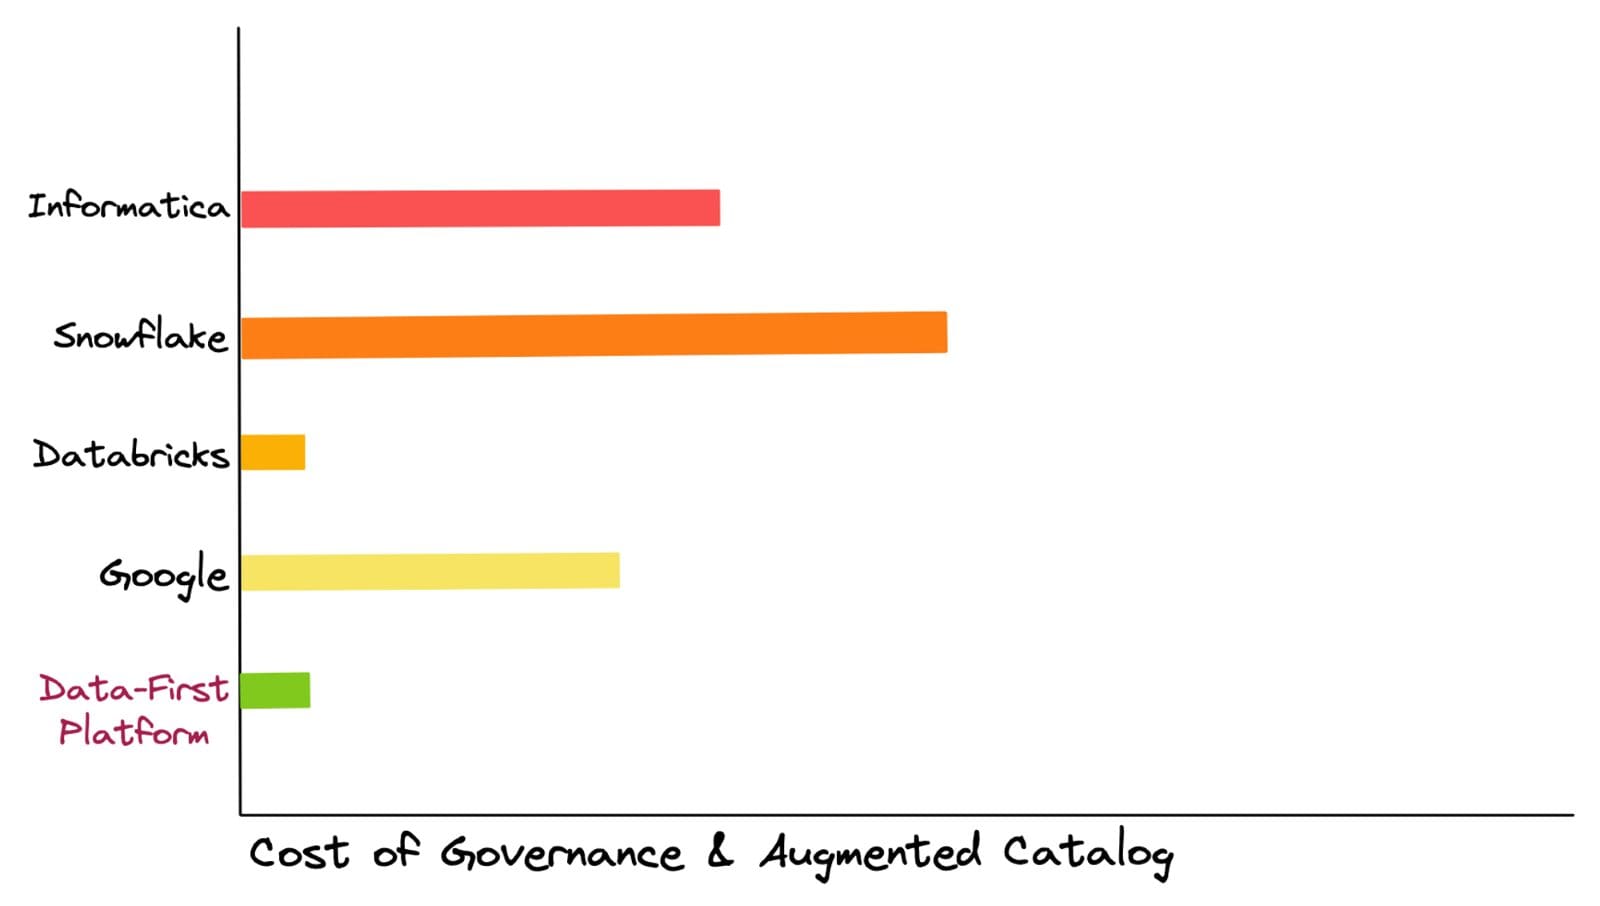
Reducing resource costs is one of the priorities for organisations in the current market, which is nearly impossible since compliance costs are very high when it comes to governing and cataloguing a scattered landscape of multiple point solutions. The unified infrastructure of DFS reduces that by composing these point capabilities into fundamental building blocks and governing those blocks centrally, instantly improving discoverability and transparency.

DFS’ cataloguing solution is comprehensive, as its Data Discoverability & Observability features are embedded with native governance and rich semantic knowledge allowing for active metadata management. On top of it, it enables complete access control over all the applications & services of the data infrastructure.
Evolution of the Data Landscape

The Data-First Stack is essentially an Operating System (OS) which is a program that manages all programs necessary for the end user to have an outcome-driven experience instead of figuring out ‘how’ to run those programs. Most of us have experienced OS on our laptops, phones, and, in fact, on any interface-driven device. We are hooked to these systems because we are abstracted from the pains of booting, maintaining, and running the low-level nuances of day-to-day applications. Instead, we use such applications directly to drive outcomes.
Evolution of the Data Landscape

The Data Operating System (DataOS) is, thus, relevant to both data-savvy and data-naive organizations. In summary, it enables a self-serve data infrastructure by abstracting users from the procedural complexities of applications and declaratively serves the outcomes.
Evolution of the Data Landscape

🥇 Transition from Maintenance-First to Data-First

The Data Operating System (DataOS) is the data stack that puts data first and understands organisations have to be users of data, not builders of data infrastructure. DataOS abstracts all the nuances of low-level data management, which otherwise suck out most of the data developer’s active hours.

A declaratively managed system drastically eliminates the scope of fragility and surfaces RCA lenses on demand, consequently optimising resources and ROI. This enables engineering talent to dedicate their time and resources to data and building data applications that directly impact the business.

Data developers can quickly deploy workloads by eliminating configuration drifts and vast number of config files through standard base configurations that do not require environment-specific variables. The system auto-generates manifest files for apps, enabling CRUD ops, execution, and meta storage on top. In short, DataOS provides workload-centric development where data developers declare workload requirements, and DataOS provides resources and resolves the dependencies. The impact is instantly realised with a visible increase in deployment frequency.
Evolution of the Data Landscape

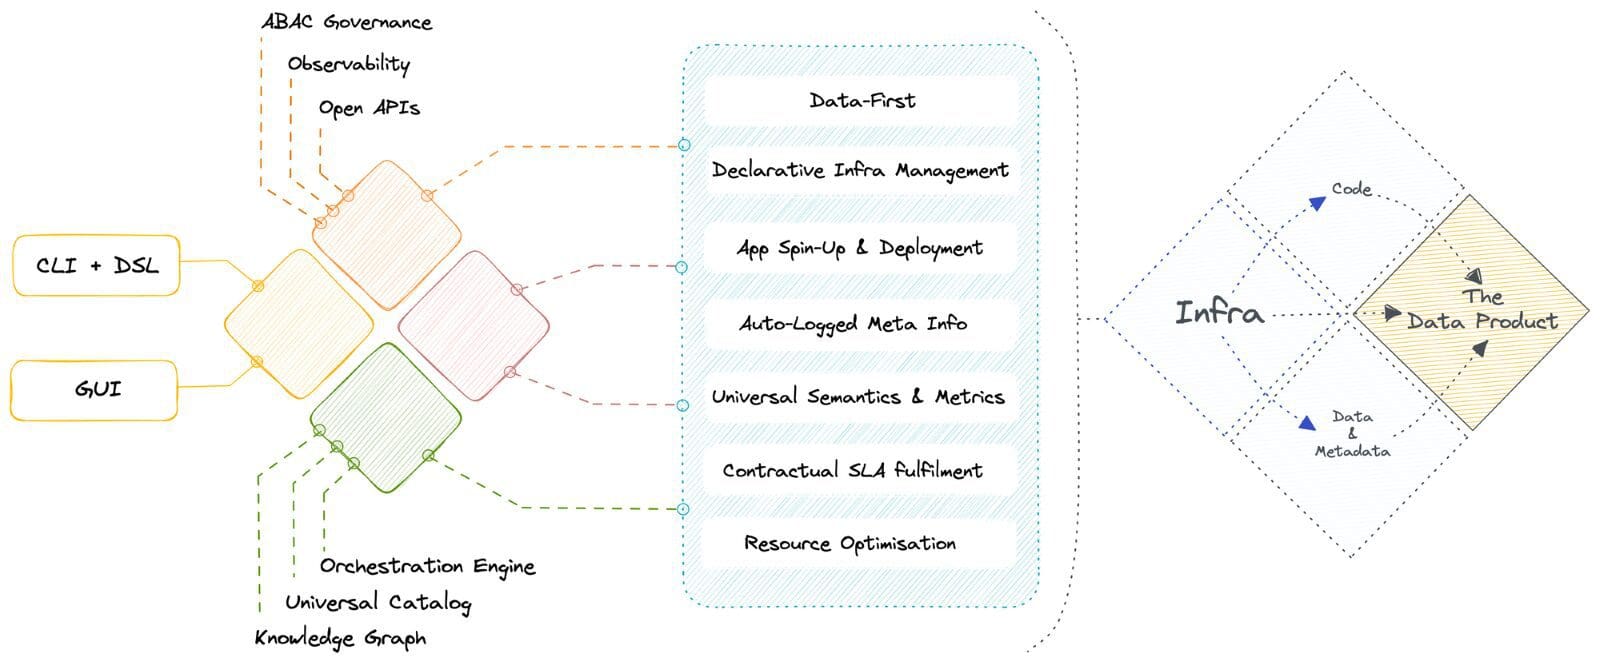
💠 Convergence towards a Unified Architecture
Evolution of the Data Landscape

🧱 Transition from patchwork solutions to primitive building blocks

Becoming data-first within weeks is possible through the high internal quality of the composable Data Operating System architecture: Unification through Modularisation. Modularisation is possible through a finite set of primitives that have been uniquely identified as essential to the data stack in its most fundamental form. These primitives can be specifically arranged to build higher-order components and applications.

They can be treated as artefacts that could be source-controlled and managed using a version control system. Every Primitive can be considered an abstraction that allows you to enumerate specific goals and outcomes in a declarative manner instead of the arduous process of defining ‘how to reach those outcomes.’

🦾 Unifying pre-existing tooling for declarative management

Being artefact-first with open standards, DataOS is used as an architectural layer on top of any existing data infrastructure. It enables it to interact with heterogenous components native and external to DataOS. Thus, organizations can integrate their existing data infrastructure with new and innovative technologies without completely overhauling their existing systems.

It’s a complete self-service interface for developers to declaratively manage resources through APIs and CLI. Business users attain self-service through intuitive GUIs to directly integrate business logic into data models. The GUI interface also allows developers to visualise resource allocation and streamline resource management. This saves significant time and enhances productivity for developers, who can easily manage resources without extensive technical knowledge.

☀️ Central governance, orchestration, and metadata management

DataOS operates on a dual-plane conceptual architecture where the control is forked between one central plane for core global components and one or more data planes for localised operations. The Control plane helps admins govern the data ecosystem through centralised management and control of vertical components.

Users can centrally manage policy-based and purpose-driven access control of various touchpoints in cloud-native environments, with precedence to local ownership, orchestrate data workloads, compute cluster life-cycle management, and version control of DataOS resources, and manage metadata of different types of data assets.

⚛️ Atomic insights for experiential use cases

The industry is rapidly shifting from transactional to experiential use cases. Big bang insights drawn from large blocks of data over long periodic batches are now the secondary requirement. Atomic or byte-sized insights inferred from point data in near-real-time is the new ball game, and customers are more than willing to pay for it.

The common underlying layer of primitives ensures that data is visible across all touchpoints in the unified architecture and can be materialised into any channel through semantic abstractions as and when the business use case demands.

Animesh Kumar is the Chief Technology Officer & Co-Founder @Modern, and a co-creator of the Data Operating System Infrastructure Specification. During his 30+ years in the data engineering space, he has architected engineering solutions for a wide range of A-Players, including NFL, GAP, Verizon, Rediff, Reliance, SGWS, Gensler, TOI, and more.

Srujan is the CEO & Co-Founder @Modern. Over the course of 30 years in data and engineering Srujan has been actively engaged in the community as an entrepreneur, product executive and a business leader with multiple award-winning product launches at organisations like Motorola, TeleNav, Doot and Personagraph.

Travis Thompson (Co-Author): Travis is the Chief Architect of the Data Operating System Infrastructure Specification. Over the course of 30 years in all things data and engineering, he has designed state-of-the-art architectures and solutions for top organisations, the likes of GAP, Iterative, MuleSoft, HP, and more.

More On This Topic

  • Data Engineering Landscape in the AI-Driven World
  • From Oracle to Databases for AI: The Evolution of Data Storage
  • The Evolution From Artificial Intelligence to Machine Learning to Data…
  • The First ML Value Chain Landscape
  • How to Manage Your Complex IT Landscape with AIOps
  • The Future of Work: How AI is Changing the Job Landscape

Samsung SmartThings to use AI to optimize home energy use

SmartThings Energy

SmartThings Energy gives users a glimpse into their whole-home energy consumption.

We need all the savings we can get in times like these, where grocery prices are still high and news of layoffs can't seem to stay off the headlines. A smart home can help save some money — you can rest easy knowing you didn't forget to flick the lights off before bed because Alexa did it for you. SmartThings can help you visualize your home energy consumption in black and white, empowering you to do more than ever with that information.

Now, SmartThings Energy is adding extra features to its platform, including incorporating artificial intelligence to optimize home energy use, a partnership with Electricity Maps to provide energy source insights, support for more commonly-used third-party devices, enhanced automatic response functionality for intelligent device management, and cash rewards and savings during high-energy consumption periods.

Also: The best smart home devices (and how they can make your life easier)

Samsung added AI Energy Mode to its products to get them to use the least energy possible. This helps me intelligently adapt to environments to learn and adjust to temperature changes in a room, to learn to weigh the drum in the washing machine, to detect if the fridge door was left open, and more.

"With energy costs at their peak, it has never been more important to provide users with effective solutions to lower their energy expenses and reduce consumption," said Barry Holland, director of product management at SmartThings Energy.

Also: Can your smart hub do this? Samsung's $59 SmartThings Station innovates where it matters

Because these devices use enhanced systems on select cycles and products to save up to 70% of energy, changes have helped customers use the AI Energy Mode within SmartThings to save over 1.8 GWh in a year, which converts into 1,800,000 kWh, though results can vary.

Samsung SmartThings will also now support many more products on the energy consumption side of the SmartThings app, with more third-party devices now being compatible with SmartThings Energy, giving users a better look at whole-home energy monitoring.

Also: I replaced my phone's weather app with this $340 forecasting station. Here's why

"SmartThings Energy has revolutionized the home energy category, and we are witnessing a growing number of users who are acutely aware of the need for increased savings and control over their energy consumption," according to Holland.

Adding these third-party devices into the SmartThings Energy umbrella expands support beyond Samsung appliances and HVAC systems to let the innovative home platform enable 'Away' mode for devices like smart lights, outlets, and thermostats by automatically turning them off when not in use.

Also: I tested the Tesla Cybertruck of robot mowers — and it's better than I expected

The new updates, which will begin rolling out in the SmartThings app at the end of June, also gamify the energy-saving experience. Users can get rewards for selecting devices they want to participate in the existing Demand Response program.

Instead of consumers manually adjusting devices or setting up automations to participate in these programs, SmartThings Energy will automatically adjust the chosen devices using AI Energy Mode after the new update is rolled out.

Also: Smart home starter pack: 5 devices that will make your life easier

The Demand Response program rewards consumers for reducing their energy consumption during peak energy usage hours. Users can check their zip code after activating SmartThings Energy through the SmartThings app to participate.

Holland explained, "These new features exemplify our unwavering commitment to addressing these critical needs and empowering users with advanced energy management capabilities."

As an example, an average household in New York enrolled in GridRewards through SmartThings Energy could earn up to $100 per year.

Samsung also announced a new partnership with Electricity Maps to provide energy source insights for its customers. This feature visualizes the sources of electricity and associated carbon dioxide emissions, so users can make better-informed decisions to reduce their carbon footprint.

Samsung Unpacked

Protean Partners With ONDC to Enhance Trust in Payments & Settlements on the Platform

Protean eGov Technologies(formerly NSDL e-Governance Infrastructure), has partnered with NPCI Bharat BillPay Limited (NBBL) to enhance trust in payments and settlements on the Open Network for Digital Commerce (ONDC).

In collaboration with NPCI Bharat BillPay Limited (NBBL), Protean launched its Recon & Settlement Product (RSP) on NBBL’s NOCS platform, serving as a Settlement Agency (SA). The RSP is a decentralised settlement framework that enables secure, transparent, and seamless fund settlements on the ONDC platform. The partnership aims to streamline payment settlements and eliminate manual intervention or supervision.

Early adopters of Protean’s RSP on ONDC include various network participants such as Addble, Bizom, Eksecond, Esamuday, GrowthFalcons, Jakkur Technoparks Private Limited, Kotak Bank App, MyStore, ndhgo, nStore, placeorder.com (Rapidor), Bech.app, OrderDe.com (SignCatch), Spice Money, Snapbizz, Uengage, Vanghee, and more.

Protean’s RSP is designed to handle transaction volumes at population scale and offers features like automated rule-driven transaction reconciliation, integrated tax calculations, a comprehensive admin panel and dashboard, exception handling capability, and control reports for operational control and governance.

The launch of Protean’s RSP on NBBL’s NOCS platform would possibly empower network participants to focus on their core business activities while ensuring streamlined, accurate, and hassle-free payment settlements.

This also enhances operational efficiency and strengthens trust in the ONDC network, which ONDC CTO, Mitin Mishra, revealed that they were vouching for, during an interview with AIM.

He explained that with the whole unbundling and interoperability, since there would be no direct contact with a central platform to negotiate between the buyers and sellers, building trust is a challenge.

“In a network mode where the interfaces are becoming, you know, very blurred in a sense that now the seller do not need to know where the product is coming from and buyer do not know where their products are coming from. In this sense, making people understand, and then building trust that this model actually works(is a challenge).” Mishra said.

Protean has been introducing innovative products and interventions on the ONDC network since its inception.

With over 28 years of experience, Protean has played a crucial role in various government initiatives, including the development of PAN cards, the Tax Information Network, the National Pension System, and Aadhaar enrollments.

NBBL aims to redefine trust in payments and settlements on the ONDC by leveraging its technological expertise and the decentralised settlement framework.

Recently, Shiprocket, an e-commerce enablement platform, also announced the integration of its seller app with ONDC. Shiprocket aims to provide a seamless onboarding and post-support experience for sellers on ONDC, offering an additional low-cost demand channel.

The integration aims to generate increased revenue for merchants by onboarding their MSME (Micro, Small, and Medium Enterprises) along with leading brands such as GIVA and Boult Audio onto the ONDC platform.

The post Protean Partners With ONDC to Enhance Trust in Payments & Settlements on the Platform appeared first on Analytics India Magazine.