Nearly 40% of workers think generative AI can help with workplace communication

Woman with sticky notes on her face

You might assume that workers would oppose the implementation of generative AI for fear of losing their jobs. Instead, a new survey shows that workers want it to automate a lot of their tasks, and AI implementation would actually help them stay in their jobs longer.

Humanwork's Human Workplace Index surveyed 1,000 US full-time workers regarding their thoughts on generative AI in the workplace. Over half of the respondents (58.4%) said they did not feel like generative AI put their jobs at risk.

Also: AI's multi-view wave is coming, and it will be powerful

Moreover, the survey found that the workers believe AI will help enhance and expand human communication in the workplace, with 38.5% of workers stating that they are confident that AI will make digital communications easier.

Examples of digital communications in the workplace include Slack messages, emails, other everyday team communication methods, and even performance reviews or feedback delivery, which could easily be replaced by AI-generated text.

In the survey, only half of the workers could distinguish between AI-generated and human messages, showing the potential of AI-automated messages in the workplace. Furthermore, out of the 432 managers surveyed, 40% reported they would use generative AI in their performance reviews.

Also: 40% of workers will have to reskill in the next three years due to AI, says IBM study

The workers also seem confident in the technology's ability to make their work experience better, with 19% of workers saying that AI implementation would make them more likely to stay at their jobs and 32.2% saying that they think it will make their jobs easier, not replace them.

Specifically, some tasks the workers would like to see automated include time management and scheduling (36.4%), drafting/sending emails (33.5%), quick communications (29.7%), accounting (22.7%, shipping/logistics (22.3%), administrative work (21.1%), feedback and performance reviews (19.2%), creative work (19%), hiring and recruiting (17.6%) and manual labor (14.4%).

Also: 4 things Claude AI can do that ChatGPT can't

The tasks at the top of the list are primarily ones that are time-consuming, can be easily automated, and involve interpersonal team communication and collaboration. A workplace where these tasks are AI-automated is closer than you may think.

Already, many productivity platforms such as Slack, Otter.AI, Gmail, and Grammarly are incorporating AI into their platform to provide workers with the capabilities to generate emails and messages, schedule and summarize meetings, and more.

Artificial Intelligence

Privacy and Ethical Hurdles to LLM Adoption Grow

Privacy and Ethical Hurdles to LLM Adoption Grow August 25, 2023 by Alex Woodie

Large language models (LLMs) have dominated the data and AI conversation through the first eight months of 2023, courtesy of the whirlwind that is ChatGPT. Despite the consumer success, few companies have concrete plans to put commercial LLMs into production, with concerns about privacy and ethics leading the way.

A new report released by Predibase this week highlights the surprisingly low adoption rate of commercial LLMs among businesses. For the report, titled “Beyond the Buzz: A Look at Large Language,” Predibase commissioned a survey of 150 executives, data scientists, machine learning engineers, developers, and product managers at large and small companies around the world.

The survey, which you can read about here, found that, while 58% of businesses have started to work with LLMs, many remain in the experimentation phase, and only 23% of respondents had already deployed commercial LLMs or planned to.

Privacy and concerns about sharing data with vendors was cited as the top reason why businesses were not deploying commercial LLMs, followed by expense and a lack of customization.

(Source: Predibase report “Beyond the Buzz: A Look at Large Language”)

“This report highlights the need for the industry to focus on the real opportunities and challenges as opposed to blindly following the hype,” says Piero Molino, co-founder and CEO of Predibase, in a press release.

While few companies have plans to use commercial LLMs like Google’s Bard and OpenAI’s GPT-4, more companies are open to using open source LLMs, such as Llama, Alpaca, and Vicuna, the survey found.

Privacy, or the lack thereof, is a growing concern, particularly when it comes to LLMs, which are trained predominantly on human words. Large tech firms, such as Zoom, have come under fire for their training practices.

Now a new survey by PrivacyHawk has found that trust in big tech firms is at a nadir. The survey of 1,000 Americans, conducted by Propeller Research, found that nearly half of the U.S. population (45%) are “very or extremely concerned about their personal data being exploited, breached, or exposed,” while about 94% are “generally concerned.”

Only about 6% of the survey respondents are not concerned at all about their personal data risk, the company says in its report. However, nearly 90% said they would like to get a “privacy score,” similar to a credit score, that shows how exposed their data is.

More than 3 times as many people are anxious about AI than excited, according to PrivacyHawk’s “Consumer Privacy, Personal Data, & AI Sentiment 2023” report.

“The people have spoken: They want privacy; they demand trusted institutions like banks protect their data; they universally want Congress to pass a national privacy law; and they are concerned about how their personal data could be misused by artificial intelligence,” said Aaron Mendes, CEO and co-founder of PrivacyHawk, in a press release. “Our personal data is core to who we are, and it needs to be protected…”

In addition to privacy, ethical concerns are also providing headwinds to LLM adoption, according to a separate survey released this week by Conversica.

The chatbot developer surveyed 500 business owners, C-suite executives, and senior leadership personnel for its 2023 AI Ethics & Corporate Responsibility Survey. The survey found that while more than 40% of companies had adopted AI-powered services, only 6% have “established clear guidelines for the ethical and responsible use of AI.”

Clearly, there’s a gap between the AI aspirations that companies have versus the steps they have taken to achieve those aspirations. The good news is that, among companies that are further along in their AI implementations, 13% more state they recognize the need for clear guidelines for ethical and responsible AI compared to the survey population as a whole.

(Source: Conversica 2023 AI Ethics & Corporate Responsibility Survey)

“Those already employing AI have seen firsthand the challenges arising from implementation, increasing their recognition of the urgency of policy creation,” the company says in its report. “However, this alignment with the principle does not necessarily equate to implementation, as many companies [have] yet to formalize their policies.”

One in five respondents who have already deployed AI “admitted to limited or no knowledge about their organization’s AI-related policies,” the company says in its report. “Even more disconcerting, 36% of respondents claimed to be only ‘somewhat familiar’ with these concerns. This knowledge gap could hinder informed decision-making and potentially expose businesses to unforeseen risks.”

This article first appeared on sister site Datanami.

Related

About the author: Alex Woodie

Alex Woodie has written about IT as a technology journalist for more than a decade. He brings extensive experience from the IBM midrange marketplace, including topics such as servers, ERP applications, programming, databases, security, high availability, storage, business intelligence, cloud, and mobile enablement. He resides in the San Diego area.

How AI can improve cybersecurity by harnessing diversity, according to Microsoft Security’s Vasu Jakkal

Cybersecurity has long been known for its dark undertones, often dominated by fear-filled narratives of impending doom.

Microsoft's Vasu Jakkal envisions a different reality. In a world where cybersecurity is increasingly integral to all life and business, she sees the potential for a shift from fear to hope, from exclusive to inclusive, and from stagnation to innovation. This shift, she argues, is not just a hopeful aspiration but a necessity.

"We need to change the security narrative from fear-filled dark tones to hope-filled, optimistic, innovative tones for several reasons. First and foremost, security is a prime driver for innovation, and it needs to inspire and empower people… If we don't involve everyone, if we continue to think of security as exclusive and fear-filled, then we are creating barriers to entry for defenders to participate," Jakkal said during a recent interview.

Also: AI's multi-view wave is coming, and it will be powerful

Increasing diversity within the cybersecurity sector is paramount in Jakkal's vision. She sees diversity as the key to unlocking innovative thinking and generating a wider array of defense strategies against cyber threats. Cyber attackers are diverse, and if defenders aren't equally varied in their backgrounds and thinking, they're already a step behind in this ongoing battle.

Jakkal further advocates for the role of artificial intelligence in reshaping the landscape of cybersecurity, considering AI a powerful tool for defenders. With the advent of generative AI, we see a paradigm shift that empowers a broader group of individuals to engage in cybersecurity.

"Through the tools we see in generative AI, English became the most powerful coding language. So now, by nature, you're going to have many more people able to participate in security," Jakkal emphasized.

On the other side of the coin, Jakkal does recognize the potential of AI being wielded by malicious actors. Cyber attackers are not ignorant of the power of AI and will utilize every tool at their disposal. In response to this threat, she argues that the cybersecurity sector must strive to stay a step ahead.

Also: Industrial networks need better security as attacks gain scale

"The attackers are going to have the tools of AI, and they are going to leverage that… we as defenders need to stay ahead of that. And I do believe things like [Microsoft's] Security Copilot and generative AI change the asymmetry of that battle," Jakkal said.

The fusion of AI and diversity in cybersecurity represents a significant shift in the narrative of this field. As we navigate this ever-evolving digital landscape, this combined approach of tapping into diverse talents and AI's potential may be our most effective strategy for staying ahead of the threats. It's time we leave behind the fear-filled rhetoric and step into a more inclusive and innovative future for cybersecurity.

Artificial Intelligence

How to Ace Data Scientist Professional Certificate Exam

How to Ace Data Scientist Professional Certificate Exam
Image by Author

Earning a certification not only validates your skills but also boosts your self-confidence. Moreover, it signals that you are job-ready for a specific role.

For a beginner, it is highly recommended that after finishing a data science boot camp and working on portfolio projects, it is time to get certified. While DataCamp provides end-to-end career development tools that make certification accessible, many people attempting the exams still fail.

In this blog, I will share my experience of taking the certification exam, the certification process, and how any data science beginner or expert can earn certification in less than two days.

What is a Data Scientist Professional Certificate?

Finding qualified data science talent is tough these days. Companies need data experts like you, but there aren't enough folks with the right skills. Earning a certification from DataCamp is a great way to stand out. It shows employers that your skills are job-ready so you can land that dream role.

Currently, you can get certified for as:

  • Data Analyst Associate
  • Data Analyst Professional
  • Data Scientist Associate
  • Data Scientist Professional
  • Data Engineer Associate
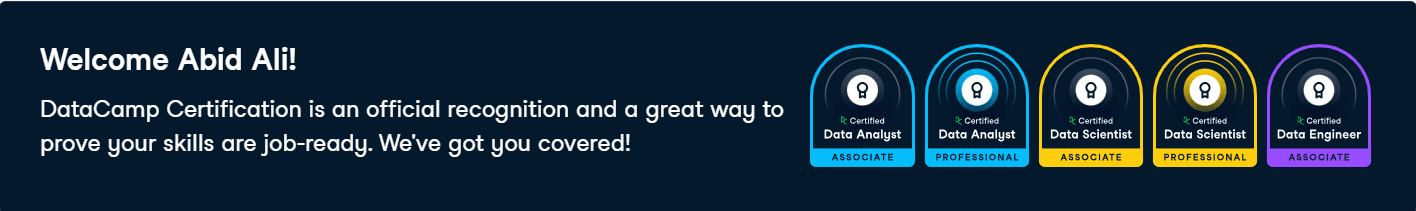
How to Ace Data Scientist Professional Certificate Exam
Image from DataCamp

The Associate certification is ideal for those just starting out and meets entry-level job expectations. The Professional certification, on the other hand, is the next step up and aligns with the skill level expected for roles requiring 2+ years of experience.

In this blog, we will be covering the Professional Data Scientist Certification process.
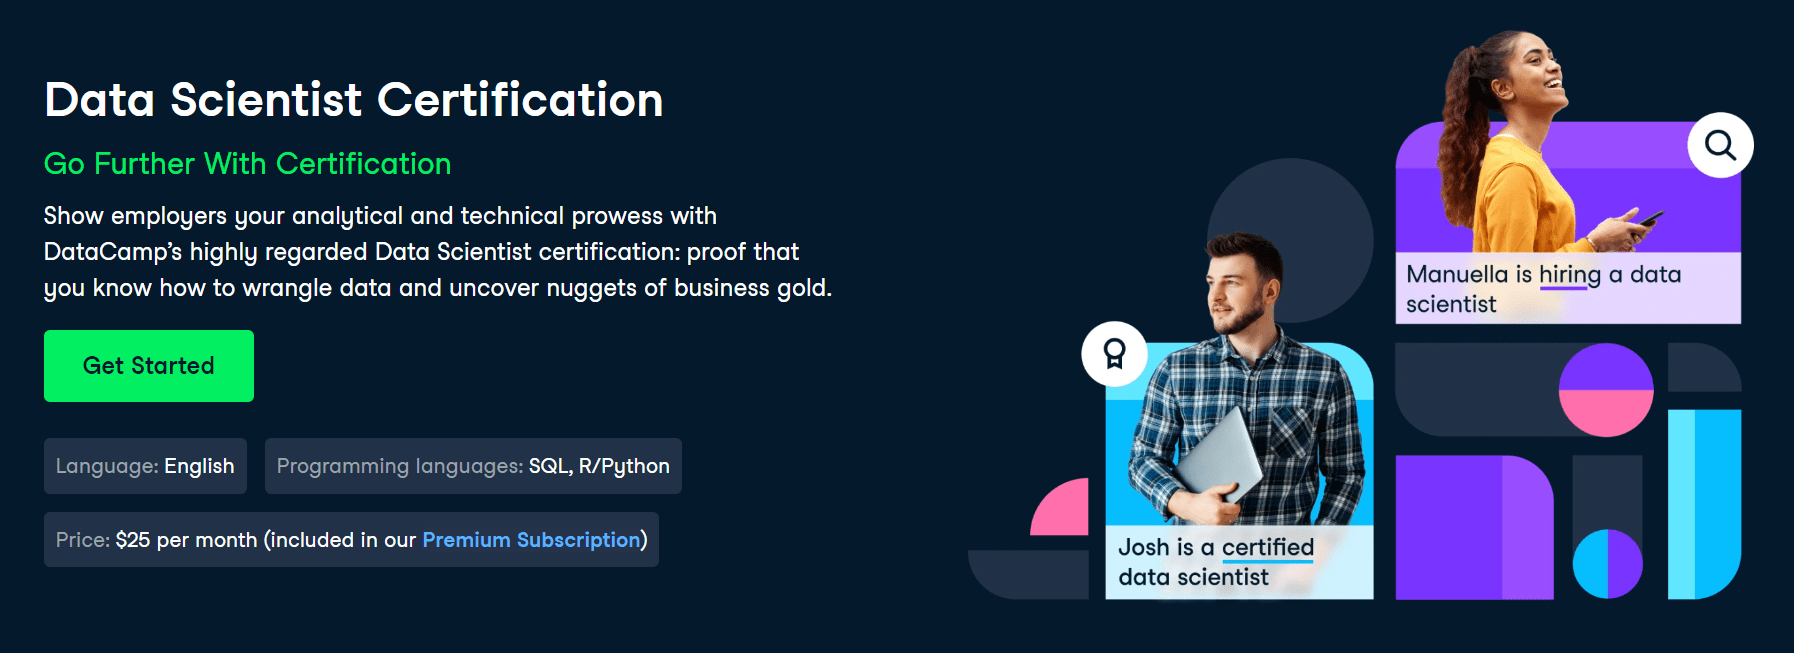
How to Ace Data Scientist Professional Certificate Exam
Image from DataCamp

There is a high demand for data scientists, with thousands of well-paid job openings in the US alone. However, there is a shortage of qualified data professionals. DataCamp's Data Scientist certification can help you get these jobs faster.

Certification Process

The certification process evaluates proficiency across core data science competencies, including exploratory data analysis, data management, statistical modeling, and experimental design. Candidates must demonstrate expert-level fluency in Python or R programming, SQL, communicating analytical insights, and applying these skills to common data science procedures and workflows. The timed and practical certification exams rigorously assess one's readiness to meet the demands of data science roles at the highest level.

How to Ace Data Scientist Professional Certificate Exam
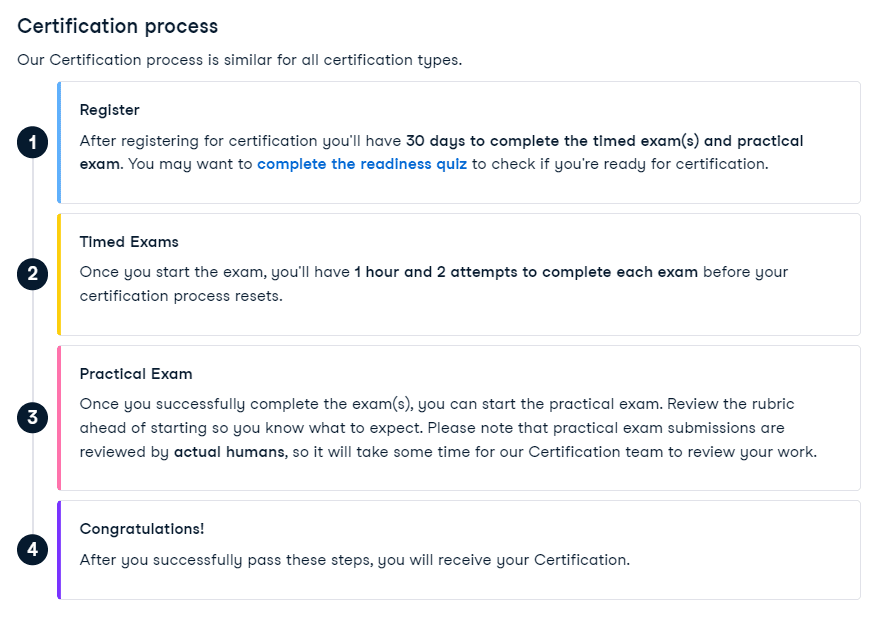
Image from DataCamp certification

What to expect on the timed exams

To earn the Data Scientist Professional Certificate, you must pass two timed exams — DS101 and DS201 — to advance through the practical exam stages.

DS101

The DS101 exam is a 45-minute R or Python assessment of exploratory analysis and statistical experimentation skills including calculating metrics, creating visualizations to demonstrate data characteristics and feature relationships, describing statistical concepts for testing and experimentation, applying sampling methods, and implementing statistical tests.

DS201

The 60-minute DS201 exam evaluates data management in SQL, data cleaning and preparation in Python or R, modeling skills, model evaluation, unsupervised learning, and programming best practices including version control and package building.

What to expect on the practical exam

The practical exam evaluates data visualization and communication skills by having you review a business problem, select and create visualizations, and present a summary of findings; it requires recording and submitting a presentation demonstrating the ability to effectively visualize, frame, convey, and summarize data stories to diverse audiences including business leaders. You can find more information on how DataCamp grades the Data Scientist. To learn about how DataCamp evaluates the data scientist practical exam, you can refer to the rubric for more details.

Tips and Trick for Timed Exam

1. Take Assessment Tests

Before registering for the professional certification exam, I recommend taking as many practice assessment tests as possible. These assessments provide scores and solutions for incorrect answers. Practicing with the timed assessment tests will help you become familiar with the exam format and better manage your time. Going through the practice tests is also an opportunity to learn new concepts and sharpen your skills, setting you up for success on the actual certification exam.

How to Ace Data Scientist Professional Certificate Exam
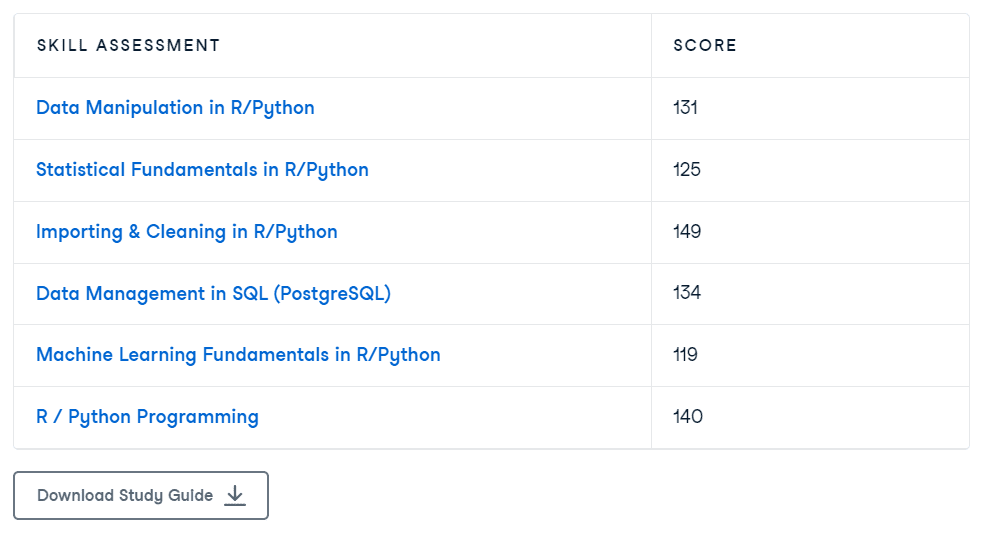
Skill assessment tests

2. Review the Study Guide

Download the Data Scientist Certification Study Guide Data Scientist Certification Study Guide and thoroughly review each objective you must meet for the competencies assessed. The guide provides helpful links to relevant practice assessments for each competency.

3. Take a Short Course

I found statistical tests and SQL data management to be my weaker areas. To address this, I took a few small courses and revisited the forgotten concepts. I highly recommend taking courses to review these concepts, especially if you don't use these tools or concepts in your day-to-day work life.

4. Trust the Process

DataCamp certification offers a wide range of resources, such as assessment tests, study guides, courses, and demos. If you do not pass the certification on your first attempt, you are allowed to retake it once. However, if you do not pass on your second attempt, it is recommended that you wait for two months and work on your weaknesses. You will receive a comprehensive performance report to help you improve.

Tips and Trick for Practical Exam

1. Complete Two End-to-End Data Science Projects

Complete one regression and one classification project using datasets from Kaggle. For each project, work through the data science pipeline including exploratory data analysis, data cleaning, visualizations, feature engineering, model selection, training, and evaluation. Following the full process from start to finish for both a regression and classification problem will help ensure you are on track and build the skills needed to achieve your certification goal. You can also give a try to a clustering project.

2. Take a Sample Practical Exam

Read the project description for the sample exam and ensure that you understand what the head of data expects from you. You will learn a lot by reviewing the sample exam description, solution notebook, and video recording of the presentation.

How to Ace Data Scientist Professional Certificate Exam
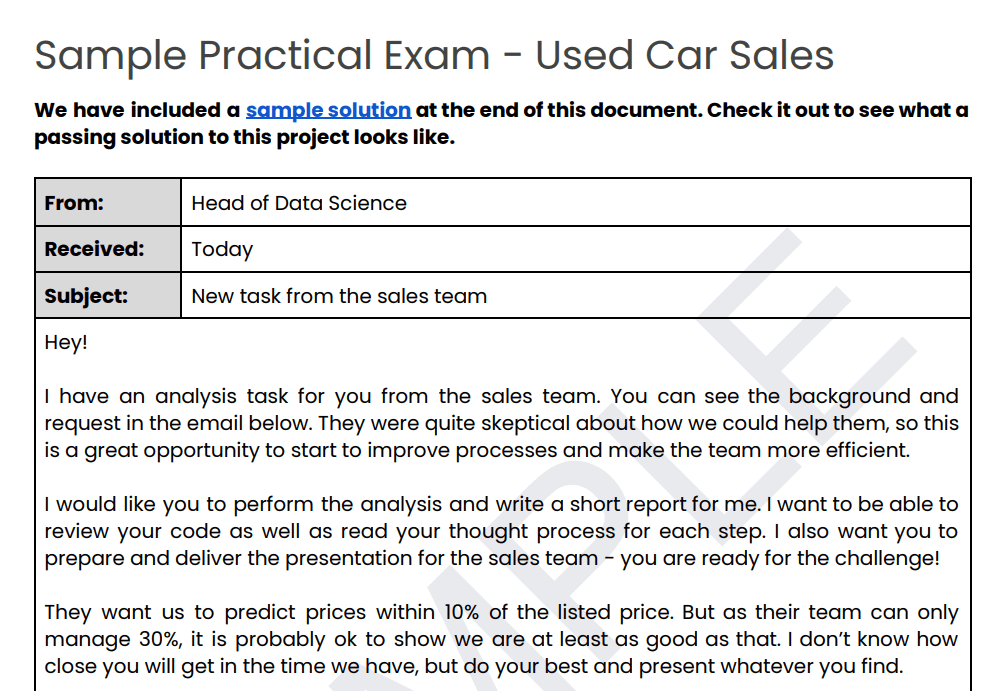
Sample practical exam

3. Learn from the Experts

When working on a practical exam, look for similar projects on Kaggle, GitHub, or Medium. It will help you understand the necessary steps and popular tools for performing specific tasks. If you encounter difficulties, conduct a Google search to find a solution.

I do not recommend copying and pasting code from Kaggle or other sources. The reviewers will likely detect plagiarized work and result in exam failure. Additionally, in real work scenarios, managers can easily identify copied.

When reviewing other experts' solutions, thoroughly read the explanation. Doing so will aid in composing the results of experiments, analytical reports, and conclusions.

4. Presentation

I used Canva to create my presentation, but various tools are available to create one. Here is a list of steps you can follow to develop and present your project outcomes:

  1. Use a maximum of 3 lines per slide to avoid overcrowding.
  2. Explain results in your own words rather than reading directly from slides.
  3. Include relevant visualizations and images from your project.
  4. Avoid technical jargon as the audience is non-technical.
  5. Limit presentation to 10 slides and 8 minutes maximum.
  6. Practice your presentation at least 3 times before recording.
  7. Watch your recorded presentation and re-record if you feel improvements could be made.

What’s Next?

After earning certification, enhance your portfolio and profiles by highlighting your accomplishments. Share your certification on LinkedIn and showcase it on GitHub, Deepnote, DataCamp, DagsHub, and other platforms to strengthen your data science portfolio.

How to Ace Data Scientist Professional Certificate Exam
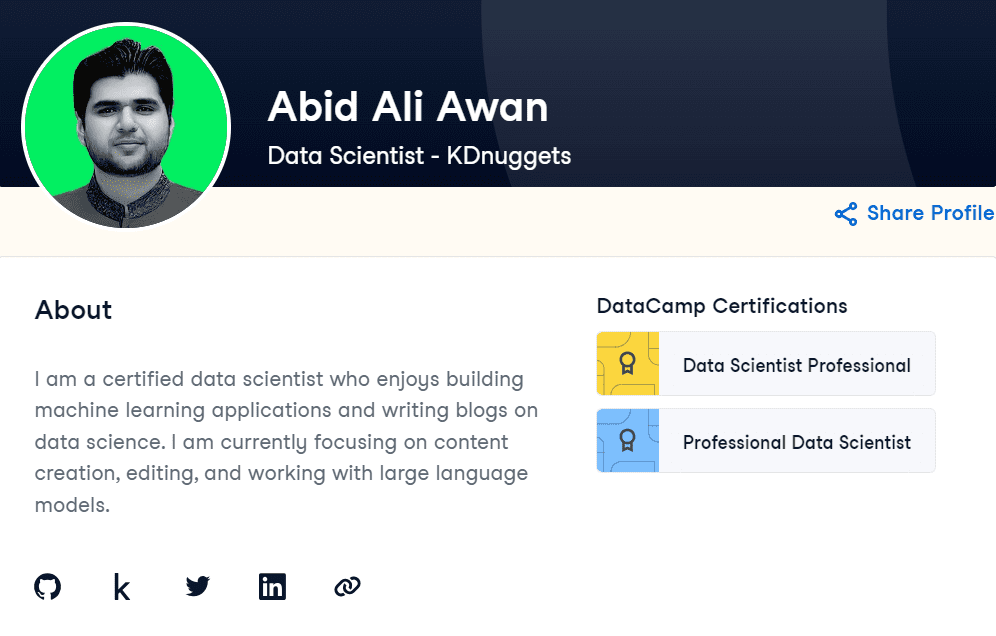
Image from author’s profile

If you are job searching, continue applying on job boards while working on data science projects to showcase your skills. Developing projects demonstrate hands-on experience that will increase your visibility to recruiters and help them better understand your capabilities.

Join the DataCamp certified community and networking groups on Discord and Slack to connect with others in the field. Use these communities to seek mentoring opportunities that can help in your job search. Remember, finding a full-time role should now be your priority, so dedicate sufficient time to the search process.
Abid Ali Awan (@1abidaliawan) is a certified data scientist professional who loves building machine learning models. Currently, he is focusing on content creation and writing technical blogs on machine learning and data science technologies. Abid holds a Master's degree in Technology Management and a bachelor's degree in Telecommunication Engineering. His vision is to build an AI product using a graph neural network for students struggling with mental illness.

More On This Topic

  • Start a Career in a Growing Field with Google’s Data Analytics Professional…
  • How I 14Xed my salary in 14 years as a data analytics/science professional
  • Become a Data Science Professional in Five Steps
  • Top 5 NLP Cheat Sheets for Beginners to Professional
  • Machine Learning for Cybersecurity Certificate at U. of Chicago
  • How to ace A/B Testing Data Science Interviews

Meta Unveils New Coding Tool Code Llama

Meta has taken a bold step forward in the world of coding with its latest offering, Code Llama. This breakthrough large language model (LLM) promises to redefine the way we approach coding tasks. Here's a deep dive into what Code Llama brings to the table.

Revolutionizing Code Generation

Code Llama is not just any LLM. It stands as the pinnacle for publicly available LLMs geared towards coding tasks. Its advanced capabilities, like generating and discussing code through text prompts, can transform developers' workflows. By making processes more streamlined, it not only enhances efficiency for experienced developers but also simplifies coding for beginners.

Built on the robust foundation of Llama 2, Code Llama is its advanced, code-specialized variant. This enhancement was achieved by intensively training Llama 2 on code-specific datasets. What makes Code Llama truly special is its dexterity in generating code and its ability to hold natural language conversations about the code. This means, whether you're giving it code prompts or asking in plain English, like “Design a function for the Fibonacci sequence”, Code Llama can handle it all.

Multi-Lingual Code Support

Programmers will be delighted to know that Code Llama isn't restricted to a single programming language. It encompasses a myriad of popular languages such as Python, C++, Java, C#, PHP, Typescript (Javascript), Bash, and many more.

Diverse Models for Diverse Needs

Meta is releasing three distinct sizes of Code Llama: 7B, 13B, and the colossal 34B. These are trained with a whopping 500B tokens of code-related data. Interestingly, the 7B and 13B versions come with fill-in-the-middle (FIM) capabilities, an essential feature for tasks like real-time code completion.

Each model has its unique advantages. While the 34B version promises superior results, the 7B and 13B models are designed for tasks demanding low latency.

Specialized Variants: Python & Instruct

To cater to Python's popularity and significance in the AI community, Meta has unveiled Code Llama – Python, a version fine-tuned with 100B tokens of Python code. Meanwhile, Code Llama – Instruct is designed to offer a more intuitive experience, better understanding user prompts to deliver safer and more useful responses.

The Ultimate Aim

The essence of introducing LLMs like Code Llama is to elevate developers' workflows. Instead of developers getting bogged down with repetitive coding tasks, such models can handle the heavy lifting, allowing them to channel their creativity and expertise towards more innovative aspects of their work.

Meta firmly believes in the power of open-source AI. By making models like Code Llama publicly available, it aims to foster innovation and address safety concerns collectively. The idea is to empower the community to understand, evaluate, and fine-tune these tools, thereby driving technological advancements that can have a positive impact on society.

While Code Llama is a potent tool for software engineers spanning various sectors – from research and industry to NGOs and businesses – its potential applications are vast. Meta envisions a future where the community, inspired by Code Llama, leverages Llama 2 to create a slew of innovative tools beneficial for both research and commercial ventures.

Code Llama marks a significant stride in the fusion of AI and coding. It's not just a tool, but a testament to the limitless possibilities that can arise when AI is used to complement and augment human capabilities.

AI’s multi-view wave is coming, and it will be powerful

dall-e-2023-08-24-22-36-09-framed-portraits-of-multiple-views-of-an-apple.png

The so-called multi-view is a way of linking two different signals by considering the information they share about the same object despite differences. Multi-view may open a path to machines that can have a richer sense of the structure of the world, perhaps contributing to the goal of machines that can "reason" and "plan."

Artificial intelligence in its most successful form — things like ChatGPT or DeepMind's AlphaFold to predict proteins — has been trapped in one conspicuously narrow dimension: The AI sees things from only one side, as a word, as an image, as a coordinate in space — as any type of data, but only one at a time.

In very short order, neural networks are about to expand dramatically with a fusion of data forms that will look at life from many sides. It's an important development, for it may give neural networks greater grounding in the ways that the world coheres, the ways that things hold together, which could be an important stage in the movement toward programs that can one day perform what you would call "reasoning" and "planning" about the world.

Also: Meta unveils 'Seamless' speech-to-speech translator

The coming wave of multi-sided data has its roots in years of study by machine learning scientists, and generally goes by the name of "multi-view," or, alternately, data fusion. There's even an academic journal dedicated to the topic, called Information Fusion, published by scholarly publishing giant Elsevier.

Data fusion's profound idea is that anything in the world one is trying to examine has many sides to it at once. A web page, for example, has both the text you see with the naked eye, and the anchor text that links to that page, or even a third thing, the underlying HTML and CSS code that is the structure of the page.

An image of a person can have both a label for the person's name, and also the pixels of the image. A video has a frame of video but also the audio clip accompanying that frame.

Today's AI programs treat such varying data as separate pieces of information about the world, with little to no connection between them. Even when neural nets handle multiple kinds of data, such as text and audio, the most they do is process those data sets simultaneously — they don't explicitly link multiple kinds of data with an understanding that they are views of the same object.

For example, Meta Properties — owner of Facebook, Instagram, and WhatsApp — on Tuesday unveiled its latest effort in machine translation, a tour de force in using multiple modalities of data. The program, SeamlessM4T, is trained on both speech data and text data at the same time, and can generate both text and audio for any task.

But SeamlessM4T doesn't perceive each unit of each signal as a facet of the same object.

Also: Meta's AI image generator says language may be all you need

That fractured view of things is beginning to change. In a paper published recently by New York University assistant professor and faculty fellow Ravid Shwartz-Ziv, and Meta's chief AI scientist, Yann LeCun, the duo discuss the goal of using multi-view to enrich deep learning neural networks by representing objects from multiple perspectives.

Objects are fractured into unrelated signals in today's deep neural networks. The coming wave of multi-modality, employing images plus sounds plus text plus point clouds, graph networks, and many other kinds of signals, may begin to put together a richer model of the structure of things.

In the highly technical, and rather theoretical paper, posted on the arXiv pre-print server in April, Shwartz-Ziv and LeCun write that "the success of deep learning in various application domains has led to a growing interest in deep multiview methods, which have shown promising results."

Multi-view is heading toward a moment of destiny, as today's increasingly large neural networks — such as SeamlessM4T — take on more and more modalities, known as "multi-modal" AI.

Also: The best AI chatbots of 2023: ChatGPT and alternatives

The future of so-called generative AI, programs such as ChatGPT and Stable Diffusion, will combine a plethora of modalities into a single program, including not only text and images and video, but also point clouds and knowledge graphs, even bio-informatics data, and many more views of a scene or of an object.

The many different modalities offer potentially thousands of "views" of things, views that could contain mutual information, which could be a very rich approach to understanding the world. But it also raises challenges.

The key to multi-view in deep neural networks is a concept that Shwartz-Ziv and others have hypothesized known as an "information bottleneck." The information bottleneck becomes problematic as the number of modalities expands.

An information bottleneck is a key concept in machine learning. In the hidden layers of a deep network, the thinking goes, the input of the network is stripped down to those things most essential to output a reconstruction of the input, a form of compression and decompression.

In an information bottleneck, multiple inputs are combined in a "representation" that extracts the salient details shared by the inputs as different views of the same object. In a second stage, that representation is then pared down to a compressed form that contains only the essential elements of the input necessary to predict an output that corresponds to that object. That process of amassing mutual information, and then stripping away or compressing all but the essentials, is the bottleneck of information.

The challenge for multi-view in large multi-modal networks is how to know what information from all the different views is essential for the many tasks that a giant neural net will perform with all those different modalities.

Also: You can build your own AI chatbot with this drag-and-drop tool

As a simple example, a neural network performing a text-based task such as ChatGPT, producing sentences of text, could break down when it has to also, say, produce images, if the details relevant for the latter task have been discarded during the compression stage.

As Shwartz-Ziv and LeCun write, "[S]eparating information into relevant and irrelevant components becomes challenging, often leading to suboptimal performance."

There's no clear answer yet to this problem, the scholars declare. It will require further research; in particular, redefining the multi-view from something that includes only two different views of an object to possibly many views.

"To ensure the optimality of this objective, we must expand the multiview assumption to include more than two views," they write. In particular, the traditional approach to multi-view assumes "that relevant information is shared among all different views and tasks, which might be overly restrictive," they add. It might be that views share only some information in some contexts.

Also: This is how generative AI will change the gig economy for the better

"As a result," they conclude, "defining and analyzing a more refined version of this naive solution is essential."

No doubt, the rise of multi-modality will push the science of multi-view to devise new solutions. The explosion of multi-modality in practice will lead to new theoretical breakthroughs for AI.

Artificial Intelligence

Meta’s Code Llama is Here, But Unnaturally

Code Llama

Within a few months of the launch of LLaMA, Meta caught up with OpenAI in almost every aspect except coding. Now, the company has finally released its code generation model called Code Llama, which generates code based on both code and natural language prompts. The best part is that just like Llama 2, Code Llama is open source and also available for commercial use.

Code Llama is built upon the foundation of Llama 2, which has been fine-tuned with specialised code-related datasets. The company announced four versions of Code Llama — Code Llama, Code Llama Instruct, Code Llama Python, and Unnatural Code Llama, each with varying capacities: 7B, 13B, and 34B parameters. However, the release only includes the first three versions of Code Llama except Unnatural Code Llama.

Code Llama models can effectively process up to 100,000 tokens of context, resulting in more relevant code generation. This proves useful for understanding large code bases and debugging extensive code. Developers can input substantial portions of their codebase to receive assistance in resolving issues and comprehending intricate coding challenges. The 7B model can run on a single GPU for lower latency and real-time code completion.

Extensive benchmark testing validates Code Llama’s prowess. In contrast to other code-specific AI models, Code Llama’s 34B model achieves an impressive score of 53.7% on HumanEval and 56.2% on Mostly Basic Python Programming (MBPP), rivalling even ChatGPT’s performance.

One of the interesting parts about Code Llama’s dataset is the selection of Unnatural Instructions, which is a dataset created using existing AI models. And surprisingly enough, the company has decided to not release the Unnatural model, which is a version of Python 34B on 15,000 unnatural instructions. This was the most powerful version of Code Llama, according to the paper.

What is Unnatural code?

In December 2022, Meta AI with Tel Aviv University published the paper named Unnatural Instructions: Tuning Language Models with (Almost) No Human Labor. The paper talks about how Meta created a large dataset of creative and diverse instructions and collected 64,000 examples by prompting a language model. This was then further prompted to create a total of 240,000 examples on inputs and outputs, which contained only a little amount of noise.

Looks very nice on initial skim!
But about this "Unnatural Code Llama"… https://t.co/2r5FSESYJ7

— Andrej Karpathy (@karpathy) August 24, 2023

Basically, Meta AI created a synthetic dataset of code which is entirely automated. According to the paper, using the dataset, Meta’s models were able to outperform other models like ChatGPT in several tasks related to natural language processing. The same method has been now applied to Code Llama with a coding dataset.

Interestingly, according to the Unnatural Instructions paper, the data generation model used text-davinci-002 and GPT-3 for generating input and output data. Though there is no specific mention of using OpenAI’s GPT for Code Llama model by Meta, there is a high possibility that it would be a mix of code generated by Llama 2 and possibly GPT-4 as well. This might be one of the reasons to not release the Unnatural Code Llama model.

Synthetic data is too precious, but too problematic

Just like everyone was trying to mimic ChatGPT’s success by training their models on its output data, the same is happening with code generating models. There is a high possibility that the Unnatural model would be trained on GPT-4, or more specifically OpenAI’s Codex output, through GitHub Copilot. This would get Meta into legal trouble with OpenAI as the company clearly restricts training on GPT output now.

It is, however, clear that synthetic data is proving to be the winner when it comes to expanding the capabilities of generative models. Being trained on only 15,000 synthetic dataset, the unreleased Unnatural Code Llama tested out to be the most powerful. Meta could have avoided any legal troubles with OpenAI if they would just used Llama 2 output for training purposes. Or possibly, the company just wants to keep it with itself for internal use.

In the meantime, the release of Code Llama to be available for commercial purpose, just like Llama 2, gives Meta an edge over other code generation platforms such as Copilot, which are still pay-to-use. Moreover, the 7B models allow code generation to be done locally on a single GPU.

With the release of Code Llama, Meta continues to be the good guy in the open source and developer ecosystem, just like they did with Llama 2, and even PyTorch. The company is making its moat even stronger. The partnership with Microsoft is definitely going to help them make some bucks in the future.

The post Meta’s Code Llama is Here, But Unnaturally appeared first on Analytics India Magazine.

Data visualization: The underrated skill in business analytics

Data Visualization

In an age where data has become the lifeblood of businesses, deciphering this raw data to yield actionable insights is critical. Here is where the role of business analytics comes into play. Business analytics, a blend of data management, business intelligence, and predictive modeling, is a field dedicated to driving business strategies through the lens of data. However, the effectiveness of a business analytics strategy is more than just the volume of data or the sophistication of modeling techniques. Instead, it hinges on an often underrated yet immensely vital skill – data visualization.

Business analytics goes beyond pure numbers; it’s about telling a story – a story that can influence critical business decisions. This story becomes compelling, influential, and easily understandable when articulated through data visualization. By visually representing data, we can bring the narrative to life and communicate complex concepts in a digestible, clear, and impactful way.

This article will explore the fascinating world of data visualization, its underrated status, and its growing relevance in business analytics.

What is data visualization?

At its core, data visualization is the art and science of graphically representing data. It involves using visual elements like charts, graphs, and maps to convey complex data sets efficiently and interpretably. In business analytics, this graphical representation serves as a bridge between technical and non-technical stakeholders, translating the language of raw numbers into visuals that everyone can comprehend.

Data visualization is far more than a mere translation tool, though. Its real power lies in its ability to spotlight trends, patterns, and outliers that might go unnoticed in text-based data. This enhanced visibility allows decision-makers to capture crucial insights swiftly and make informed, data-driven decisions.

But why is data visualization critical in business analytics? To answer that, we must consider the immense volume of data that modern businesses deal with. Organizations are continually gathering data from various sources in an era of big data. The challenge is not in obtaining the data but in making sense of it and extracting valuable insights. Here is where data visualization comes into the picture, guiding businesses to the insights they need.

Data visualization often remains an underrated aspect of business analytics despite its evident significance. It’s an underappreciated art, often overshadowed by the hype around machine learning and artificial intelligence.

The underrated nature of data visualization

In the complex business analytics ecosystem, data visualization often fails to garner the attention it deserves, which may seem paradoxical, considering its pivotal role in driving data-driven decisions and strategies. But when delving into business analytics, one usually encounters the spotlight on high-end, complex data modeling techniques, machine learning algorithms, and statistical analysis. These undoubtedly constitute the backbone of business analytics, but they can also eclipse the significance of data visualization.

This overshadowing often leads to a common misconception – that data visualization is a secondary skill that doesn’t require extensive learning or understanding. Some perceive it as simply beautifying or organizing data rather than a tool for insightful analysis and effective communication. This misperception is precisely why data visualization tends to be underrated.

Moreover, several businesses underestimate the difficulty and skill involved in effective data visualization. Creating an impactful visual representation of data isn’t simply choosing the right chart type or colors but understanding the data, selecting the appropriate visualization techniques to highlight key insights, and communicating them effectively to various stakeholders. It subtly blends data science, graphic design, and storytelling.

While the hype around sophisticated machine learning algorithms and artificial intelligence persists, the importance of data visualization continues to grow. Despite its often underrated status, it’s an indispensable part of any comprehensive data analytics course and a skill every aspiring business analyst should master. It not only equips professionals with a vital tool for analysis but also provides them with a powerful means of conveying complex data narratives in a simple, digestible format.

The power of data visualization in business analytics

In the vast sea of information, businesses are like navigators charting a course through turbulent waters. Data visualization is the compass, illuminating the path toward impactful, data-driven decisions. Its influence on business analytics is transformative, leading to more effective strategies and increased competitiveness.

  1. Data visualization renders complexity manageable.

Business data is often complex, multidimensional, and voluminous, making it challenging to dissect and understand. Visualizing this data simplifies the intricacies and allows businesses to see the relationships, correlations, and patterns within their data, making analysis more approachable.

  • Data visualization democratizes data.

Any business has a spectrum of stakeholders, from technical experts to non-technical decision-makers. Data visualization is the bridge that connects these disparate groups, translating data science jargon into a universal language. With clear visuals, stakeholders from all backgrounds can understand the insights derived from data and contribute to data-driven decision-making.

  • Data visualization accelerates the decision-making process.

In the fast-paced business world, time is a scarce and precious commodity. Visualizing data condenses large amounts of information into concise, understandable formats, allowing for quicker absorption of data, faster detection of trends, and expedited decision-making. It ensures that businesses can keep pace with their data, stay agile, and maintain their competitive edge.

  • Data visualization is crucial for predictive analytics.

Predictive analytics is one of the most potent applications of business analytics. By visually representing past trends and potential future scenarios, businesses can anticipate market changes, optimize their strategies, and stay ahead of the curve.

Data visualization techniques

Data visualization: The underrated skill in business analytics
source: https://cdn.80.lv/api/upload/content/0e/62e3aab33534a.jpeg

Now, let’s briefly delve into some standard techniques used to represent data visually:

  1. Bar Charts and Column Charts: These charts are simple yet powerful tools for comparing quantities across different categories, typically used for showing trends over time or comparing values across several groups.
  • Pie Charts: Pie charts represent the proportion of parts to a whole and are particularly effective when comparing the relative sizes of categories in a dataset.
  • Line Graphs: Line graphs are excellent for showing changes over time, effectively illustrating trends and patterns that make them especially useful in forecasting and trend analysis.
  • Scatter Plots: Scatter plots display the relationship between two numerical variables and are often employed in correlation and regression analyses.
  • Heat Maps: Heat maps use color gradients to represent the distribution and density of variables, which are beneficial in identifying patterns and clusters in large datasets.
  • Interactive Dashboards: Dashboards aggregate various visualizations into a single interface, providing a consolidated data view. They allow users to interact with the data, drill down into specifics, and customize the view to their needs.
  • Geographical Maps: Map-based visualizations can be invaluable when dealing with geographical data. They can represent data density in different regions, compare variables across locations, or track changes over time.

These techniques represent just the tip of the iceberg in data visualization. As part of a comprehensive business analytics course, you’d be exposed to these and more advanced techniques using popular tools like Tableau, Power BI, and Python libraries such as Matplotlib and Seaborn.

The future of data visualization in business analytics

As we move further into the era of Big Data and Artificial Intelligence, the future of data visualization in business analytics looks brighter. The skill is set to play an even more prominent role as businesses grapple with increasing volumes of data and growing demand for data-driven decision-making.

With the advent of augmented reality (AR) and virtual reality (VR), we can expect data visualization to transcend traditional two-dimensional graphs and charts. These technologies will enable the creation of immersive, three-dimensional data visualizations, allowing businesses to interact with their data in novel and intuitive ways. Imagine walking through a virtual representation of your data, exploring trends, patterns, and anomalies from every angle. This immersive visualization can enhance understanding, improve engagement, and make data analysis more intuitive.

Moreover, the rise of AI and machine learning will significantly impact data visualization. Automated data analysis and visualization tools will become more prevalent, making it easier for businesses to generate and update their visualizations in real-time. Machine learning algorithms will also play a role in identifying the most insightful visualizations for a given dataset, saving time and increasing efficiency.

Summing up

In the bustling field of business analytics, amidst the buzz of machine learning and artificial intelligence, data visualization stands as an underrated yet profoundly influential skill. It can transform complex, voluminous data into understandable, actionable insights. It democratizes data, making it accessible and understandable to everyone within an organization, regardless of their technical proficiency.

As we step into the future of business analytics – a future dominated by Big Data, AI, and novel technologies – the role of data visualization is set to expand even further. Therefore, gaining proficiency in this skill today will set you up for success in the dynamic landscape of tomorrow.

Nirmala Sitharaman Calls Out IBM For Being Outside the Realm of AatmaNirbhar Bharat

Nirmala Sitharaman Mocks IBM For Being Outside the Realm of AatmaNirbhar Bharat

Nirmala Sitharaman, finance minister of India, was part of a panel at the B20 Summit where she was put up with a question from Arvind Krishna, CEO of IBM about advising what should companies do to establish a strong presence in India.

“What encouragement or advice would you give those of us who are from multinational companies and wish to have a strong presence in India and from India to serve the world?” asked Krishna. Emphasising that he has been happy with the AatmaNirbhar mission of the government, but talks about free trade opens up many questions.

To this Sitharaman replied, “Comments about free trade should actually encourage you to be in India.” She explains how so much effort has been put in by the commerce minister and his team.

On the question of the Free Trade Agreement (FTA), she said, “I would not be wrong in saying an FTA is very close for a final call with the UK, and I think agreements with Canada are also progressing, and I expect them to come to a conclusion sooner rather than later.” She also said that agreements have already been signed with Australia and UAE.

Interestingly, Sitharaman said that for FTA, you have to be present in India, speaking with Krishna. “You have a government that brought stability in policy. We have a government that shows we are not thirsting for more revenue with some tax rates increased here and there.”

She adds that everyone knows that AatmaNirbhar is already in progress, and “IBM is probably outside of that realm,” and how AatmaNirbhar is not going against globalisation.

Focusing on the growing Indian economy, Sitharaman adds that the country’s economy speaks for itself and investors look for such destinations.

At the B20 Summit, Krishna said that he is excited about AI potential in driving the country’s economy as it can take over cognitive tasks and perform them. AI will help “generate more per capita GDP”, he also added.

In an interview with Bloomberg in May, Krishna had also said that AI has the potential to cut 30% of the jobs.

The post Nirmala Sitharaman Calls Out IBM For Being Outside the Realm of AatmaNirbhar Bharat appeared first on Analytics India Magazine.

Things You Should Know When Scaling Your Web Data-Driven Product

Things You Should Know When Scaling Your Web Data-Driven Product
Photo by Getty Images on Unsplash+

When you look around today's business landscape, you most likely see an era where data is not just the oil but the fuel, engine, and wheels of most industries.

So if you're in the business of web data-driven products, your future partly relies on scaling. Every decision, every strategy, every product is hinged on data.

But how do you scale your product successfully?

This article aims to illuminate your path with key considerations and practical tips for scaling. Whether you're running a recruitment platform, a lead generation platform, or any data-driven product, you'll find the guidance you need right here.

Understanding the Basics of Scaling Data-driven Products

Let's talk about scalability first. What is it? Imagine your product is a balloon. As demand grows, you want your balloon to inflate and expand without popping.

That's what scalability is about. It's the ability to handle increased loads smoothly, whether it's more data, more users, or more transactions.

So, what should be on your radar when planning to scale?

Data Collection and Management Strategies

First off, data. It's the core of your product. But how do you maintain the consistency and quality of your data collection as your product scales? How do you integrate and use this data effectively?

The heart of successful scaling lies in managing these aspects proficiently. Let's dissect these components of data collection and management strategies:

  1. Constant verification. Regularly check your data sources and ensure the data collected is still relevant and accurate.
  2. Rigorous cleaning. Use robust algorithms to clean your data and remove any inconsistencies, errors, or duplicates.
  3. Smart integration. Fuse your datasets in a way that maintains its quality and usability.

By refining these three areas, you're setting your data-driven product up for a successful scale-up. It's all about managing the data flow with precision, cleanliness, and smart integrations.

Data Privacy and Compliance

Scaling isn't just about growth; it's also about responsibility. As you handle more data, especially personal data, you're bound to cross paths with ethical and legal considerations.

So, how do you ensure data privacy and meet regulatory compliance?

A word to the wise: anonymize data whenever possible, stay abreast of the latest data regulations in your operating regions, and conduct regular audits to ensure compliance.

Strategies for Scaling Data-driven Products in different Industries

When scaling a data-driven product, the specifics will vary depending on the industry and the nature of the product.

Let's look at some concrete examples of how you can leverage web data to scale in different fields.

Recruitment Platforms

Let's say you're running a recruitment platform. As the platform grows and more companies and job seekers join, you'll have to get and manage a greater volume of job posting data and employee data.

In this case, an AI-based matching algorithm could be your key to scaling. The algorithm would analyze job descriptions, skill requirements, and candidates' profiles, making accurate match suggestions.

As more data comes in, the algorithm learns and improves, providing better matches over time.

An example is how platforms like LinkedIn use their data to refine their "Jobs You May Be Interested In" feature.

Lead Generation Platforms

In the context of a lead generation platform, scaling means efficiently processing and analyzing more extensive firmographic, employee, and job posting data to generate high-quality leads.

For instance, you could scale your platform by integrating more data, which enriches lead data, helping businesses understand their prospects better and target their marketing efforts more effectively.

As your platform grows, predictive analytics tools could be employed to anticipate customer behavior based on previous data patterns, improving lead scoring, and driving more conversions.

Anticipating and Overcoming Scaling Challenges

Scaling isn't always smooth sailing. You'll face challenges, from infrastructure constraints and data management issues to maintaining data quality and security.

  1. Infrastructure constraints. As you scale, your existing infrastructure may struggle to keep up with the increased data loads and user requests. You might encounter slower processing times or even system crashes. The key to addressing this is to invest in scalable infrastructure from the start. Consider solutions like cloud-based servers or databases, which can expand (or contract) according to your needs.Managed services from providers like Amazon Web Services (AWS) or Google Cloud can help alleviate these challenges, offering robust, scalable infrastructure.
  2. Data management issues. With more data comes more complexity. You’ll have to deal with diverse data formats, integration challenges, and possibly incomplete or inconsistent data. Automated data management tools can be a lifesaver here, helping to collect, clean, integrate, and maintain your data systematically.
  3. Maintaining data quality. As you scale, the risk of data errors, duplicates, or inconsistencies increases. To maintain the quality of your data, you need to implement sophisticated data validation and cleaning processes. These could range from simple checks and deduplications to more complex ML algorithms.
  4. Data security. With a larger dataset and increased user base, the potential for data breaches also increases.Implementing robust security measures is crucial. This could include encrypting sensitive data, conducting regular security audits, and ensuring your platform complies with relevant data protection regulations.

Challenges are natural when it comes to scaling. The key is to anticipate potential issues, prepare for them, and have strategies in place to address them when they arise.

Preparing for the Future of Data-driven Products

The world of data is fast-paced and ever-evolving. Preparing for the future is about more than just staying afloat; it's about positioning yourself to ride the wave of progress. How can you ensure your data-driven product is ready for whatever comes next?

  1. Continual learning. The future will bring new technologies, new methodologies, and new ways of understanding and utilizing data. It's crucial to foster a culture of continual learning and curiosity in your team. Stay up-to-date with the latest advancements in data science and technology. Attend seminars, webinars, and industry events. Encourage your team to seek out new certifications and educational opportunities.
  2. Investing in advanced technologies. Artificial Intelligence (AI) and Machine Learning (ML) are not just buzzwords—they're shaping the future of data-driven products. These technologies can automate data processing tasks, derive insights from complex datasets, and improve your product's efficiency and scalability. Additionally, blockchain technology is increasingly being used to enhance data security and transparency. Consider how these advancements can be integrated into your platform.
  3. Agility and adaptability. As your data-driven product scales, you'll need to make adjustments—possibly significant ones—to your strategies and processes. Fostering an agile mindset can help you adapt to changes more smoothly. Experiment with different strategies, learn from your successes and failures, and don't be afraid to pivot when needed.
  4. Ethics and compliance. With increased public awareness and regulatory focus on data privacy, ensuring ethical data practices and compliance with regulations is more important than ever. This isn't just about avoiding penalties—it's also about building trust with your users. Regularly review and update your data privacy policies, and consider conducting third-party audits to ensure compliance.
  5. Predictive analytics. The future is all about anticipating trends and making proactive decisions. Predictive analytics tools can analyze past data to predict future trends, helping you stay one step ahead. They can also help with risk management, customer behavior prediction, and performance forecasting.

Preparing for the future isn't a one-time task, but a continuous process of learning, adapting, and anticipating. With a future-focused mindset, you can ensure your data-driven product remains relevant and competitive, come what may.

But how Exactly can you stay Prepared?

  • Invest in talent. Skillsets revolving around data are constantly evolving. Invest in your team's continual learning to ensure they stay on top of emerging trends and technologies.
  • Embrace AI and machine learning. These technologies will continue to shape the future of data-driven products. Explore how they can enhance your product's scalability and effectiveness.
  • Foster agility. Rapid change is a constant in the tech world. Cultivate an agile mindset and be ready to pivot or adapt your strategies as needed.

Conclusion

In a world increasingly reliant on data, scaling your web data-driven product is no longer a choice but a necessity.

Whether you're dealing with firmographic data, employee data, job posting data, or more, the success of your scaling efforts will depend on your data collection and management strategies, your adherence to privacy and compliance, your industry-specific scaling strategies, and your preparedness for the future.

Karolis Didziulis is the Product Director at Coresignal, an industry-leading provider of public web data. His professional expertise comes from over 10 years of experience in Bh1B business development and more than 6 years in the data industry. Now Karolis's primary focus is to lead Coresignal's efforts in enabling data-driven startups, enterprises, and investment firms to excel in their businesses by providing the largest scale and freshest public web data from the most challenging sources online.

More On This Topic

  • KDnuggets News, April 13: Python Libraries Data Scientists Should Know in…
  • 7 Things You Didn't Know You Could do with a Low Code Tool
  • 6 Things About Data Science that Employers Don’t Want You to Know
  • 6 Things You Need To Know About Data Management And Why It Matters For…
  • 3 things you didn’t know about the SAS Academy for Data Science
  • DataOps: 5 things that you need to know