Gleen’s tech-savvy chatbot for Discord and Slack attracts Solana founder in oversubscribed round

Gleen’s tech-savvy chatbot for Discord and Slack attracts Solana founder in oversubscribed round Rita Liao 12 hours

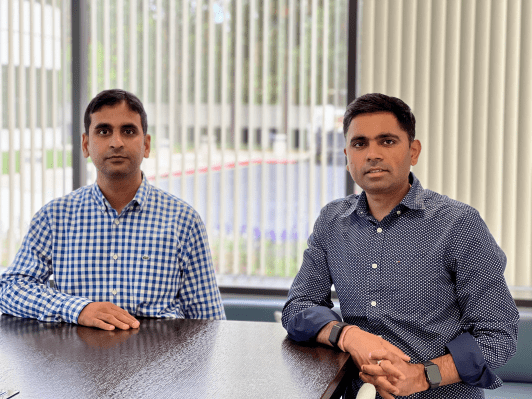
There’s no shortage of chatbot services trying to earn a place in the myriad channels on Discord and Slack. California-based Gleen, founded by Microsoft and LinkedIn veterans, is offering its enterprise-grade chatbot to the most demanding segment of the market — technical communities, like a blockchain infrastructure channel on Discord, and it has raised some fresh funding to work on the product.

The narrow focus is a good start as it pushes Gleen to solve the most urgent issue in large language models today: hallucination. Hallucination, which happens when artificial intelligence makes up false information but answers with confidence, is especially high-stakes for discussions that involve esoteric topics, as a false but assertive answer could easily mislead participants.

“If someone says the price of Uniswap [the token of the namesake decentralized crypto exchange] is going to go up to $200, then it can be a massive manipulation of the market,” Ashu Dubey, co-founder and CEO of Gleen, told TechCrunch in an interview. “We decided that we were going to fix this particular problem of hallucination before we could actually be a serious player, so we fixed it.”

Gleen’s vision attracted investors from both the established software world and the nascent crypto sphere in its $4.9 million oversubscribed funding round. Institutional investors include Slow Ventures, 6th Man Ventures, South Park Commons, Spartan Group and CoinShares. Among its list of angels are Anatoly Yakovenko, co-founder of the popular blockchain network Solana; Mike Derezin, former COO of blockchain data provider Chainlink; Will Papper, co-founder of decentralized investing protocol Syndicate; and ISM Angels.

When asked about competition, Dubey argued that many chatbots on the market are mere “wrappers” of ChatGPT and other large language models, so the responses they give are likely the same as those from calling the OpenAI API.

That approach doesn’t solve hallucinations. Instead, Gleen created its own proprietary machine learning layer that sources from enterprise knowledge, which can then cross-check LLM responses to avoid hallucination. LLM is less than 20% of its tech stack; the rest of the work goes to how Gleen stores the data and its proprietary system retrieves data to generate the most accurate answer based on domain knowledge.

Once Gleen’s system is confident that it has an answer, it sends it to various LLMs, be it OpenAI, Anthropic or a fine-tuned Llama, to generate a response. All in all, Gleen’s model has been trained on 100,000 pairs of questions and answers.

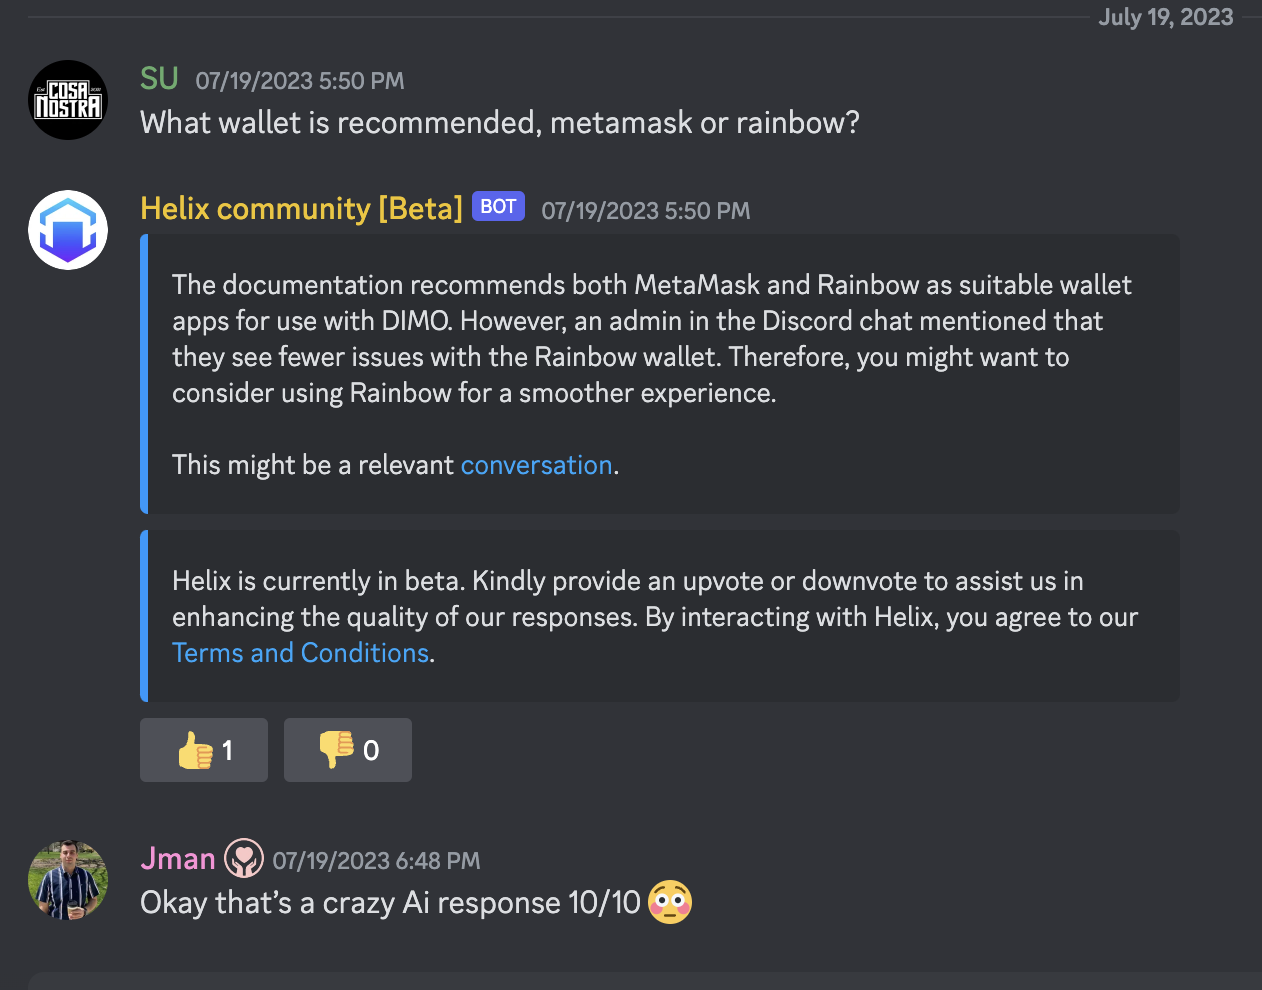
Gleen’s chatbot interacting with users on Discord. Image: Gleen

“Search is our own proprietary algorithm, and that’s where our secret sauce is,” the founder said. “The communities and companies, where the subject matter is highly technical or the quality of the answer matters a lot, is where we get the best traction because those companies or communities appreciate what a good response versus a bad response means.”

Every time it onboards a new user, Gleen needs to learn its domain knowledge by gleaning data from its knowledge base, forums, Slack or Discord discussions. The ability to abstract from that information is one of the sta0rtup’s strengths, according to Dubey, as it “[doesn’t] need very clean documentation.”

Gleen got its start by providing its Discord chatbot to a web3 customer, though now it generates more revenues from non-crypto users. Run by a team of eight employees, Gleen is now serving more than 10 customers who pay by the number of conversations generated for the bot.

“Customer support is easily a $10 billion market,” said Dubey. Gleen is moving into the medium-sized enterprise market, and its distant goal is to “solve customer service for everyone, from mom-and-pop stores to very large corporations.” The early user base is highly technical, but it wants to be “industry agnostic” in the future, which then will be a real test of its AI system’s adaptability.

Going forward, Gleen plans to spend its fresh funding on building, driving sales and marketing. A big part of its go-to-market strategy will be educating users on issues around hallucination, security and compliance in the field of generative AI, according to Dubey.

“Though we will have a sales force, inbound will continue to be our biggest channel. That’s also very defensible going forward,” he said.

Gleen’s direction is shaped not just by the fast-evolving AI technologies it leverages but also the type of its customers, that is, companies dealing with cutting-edge, changing technologies like itself. The unpredictability nature of these variables presents one of the startup’s biggest challenges.

“As a CEO, you’re investing in a particular technology or taking a product to the market. But what if the underlying technology completely changes one year from now? You have to restart from scratch,” Dubey said.

“If we are halfway or 25% into research, we just keep an eye out on what’s best out there, so we are not married to the technology. We are married to the customer problem. We want to solve the customer support problem for these new companies that are coming up in the best possible way.”

Discord updates its bot with ChatGPT-like features, rolls out AI-generated conversation summaries and more

16 most interesting AI applications across industries worldwide

AI APPLICATIONS ACROSS INDUSTRIES WORLDWIDE – USAII

Artificial Intelligence has become a compulsive innovation for humankind, that we cannot live without. It has been gaining strength with every passing moment. The impact of AI applications extends beyond improved business results and can be significant in elevating and enriching the human experience. Popular AI trends in the past have revealed a compelling need for such an advancement in technology; that is setting the path at a higher pedestal for most processes. The current value of nearly USD 100 billion is expected to grow 20-fold by the year 2030, up to nearly USD 2 trillion (source: Statista). This allows enough space to cover a massive gamut of industries across borders under Artificial Intelligence.

About Artificial Intelligence

Artificial Intelligence is an insanely talented and equipped technological advancement that leverages computers and machines to ape the problem-solving and decision-making capabilities of humans. Students, professionals, and entrepreneurs interested in technology are the best fit for getting started in the AI Industry.

Precedence Research highlights the global artificial intelligence market size is expected to touch USD 1591.03 billion mark by 2030; growing at a CAGR of 38.1%. With these numbers in the light, it offers ample weightage to the Artificial Intelligence industry; which is playing strong with its invasion in every industry possible worldwide.

MODERN AI APPLICATIONS AT WORK

1. Healthcare

Thinking Intelligently’ has been made easier for machines by Artificial Intelligence in Healthcare as well. Data mining for identifying patterns and carrying out highly accurate diagnoses and treatment of medical conditions; medical imaging, medication management, drug discovery, and robotic surgery, are some of the many AI inventions in healthcare systems.

2. eCommerce

Retail and eCommerce have experienced some of the most evident and startling intrusions of all time. Intelligent and targeted product recommendations, finding patterns in consumer behavior, chatbots on eCommerce websites, and many others have fuelled the AI regime.

3. Banking and finance

AI professionals can be easily seen making Artificial Intelligence an integral part of the Banking industry by far. Software robots processing loan applications, replacing human agents, Robo-financial advisors, and AI-based chatbots, are incredible ways banking has become convenient and consumer-friendly in recent times.

4. Transportation and logistics

Self-driving vehicles have become a rage. Thanks to Artificial Intelligence! From transforming supply chain management to deploying robots for sorting and packaging products in warehouses- AI has transformed the way we envision logistics today.

5. Travel

AI-enabled chatbots have leveraged the highest benefits when it concerns increasing efficiencies, and yielding highly accurate responses to customer queries.

6. Education

Alongside improving educators’ potential, AI has offered ample means to grade homework, schedule meetings, manage multiple online courses at once, send personalized communications to students, and creates or digitize lectures and study guides.

7. Real estate

Analyze market conditions, property prices, and other factors to determine property values, trends, and investment opportunities.

8. Entertainment and gaming

From OTT platforms to recommending personalized shows to the viewers to video games enhancing visuals and gameplay experience; AI has spread its wings in the entertainment industry.

9. Manufacturing

Popularly known as ‘Cobots’, collaborative robots can take instructions from humans and work productively; while in factories, ML and AL are deployed to assist in the predictive maintenance of industrial equipment.

10. Automotive

Using cameras, radar, sensors, and others can detect and accommodate traffic conditions; contributing to safer and more efficient driving. The automotive industry is benefiting hugely from AI assisting in smart decisions, adaptive cruise control, lane departure warning, and automatic emergency braking systems.

MODERN AI APPLICATIONS AT HOME

  1. Automated Driving programs deployed by Tesla, Audi, Volvo, and others in the design of their new-generation cars are exemplary.
  2. Email Spam Filters to weed out spam and illicit content from your email accounts.
  3. Facial Recognition
  4. Transaction Authentication
  5. Domestic Robots such as Automated vacuums and lawnmowers, rely on AI to avoid obstacles; and learn the best time to perform tasks.
  6. Advanced Home Security Systems along with Siri, Amazon Alexa, and Google Assistant rely heavily on AI to function par excellence.

With so much happening in the Artificial Intelligence industry so far; it has made it necessary for the industrial players to hire a certified AI talent pool; backed with the best Artificial Intelligence certifications from renowned and most trusted names worldwide. From a diversified industrial application to the minutest of the actions at home; being impacted by Artificial Intelligence; it is time that entering the field becomes accessible with credible AI certification providers that honor the best credentials in the industry.

Looking at the modern applications of AI, the time is rife to make big moves in building a flourishing AI career for yourself with the best by your side. Make yourself an inevitable addition to the AI industry that is expected to yield a whopping growth rate within a decade’s time.

How to use ChatGPT to make charts and tables

charts-gettyimages-175600876

Know what floats my boat? Charts and graphs.

Give me a cool chart to dig into and I'm unreasonably happy. I love watching the news on election nights, not for the vote count, but for all the great charts. I switch between channels all evening to see every possible way that each network finds to present numerical data.

Is that weird? I don't think that's weird.

Also: The moment I realized ChatGPT Plus was a game-changer for my business

As it turns out, ChatGPT does a great job making charts and tables. And given that this ubiquitous generative AI chatbot can synthesize a ton of information into something chart-worthy, what ChatGPT gives up in pretty presentation it more than makes up for in informational value.

Exactly what sort of chart-making tools are available for ChatGPT? There are three ways you can proceed:

  1. You can make tables (but not charts) in the free version of ChatGPT
  2. You can make charts and tables using the Advanced Data Analysis (formerly "Code Interpreter") add-on to ChatGPT Plus
  3. You can make tables using ChatGPT Plus and charts using random charting plugins

In this article, I'll be discussing the first two options, but skipping over the third. While there are a variety of charting plugins for ChatGPT Plus, they all take you out of the ChatGPT interface and employ external services. They all attempt to charge an upsell fee to get you to use their SaaS-based charting services. Essentially, they're listed in the ChatGPT store as ads, not as out-of-the-box functional tools. Plus, they tend to be very unreliable.

Note: What ChatGPT used to call "Code Interpreter" is now called "Advanced Data Analysis." So whenever we previously used the term Code Interpreter, we'll now be moving on to calling it Advanced Data Analysis.

Advanced Data Analysis produces relatively ugly charts. But it rocks. First, let's discuss where ChatGPT gets its data, then we'll make some tables.

How to use ChatGPT to make charts and tables

List the top five cities in the world by population. Include country.

I asked this of ChatGPT's free version and here's what I got back:

Turning it into a table is simple. Just tell ChatGPT you want a table:

Make a table of the top five cities in the world by population. Include country.

Make a table of the top five cities in the world by population. Include country and a population field

You can also specify certain details about the table, like field order and units. Here, I'm moving the country first and compressing the population numbers.

Make a table of the top five cities in the world by population. Include country and a population field. Display the fields in the order of rank, country, city, population. Display population in millions (with one decimal point), so 37,833,000 would display as 37.8M.

Note that I gave the AI an example of how I wanted the numbers to display.

That's about as far as the free version will take us. From now on, we're switching to the $20/month ChatGPT Plus version.

In this example, we're just going to make a simple bar chart.

Make a bar chart of the top five cities in the world by population

Chatty little tool, isn't it?

The eagle-eyed among you may have noticed the discrepancy in populations between the previous table shown and the results here. Notice that the table has a green icon and this has a purple icon. We've jumped from GPT-3.5 (the free version of ChatGPT) to GPT-4 (in ChatGPT Plus). It's interesting that the differing LLMs have slightly different data. This is all part of why it pays to be careful when using AIs and double-check your work. In our case, we're just demonstrating charts, but this is a tangible example of where confidently presented data can be wrong or inconsistent.

The dataset I chose for this article is readily available from a government site, so you can replicate this experiment on your own. There are a ton of great datasets available on Data.gov, but I found that many are far too large for ChatGPT to use. Once I downloaded this one, I realized it also included information on ethnicity, so we can run a number of different charts from the same dataset.

Also: How to use ChatGPT to create an app

Click the little upload button and then tell it the data file you want to import.

I asked it to show me the first five lines of the file so I'd know more about the file's format.

Create a pie chart showing gender as a percentage of the overall dataset

And here's the result:

Unfortunately, the dark shade of green makes the numbers difficult to read. Fortunately, you can instruct Advanced Data Analytics to use different colors. I was careful to choose colors that did not reinforce gender stereotypes.

Create a pie chart showing gender as a percentage of the overall dataset. Use light green for male and medium yellow for female.

Show the distribution of ethnicity in the dataset using a pie chart. Use only light colors.

And here's the result. Notice anything?

Apparently, New York didn't properly normalize its data. It used "WHITE NON HISPANIC" and "WHITE NON HISP" together, "BLACK NON HISPANIC" and "BLACK NON HISP" together, and "ASIAN AND PACIFIC ISLANDER" and "ASIAN AND PACI" together. This resulted in inaccurate representations of the data.

One benefit of ChatGPT is it remembers instructions throughout a session. So I was able to give it this instruction:

For all the following requests, group "WHITE NON HISPANIC" and "WHITE NON HISP" together. Group "BLACK NON HISPANIC" and "BLACK NON HISP" together. Group "ASIAN AND PACIFIC ISLANDER" and "ASIAN AND PACI". Use the longer of the two ethnicity names when displaying ethnicity.

And it replied:

Let's try the chart again, using the same prompt.

Show the distribution of ethnicity in the dataset using a pie chart. Use only light colors.

That's better:

You need to be diligent when looking at results. For example, in a request for top baby names, the AI separated out "Madison" and "MADISON" as two different names:

For all the following requests, baby names should be case insensitive.

For each ethnicity, present two pie charts, one for each gender. Each pie chart should list the top five baby names for that gender and that ethnicity. Use only light colors.

As it turns out, the chart generated text that was too small to read. So, to get a more useful chart, we can export it back out. I'm going to specify both file format and file width:

Export this chart as a 3000 pixel wide JPG file.

And here's the result:

Notice that Sofia and Sophia are very popular, but are shown as two different names. But that's what makes charts so fascinating.

FAQ

How much does it cost to use Advanced Data Analytics?

Advanced Data Analytics comes with ChatGPT Plus as a beta feature you have to turn on in the Settings panel. ChatGPT Plus is $20/month. Advanced Data Analytics also is included with the Enterprise edition, but pricing for that hasn't been released yet.

Is the data uploaded to ChatGPT for charting kept private or is there a risk of data exposure?

Assume that there's always a privacy risk.

I asked this of ChatGPT and this is what it told me: Data privacy is a priority for ChatGPT. Uploaded data is used solely for the purpose of the user's current session and is not stored long-term or used for any other purposes. However, for highly sensitive data, users should always exercise caution and consider using the Enterprise version of ChatGPT, which offers enhanced data confidentiality.

Also: Generative AI brings new risks to everyone. Here's how you can stay safe

My recommendation: Don't trust ChatGPT or any generative AI tool. The Enterprise version is supposed to have more privacy controls, but I would recommend you only upload data that you won't mind finding its way to public visibility.

Can ChatGPT's Advanced Data Analysis handle real-time data or is it more suited for static datasets?

It's possible, but there are some practical limitations. First, the Plus account will throttle the number of requests you can make in a given period of time. Second, you have to upload each file individually. There is the possibility you could use a licensed ChatGPT API to do real-time analytics. But for the chatbot itself, you're looking at parsing data at rest.

You can follow my day-to-day project updates on social media. Be sure to subscribe to my weekly update newsletter on Substack, and follow me on Twitter at @DavidGewirtz, on Facebook at Facebook.com/DavidGewirtz, on Instagram at Instagram.com/DavidGewirtz, and on YouTube at YouTube.com/DavidGewirtzTV.

Artificial Intelligence

Zoom rebrands existing — and intros new — generative AI features

Zoom rebrands existing — and intros new — generative AI features Kyle Wiggers 10 hours

To stay competitive in the crowded market for videoconferencing, Zoom is updating and rebranding several of its AI-powered features, including the generative AI assistant formerly known as Zoom IQ.

The news comes after controversy over changes to Zoom’s terms of service, which implied that Zoom reserved the right to use customers’ videos to train its AI tools and models. In response to the blowback, Zoom updated its policy to explicitly state that “communications-like” customer data won’t be used in training AI apps and services for Zoom or its outside partners.

The Software Freedom Conservancy, the nonprofit that serves support and legal services for open source projects, recently called on developers to ditch Zoom over the terms of service changes.

“Zoom’s goal is to invest in AI-driven innovation that enhances user experience and productivity while prioritizing trust, safety and privacy,” Zoom wrote in a press release shared with TechCrunch. “In August, Zoom shared that it doesn’t use any customer audio, video, chat, screen-sharing, attachments or other communications-like customer content (such as poll results, whiteboards or reactions) to train Zoom’s or third-party AI models.”

Zoom AI Companion

The rebranded Zoom IQ, called the AI Companion, is powered by the same mix of technologies as Zoom IQ: Zoom’s in-house generative AI along with AI models from vendors including Meta, OpenAI and Anthropic. But its reach is expanding to more corners of the Zoom ecosystem, including Zoom Whiteboard, Zoom Team Chat and Zoom Mail.

Perhaps the biggest news is that Zoom is gaining what’s essentially a ChatGPT-like bot via the AI Companion. In spring 2024, Zoom will get a conversational interface that’ll allow users to chat directly with the AI Companion, and ask questions about prior meetings and chats as well as take actions on their behalf.

For example, users will be able to query the AI Companion for the status of projects, pulling on transcribed meetings, chats, whiteboards, emails, documents and even third-party apps. They’ll be able to ask the AI Companion questions during a meeting to catch up on key points, create and file support tickets and draft responses to inquiries. And — as was possible with Zoom IQ — they’ll be able to have the AI Companion summarize meetings, automatically identifying action items and surfacing the next steps.

Zoom AI chat companion

Image Credits: Zoom

Also starting next spring, the AI Companion will give “real-time feedback” on people’s presence in meetings plus coaching on their conversational and presentation skills.

It’s not a feature every user’s likely to welcome — particularly those concerned about Zoom’s potential ulterior motives around AI. But Zoom points out that real-time feedback, along with the AI Companion’s other capabilities, can be switched off at any time by an account owner or administrator.

Elsewhere, in Zoom Team Chat, Zoom’s messaging app, users will soon (within a few weeks) gain the option to summarize chat threads through the AI Companion — a feature Zoom IQ also offered. (This reporter is skeptical of AI’s summarization skills, but I’ll withhold judgement until I see Zoom’s tech in action.) By early 2024, users will have the ability to auto-complete chat sentences — similar to Microsoft Teams’ and Google Meet’s AI-generated replies, as was promised with Zoom IQ — and schedule meetings from a chat.

In a previously telegraphed feature, Zoom Whiteboard, Zoom’s collaborative whiteboarding tool will be able to generate images and populate templates courtesy of the AI Companion come spring 2024. It’s not clear which image-generating model will power this capability, but presumably, the results will be in line with text-to-image tools such as OpenAI’s DALL-E 2 and Midjourney. (Whether it’ll have content filters and bias mitigations of any sort is another matter.)

In early fall, users of Zoom’s email client Zoom Mail will be able to get AI-generated email suggestions from the AI Companion — like with Zoom IQ. And by spring 2024, Zoom users will gain a way to add meeting summaries to the platform’s note-taking app, Notes, and summarize text messages threads and calls from Zoom’s VoIP service Zoom Phone.

Many, if not most, of the AI Companion features will live in the Zoom app’s side panel. But not for all users. Only paying Zoom customers will be able to access them once they’re live.

Zoom Revenue Accelerator

In Zoom’s second rebranding today, Zoom’s sales assistant tool Zoom IQ for Sales is becoming Zoom Revenue Accelerator.

Zoom IQ for Sales wasn’t particularly well-received at launch, with critics arguing that the sentiment analysis algorithms used in the feature were fundamentally flawed. More than two dozen rights groups called on Zoom to scrap its efforts to explore what they characterized as “inaccurate” and “under-tested” technology.

Zoom didn’t ultimately wind down Zoom IQ for Sales. Instead, it shifted the tool’s feature set from sentiment analysis to more mundane use cases — and continues to do so, from all appearances.

Zoom announced several new capabilities coming to Revenue Accelerator, including a “virtual coach” to simulate conversations for onboarding and training sales team members. The virtual coach can assess salespeople’s performance on pitching products using various sales methodologies, similar to other AI-powered sales training platforms on the market.

Zoom Virtual Coach

Zoom’s virtual coach feature. Image Credits: Zoom

Deal risk signals are coming to Revenue Accelerator, in addition, letting sales team members use a rules-based engine to send alerts if a deal hasn’t moved forward in a specified period of time. Another forthcoming feature, discover monthly, will track how competitors are being mentioned on calls and summarizing the trends on a per-month basis.

Zoom’s revamps come at a pivotal moment for the tech giant, which faced its first quarterly loss of $108 million since 2018 in the fourth-quarter results for the 2023 financial year. Back in February, Zoom laid off 15% of its staff, or around 1,300 people, blaming a post-pandemic slump in demand and increased competition from Microsoft, Cisco, Webex, Slack and others. (Zoom was one of the major beneficiaries of the pandemic, when social distancing rules made videoconferencing an essential tool.)

Zoom’s outlook grew a little rosier for the quarter ending in April as the company underwent belt-tightening. While Zoom recorded the slowest quarterly growth on record at 3% and falling online revenue, it raised its annual revenue forecast to between $4.47 billion and $4.49 billion, up about 2% from $4.44 billion to $4.46 billion.

5 Portfolio Projects for Final Year Data Science Students

5 Portfolio Projects for Final Year Data Science Students
Image by Author

Building a portfolio of data science projects is a crucial step for beginners looking to break into the field. With hands-on experience becoming increasingly important for data science job applicants, having a varied portfolio showcasing your skills can help you stand out.

In addition to demonstrating technical abilities, projects allow you to highlight your problem-solving skills and analytical thinking. Recruiters often look for candidates who can use data to provide strategic business insights and build data-driven solutions to real-world problems. Well-executed projects can set you apart as someone ready to add value to an organization.

In this blog, we will explore simple portfolio projects ranging from data analytics to machine learning. You will discover how to clean and process your data, followed by using various analytical techniques to convey insights to non-technical stakeholders.

1. End-to-End Data Science Project with ChatGPT

In the End-to-End Data Science Project with ChatGPT project, you will use ChatGPT for project planning, data analysis, data preprocessing, model selection, hyperparameter tuning, developing a web app, and deploying it on the Spaces.

Nowadays, anyone with limited knowledge can use ChatGPT to understand the data and build machine learning applications. This project will showcase that you can work with the latest AI technologies to produce fast and effective results.

5 Portfolio Projects for Final Year Data Science Students
Image from Project 2. Recycled Energy Saved in Singapore

For the Recycled Energy Saved in Singapore project, you will use recycling statistics to determine the amount of energy saved annually from 2003 to 2020 for five different waste types: plastics, paper, glass, ferrous metal, and non-ferrous metal. Specifically, you will load and organize the dataset, merge different CSV files, and conduct exploratory data analysis. This project will challenge your analytical and data manipulation abilities.

5 Portfolio Projects for Final Year Data Science Students
Image from Project 3. Stock Market Analysis

The Stock Market Analysis project uses real-world financial data to demonstrate time series analytics skills. After cleaning the data, exploratory analysis and visualization is performed using Matplotlib and Seaborn to analyze risk metrics and relationships between stocks.

A Long Short Term Memory (LSTM) model is trained on the time series data to forecast future prices. By encompassing data collection, cleaning, visualization, and modeling on a stock market data, this project highlights proficiency in core data analysis and machine learning workflows.

5 Portfolio Projects for Final Year Data Science Students
Image from Project 4. Analyzing and Predicting Consumer Engagement

In the Analyzing and Predicting Consumer Engagement project, you'll use the Internet News and Consumer Engagement dataset from Kaggle to predict the most popular article and its popularity score. You'll analyze the data to find patterns, such as correlation, distribution, mean, and time series analysis. You'll use both text regression and text classification models to predict the engagement score and top article based on the title.

In this project, you will learn how to handle text data, perform text analysis using Python libraries, convert text into vectors, and build an LGBM Classifier model.

5 Portfolio Projects for Final Year Data Science Students
Image from Project 5. Evolution of Digital Learning During COVID19

In the Evolution of Digital Learning During COVID19 project, we will be using data analysis tools to figure out trends in digital learning and how it is effective towards improvised communities. We will be comparing districts and states on factors like demography, internet access, learning product access, and finance. In the end, we will summarize our report and point towards the areas that need our more attention to make education accessible for all students in the United States.

You will learn to use all of the major data analytics and visualization tools. It is also a guide for those who want to become creative in generating eye-catching visualizations for their presentation.

5 Portfolio Projects for Final Year Data Science Students
Image from Project Conclusion

Building a portfolio of data science projects enables beginners to demonstrate their technical skills and problem-solving abilities to potential employers. By showcasing competency across data collection, cleaning, analysis, modeling, and visualization, these projects can highlight one's proficiency in a data science workflow.

In this blog, we have reviewed five portfolio projects for final-year data science students. It covers data handling, manipulation, visualization, and modeling basics. To explore more projects, check out The Complete Collection of Data Science Projects – Part 1 and Part 2.
Abid Ali Awan (@1abidaliawan) is a certified data scientist professional who loves building machine learning models. Currently, he is focusing on content creation and writing technical blogs on machine learning and data science technologies. Abid holds a Master's degree in Technology Management and a bachelor's degree in Telecommunication Engineering. His vision is to build an AI product using a graph neural network for students struggling with mental illness.

More On This Topic

  • How to Ace Data Science Interview by Working on Portfolio Projects
  • 5 Advance Projects for Data Science Portfolio
  • 5 Python Projects for Data Science Portfolio
  • 7 Machine Learning Portfolio Projects to Boost the Resume
  • KDnuggets News, September 21: 7 Machine Learning Portfolio Projects to…
  • Data Scientists, You’re Invited: Make 2022 a Year of Continuous Improvement

L&T Finance is Certified as a Best Firm for Data Scientists

L&T Finance is certified as the Best Firm For Data Scientists to work for by Analytics India Magazine (AIM) through its workplace recognition programme.

The Best Firm For Data Scientists certification surveys a company’s data scientists and analytics employees to identify and recognise organisations with great company cultures. AIM analyses the survey data to gauge the employees’ approval ratings and uncover actionable insights.

“Our never-ending quest for excellence today has led to the prestigious award of the “Best Firm for Data Scientists” by Analytics India Magazine. By strategically aligning our policies and encouraging a competitive attitude, we stand tall now in the industry, which gives us great pride. It is the result of hours of hard-work, creative thinking, and a desire to push the limits in the field of data science. I’m proud of the outstanding accomplishment of our team. This recognition strengthens our resolve to keep up our position as an industry leader. I wish to thank Analytics India Magazine for giving us this opportunity to be a part of this survey and benchmarking us with the industry” said Abhishek Sharma, Chief Digital Officer at L&T Finance.

The analytics industry at AIM faces a talent crunch, and attracting good employees is one of the most pressing challenges that enterprises are facing.

The certification by Analytics India Magazine is considered a ‘Gold Standard’ in identifying the best data science workplaces and companies participate in the programme to increase brand awareness and attract talent.

Best Firms For Data Scientists is the biggest data science workplace recognition programme in India. To nominate your organisation for the certification, please fill out the form at this link.

The post L&T Finance is Certified as a Best Firm for Data Scientists appeared first on Analytics India Magazine.

Artisse can generate AI photos of you from prompts, templates or even a reference pic

Artisse can generate AI photos of you from prompts, templates or even a reference pic Sarah Perez @sarahintampa / 7 hours

Artisse is the latest AI photo creation app to challenge the recently viral app Remini and others by allowing users to generate AI photos of themselves by first uploading a series of selfies. However, Artisee claims to improve on the current crop of AI photo apps by offering a broader range of both input and output capability and more realism in the resulting photos, even if set in fantastical realms.

Similar to other apps of its nature, users will upload 15 images of themselves to train the AI on their images. When the upload is complete, you can use either a text prompt or an image prompt to generate new AI photos of yourself. With the latter, you can opt to choose from a template or upload your own reference photo instead to generate photos of yourself in various settings, postures, and styles. When using templates, you can also modify images by tapping buttons to change the style or by adding additional prompts.

Under the hood, the company says it’s using its own property model but has incorporated best practices and elements from existing open source models and tools.

The company says it’s working to make the app more flexible in terms of diversity of body shape and skin tones — an area where other AI photo apps have fallen short, including Remini where many women complained they had been made much skinnier than in real life, or with larger chests. Artisse faces similar challenges.

The bootstrapped startup was founded by William Wu, who previously worked in investment and strategy with roles at McKinsey & Co. and Oaktree Capital. He said he was inspired to work on an AI app after seeing how many people had “perfect” photos of themselves posted to Instagram or on their dating profiles.

“But to be able to create these types of photos, you need to be privileged or to be able to afford it, a lot of patience and time, or a very high level of expertise,” Wu tells TechCrunch. For example, people would need to know how to take the photo or how to pose well, he explains. “With the arrival of AI, our goal is to make perfect personal photography accessible to everyone, no matter your background situation, or experience level. Everyone should be able to create perfect photos of themselves,” Wu says.

In practice, the app takes much longer to process the photos than others — roughly 30 to 40 minutes. This system, claims Wu, beats the competition in terms of the realism produced. In the app, users can also browse for inspiration from photos of either men or women in a variety of styles, poses, and backgrounds or they can upload a photo from their own library.

“Remini, which has a popular AI feature, has relatively low-quality photos, low input flexibility,” Wu notes, adding that its app requires users to select from a set of templates. Plus, he adds, it has low output flexibility as it involves mostly single-colored backgrounds.

Artisse currently offers the first 25 photos for free then charges around 20 cents per photo afterward. It plans to later launch a subscription model in the next release that will also include HD and sizing features. For B2B clients, Artisse is also offering a full end-to-end consulting style service including model selection, image generation, and post-production work which is priced based on time and later involved.

The app is a product from Hong Kong-based Mumu Labs and is currently bootstrapped, Wu says. But he notes the startup is in negotiations on a term sheet with a U.K.-based VC and in discussions with others.

Artisse is available on both iOS and Android, where it’s aiming to reach the roughly 800 million users of photo-editing apps. The company plans to release on the web next month.

Data Science Hiring Process at Digit Insurance

When it comes to insurance, prolonged delays in processing data and the need for human involvement in extracting and confirming information have posed significant obstacles since time immemorial. These manual procedures not only demand a hefty resource stack but are also error-prone, resulting in bottlenecks and operational inefficiencies. That is when Kamlesh Goyal’s full-stack insurance company Digit General Insurance came into the picture to address this challenge. Digit Insurance’s robust data platform enables real-time data processing that aids in decision-making, risk assessment, fraud detection, and customer engagement.

“Technology is the backbone of Digit and over the years we have embedded various tech innovations into the systems that have aided in a complete overhaul of how insurance products are experienced by Indian customers today” Vishal Shah, head of data science, Digit General Insurance told AIM.

And to make this possible, Digit Insurance boasts a big AI and analytics team with over 130 employees distributed across distinct divisions such as analytics, data science, business analysis, and API Integration.

Based in Bengaluru, the general insurance firm achieved unicorn status in 2021, a mere five years following its launch, thanks to a $255 million funding round led by General Atlantic and Multiples Private Equity. It is also backed by the likes of Sequoia Capital India, Fairfax Group and TVS Capital Funds.

AIM got in touch with Shah and Amrit Jaidka Arora, chief of human resources, Digit to understand their data science applications, hiring process, work culture and more.

Currently Hiring

Digit Insurance is expanding its data science team and is looking to hire AI/ML engineers and BOT developers. They are also looking for data engineers (data warehousing and data lake teams) as well as visualisation developers. Furthermore, they are actively seeking individuals with a robust understanding or a strong passion for insurance and API Integration to join their team in a Business Analyst + Technology-oriented role.

Inside Digit’s AI & Analytics Lab

The organisation leverages AI and ML extensively in its operations, with a focus on its robust data platform that securely stores diverse structured and unstructured data. This platform integrates data from various sources, like customer interactions and transaction records, for analysis, particularly crucial for real-time applications like fraud detection. Data engineers play a pivotal role, in ingesting and transforming data through ETL processes, ensuring quality, and optimising query performance.

“The team also uses NLP to streamline document processing, reducing turnaround times and aiding in fraud detection. Their AI-powered chatbots reduce query resolution times, while computer vision expedites pre-inspection for vehicles and enhances four-wheeler claims assessment accuracy,” added Shah.

They also harness its extensive datalake for ML algorithms, driving both one-time analysis and real-time solutions based on insights derived from the data.

Tech Stack

The team primarily uses SQL, Postgres, No-SQL database, Python either through Jupyter Notebook or Visual Studio. Various frameworks like TensorFlow, PyTorch, Hugging Face, NLTK, spaCy, are also used in our processes.

Transformer or GPT models are often employed for natural language processing tasks like chatbots or sentiment analysis.

“When it comes to generative AI, we have initiated pilots on various use cases including chatbot, help desk and more. We are also evaluating various LLM for their efficacy in providing the results,” commented Shah.

Addressing Ethical AI

The adoption of AI in the insurance and financial sector presents significant ethical and regulatory challenges.

According to Shah, the key concern revolves around safeguarding user data privacy and confidentiality, especially when extracting information from customer documents. Compliance requirements necessitate transparent data handling and storage practices, including clear disclosure of data processing and usage procedures.

Additionally, mitigating model bias is crucial to prevent unfair or discriminatory outcomes. Complying with regulations, particularly in sectors like insurance, demands transparency in decision-making processes, compelling organizations to articulate how their AI models arrive at decisions and predictions to maintain compliance. Addressing these challenges involves robust data protection measures, bias mitigation strategies, and transparent model explanation practices.

Interview Process

“The interview process at Digit begins with an initial round of discussions, either conducted internally or outsourced, aimed at evaluating the candidate’s qualifications. Following this, candidates are given a case study or assignment that assesses their core skills. The final technical discussion is built upon the results of this assessment. Lastly, a third and final round takes place, during which HR conducts an offer discussion with the candidates.

Digit’s hiring process for data science roles involves a focus on four distinct tech sub-departments: Data Science (encompassing AI, ML, and BOT), Analytics (involving Data Engineering and Data Visualization), API Integration, and Business Analysis. For these roles, we seek candidates with a diverse skill set that includes proficiency in Python, SQL, PL, SQL, Qlik Sense, NLP, and Computer Vision.

But what is the common mistake that candidates often make?

“Candidates often miss reading or understanding the JD in detail and apply for roles that are not similar to the profile mentioned. Though their CV would mention some of the skills, if they have not worked in-depth on some of the core skills we are looking at, clearing the interview and technical rounds can be tough,” Amrit Jaidka Arora, CHRO, Digit General Insurance told AIM.

Expectations

When joining the data science team at Digit, candidates are introduced company culture that is both flexible and transparent, providing a plethora of opportunities for growth and development.

“We are known for our diversity, offering the chance to collaborate on significant, scalable projects and engage in cutting-edge initiatives at the forefront of data-driven decision-making, thereby gaining valuable experience in emerging technologies,” said Arora.

In return, Digit expects candidates to possess strong coding skills, a robust logical and analytical mindset, and relevant experience aligned with the job descriptions. Candidates should also be prepared to thrive in an agile and dynamic work environment.

Work Culture

“In 2017, we started as the 27th General Insurance Company, knowing the tough competition and industry norms but we saw it as a chance to change the insurance sector. Our approach focused on creating a lasting culture that matches our goal of simplifying insurance. We value challenging conventions and transparency, promoting a positive workplace,” said Arora.

Digit aims to create an open culture based on four key principles. The first is ownership, where employees adopt an owner mindset and take responsibility for addressing feedback and collaborating to improve. Second is people relations, emphasising treating everyone with respect and empathy. The third principle is ‘evolve’, highlighting the importance of continuous growth, learning, and mutual support in achieving their mission. Lastly, they embrace a ‘no hierarchy philosophy’, promoting accessibility and equality among all employees, fostering a flat organisational structure to encourage simplicity and inclusivity.

In terms of perks and benefits, Digit offers a comprehensive package to its employees, which includes ESOP, various insurance coverage, attendance bonuses for specific departments, health and wellness benefits, relocation support, study assistance programs, car lease support, creche facilities, and referral bonuses and many more.

“So if have the skills and drive to deliver rapid, innovative, and intelligent solutions while efficiently collaborating with colleagues and customers with cognitive solutions, Digit Insurance is your ideal for success,” concluded Arora.

Read more: Data Science Hiring Process at Dream11

The post Data Science Hiring Process at Digit Insurance appeared first on Analytics India Magazine.

Building a Formula 1 Streaming Data Pipeline With Kafka and Risingwave

Building a Formula 1 Streaming Data Pipeline With Kafka and Risingwave

Real-time data has arrived and is here to stay. There’s no doubt that every day the amount of streaming data increases exponentially and we need to find the best way to extract, process, and visualize it. For instance, each Formula 1 car produces around 1.5 terabytes of data through a race weekend (source).

In this article, we are not going to stream the car’s data, but we will be streaming, processing, and visualizing the race’s data simulating we’re live on a Formula 1 race. Before we get started, it’s important to mention that this article will not be focused on what each technology is, but on how to implement them in a streaming data pipeline, so some knowledge about Python, Kafka, SQL, and data visualization is expected.

Prerequisites

  • F1 Source Data: The Formula 1 data used in this data streaming pipeline was downloaded from Kaggle and can be found as Formula 1 World Championship (1950 — 2023).
  • Python: Python 3.9 was used to build this pipeline, but any version greater than 3.0 should work. Further details on how to download and install Python can be found on the official Python website.
  • Kafka: Kafka is one of the main technologies used in this streaming pipeline, so it’s important to have it installed before you get started. This streaming pipeline was built on MacOS, so brew was used to install Kafka. More details can be found on the official brew website. We also need a Python library to use Kafka with Python. This pipeline uses kafka-python. Installation details can be found on their official website.
  • RisingWave (Streaming Database): There are multiple streaming databases available in the market, but the one used in this article and one of the best is RisingWave. Getting started with RisingWave is pretty simple and it only takes a couple of minutes. A full tutorial on how to get started can be found on their official website.
  • Grafana Dashboard: Grafana was used in this streaming pipeline to visualize the Formula 1 data in real time. Details on how to get started can be found on this website.

Streaming the Source Data

Now that we have all the prerequisites, it’s time to start building the Formula 1 data streaming pipeline. The source data is stored in a JSON file, so we have to extract it and send it through a Kafka topic. To do so, we will be using the below Python script.

Code by Author
Setting up Kafka

The Python script to stream the data is all set to start streaming the data, but the Kafka topic F1Topic is not created yet, so let’s create it. First, we need to initialize Kafka. To do so, we have to start Zookeper, then start Kafka, and finally create the topic with the below commands. Remember that Zookeper and Kafka should be running in a separate terminal.

Code by Author

Building a Formula 1 Streaming Data Pipeline With Kafka and Risingwave 
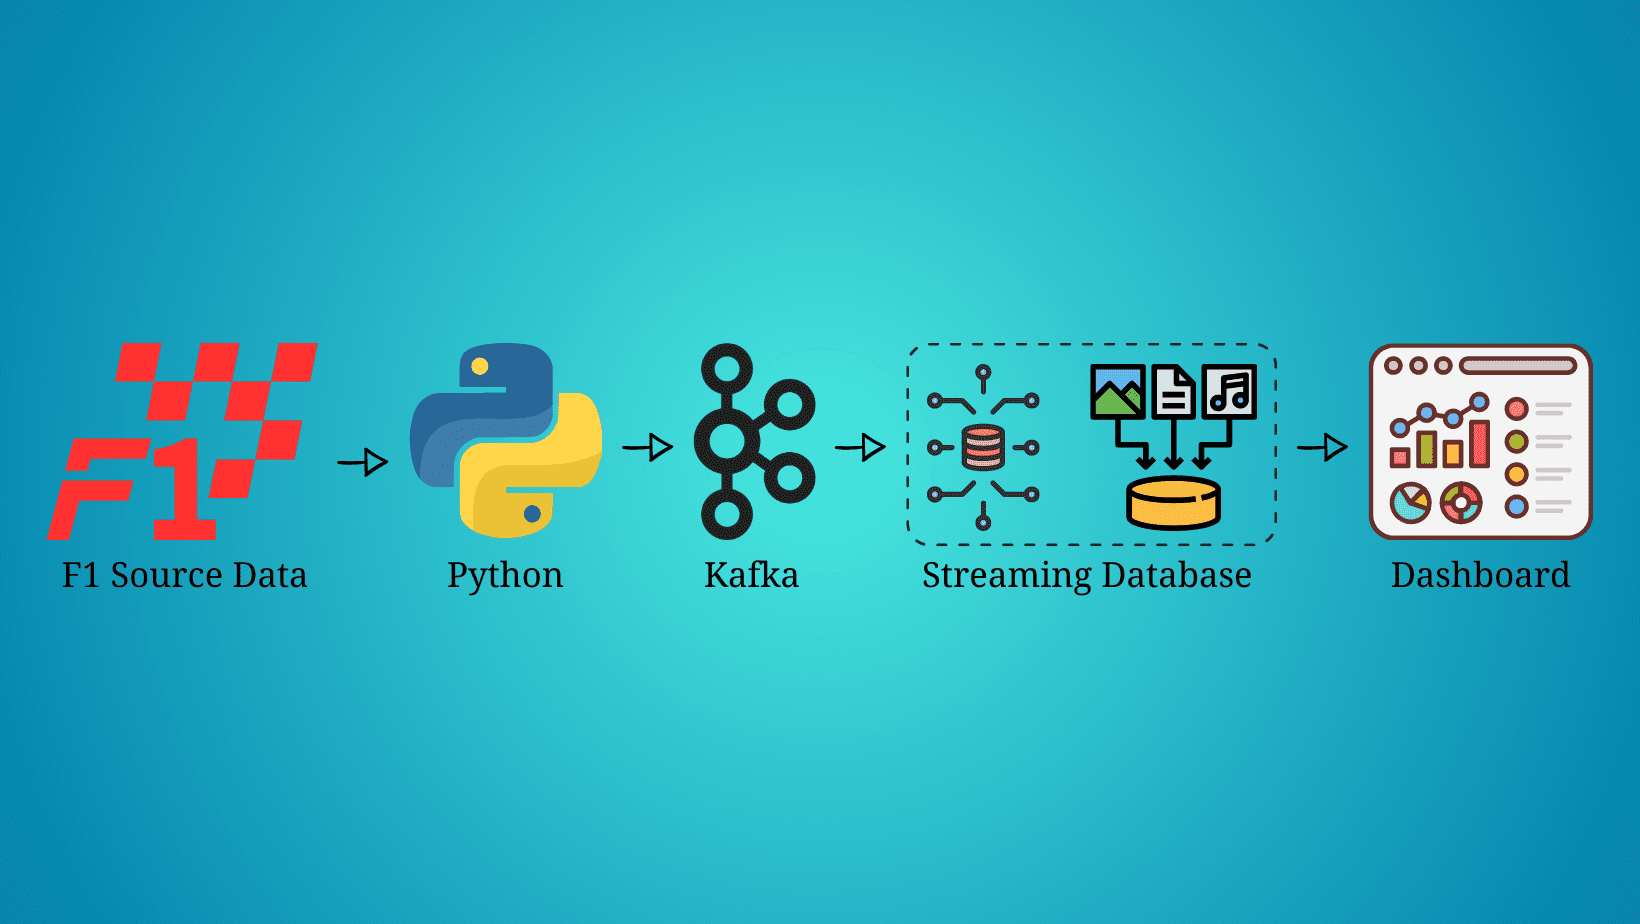
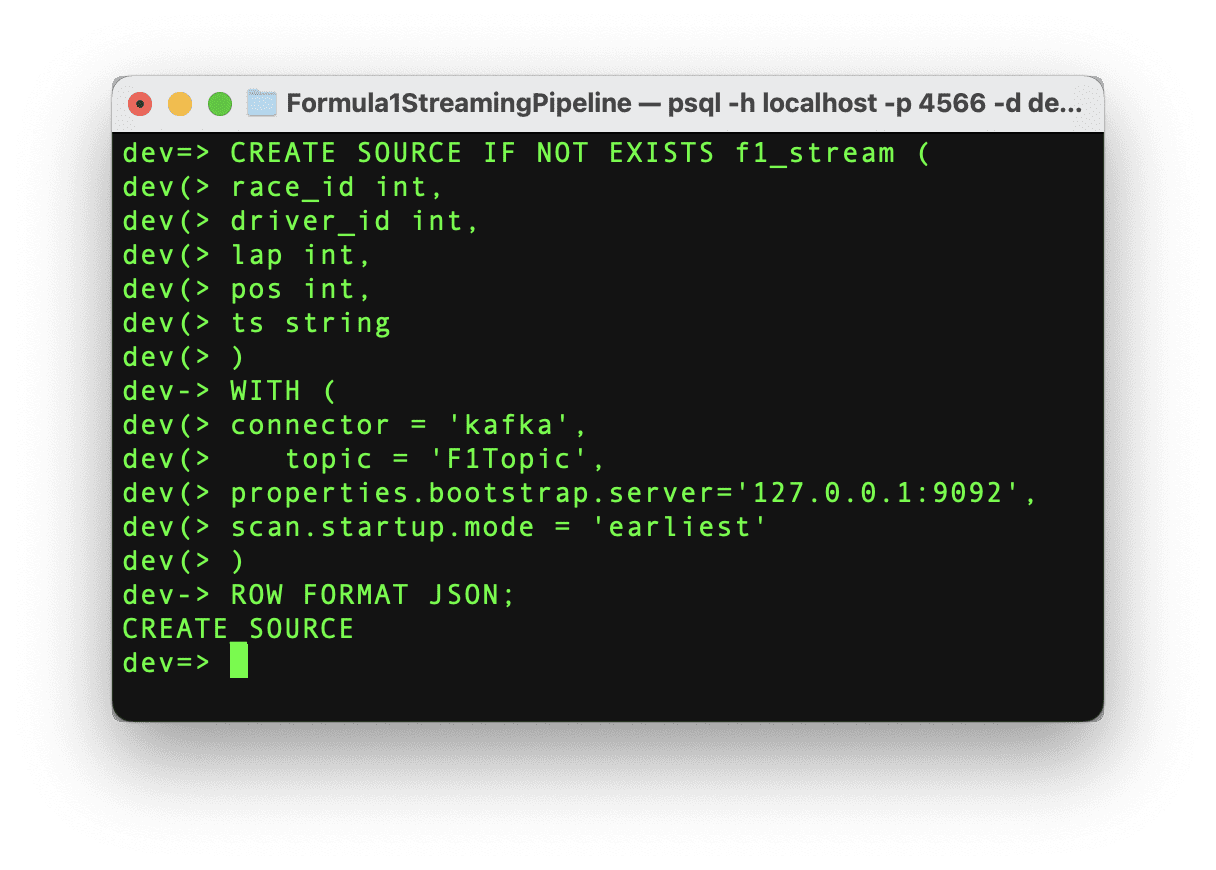
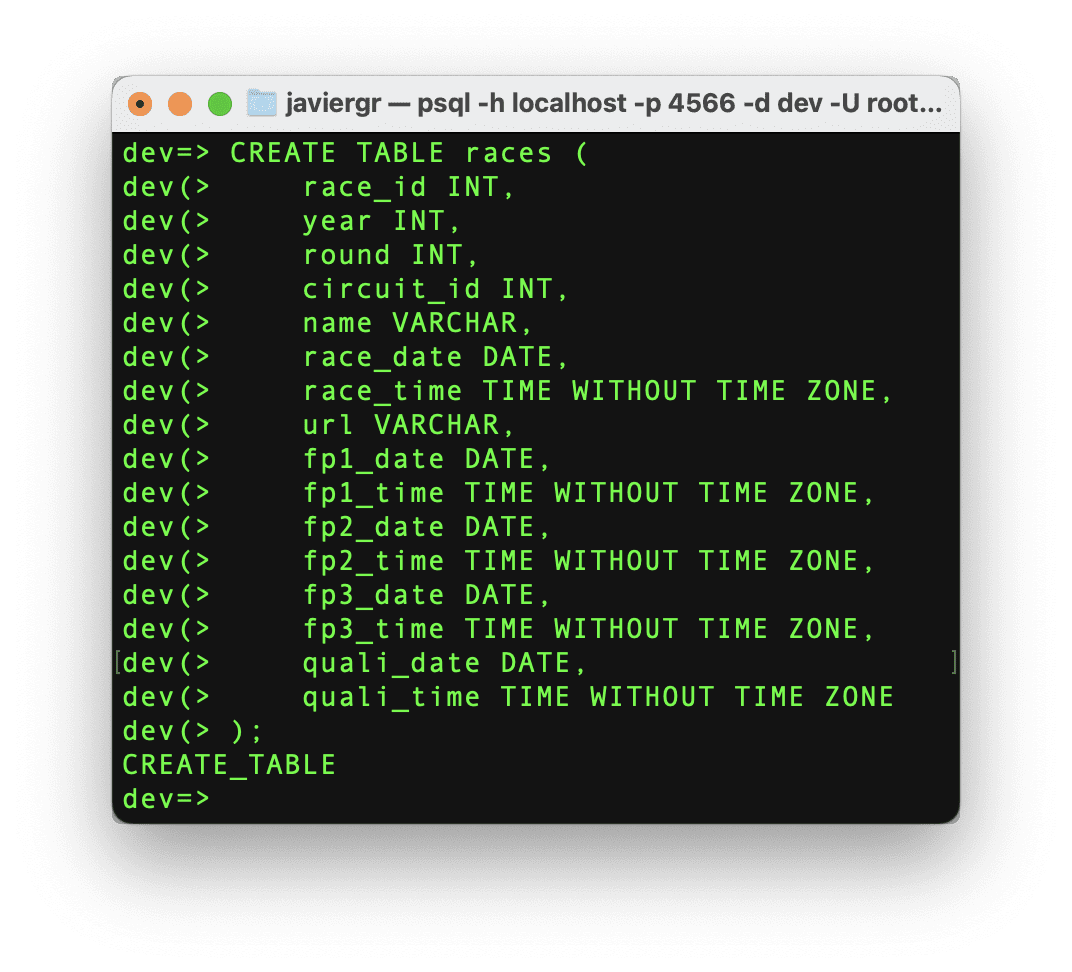
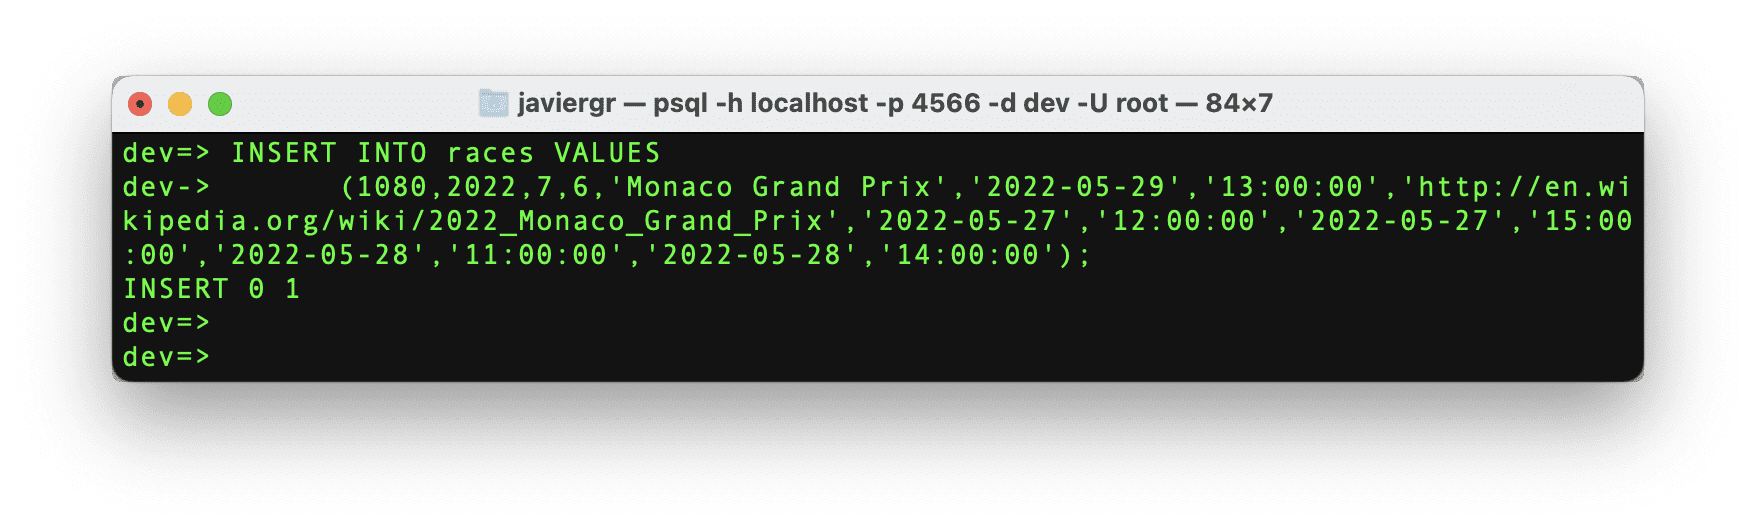
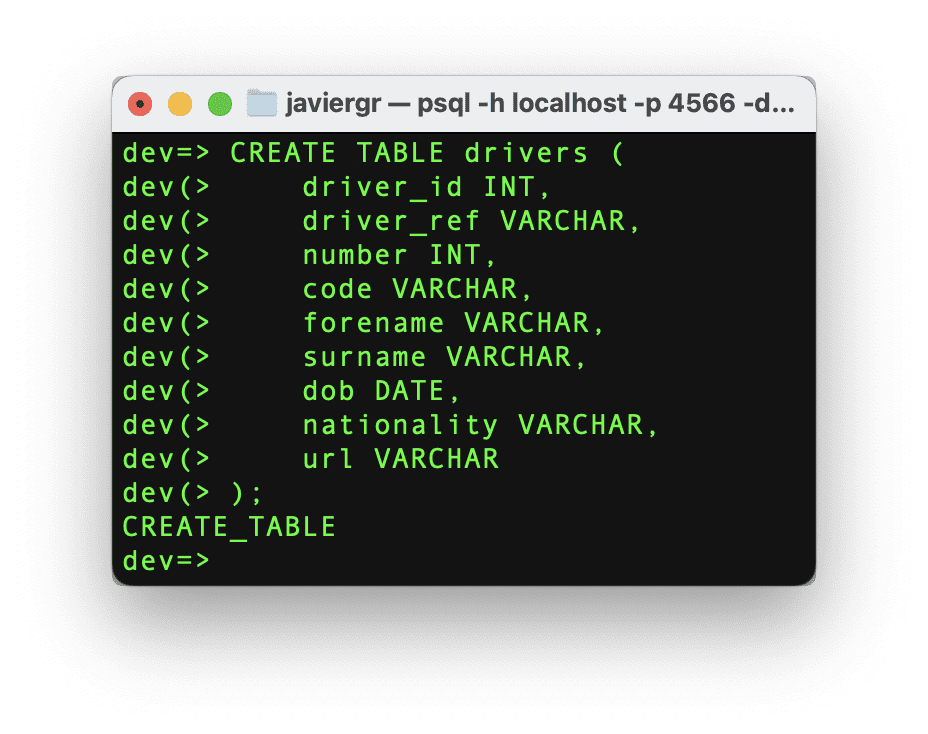
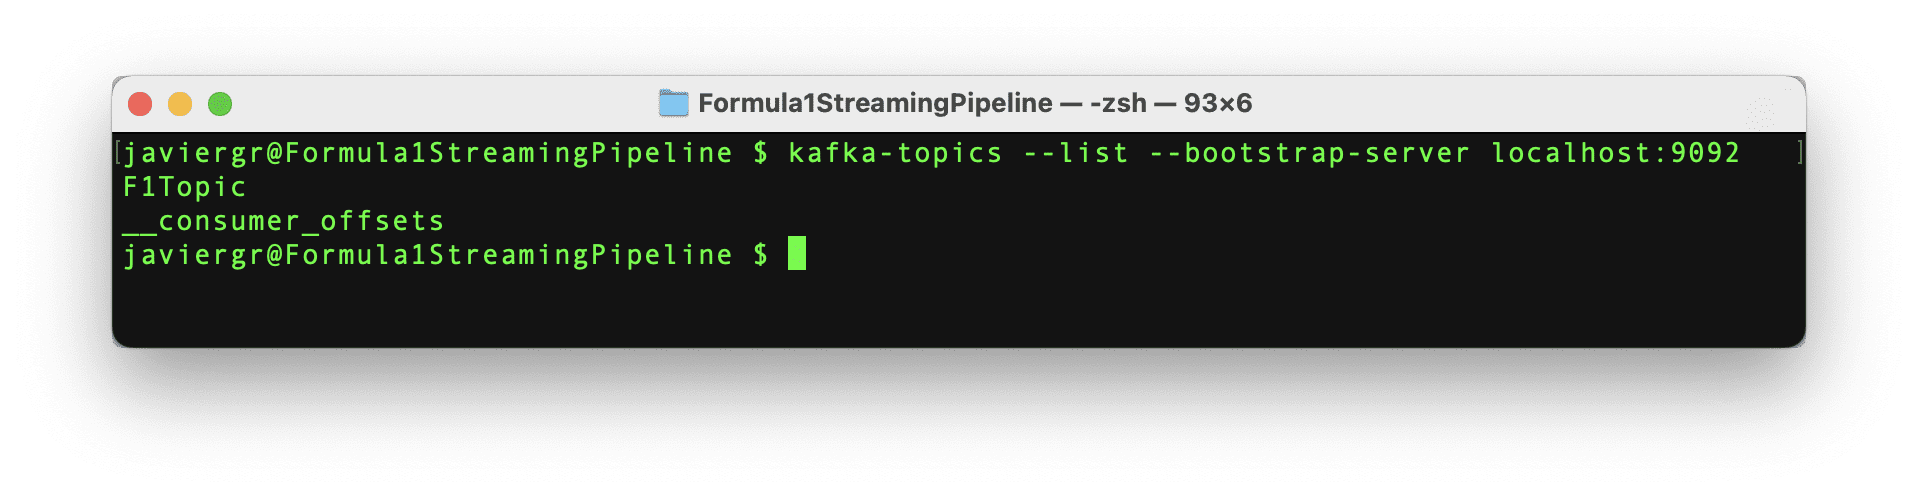
Setting up the Streaming Database RisingWave

Once RisingWave is installed, it’s very easy to start it. First, we need to initialize the database and then we have to connect to it via the Postgres interactive terminal psql. To initialize the streaming database RisingWave, we have to execute the below command.

Code by Author

The above command launches RisingWave in playground mode, where data is temporarily stored in memory. The service is designed to automatically terminate after 30 minutes of inactivity, and any data stored will be deleted upon termination. This method is recommended for tests only, RisingWave Cloud should be used for production environments.

After RisingWave is up and running, it’s time to connect to it in a new terminal via the Postgress interactive terminal with the below command.

Code by Author

Building a Formula 1 Streaming Data Pipeline With Kafka and Risingwave

With the connection established, it’s time to start pulling the data from the Kafka topic. In order to get the streaming data into RisingWave we need to create a source. This source will establish the communication between the Kafka topic and RisingWave, so let’s execute the below command.

Code by Author

Building a Formula 1 Streaming Data Pipeline With Kafka and Risingwave

If the command runs successfully, then we can see the message “CREATE SOURCE” and the source has been created. It’s important to highlight that once the source is created, the data is not ingested into RisingWave automatically. We need to create a materialized view to start the data movement. This materialized view will also help us to create the Grafana dashboard in the next step.

Let’s create the materialized view with the same schema as the source data with the following command.

Code by Author

Building a Formula 1 Streaming Data Pipeline With Kafka and Risingwave

If the command runs successfully, then we can see the message “CREATE MATERIALIZED_VIEW” and the materialized view has been created and now it’s time to test it out!

Execute the Python script to start streaming the data and in the RisingWave terminal query the data in real time. RisingWave is a Postgres-compatible SQL database, so if you are familiar with PostgreSQL or any other SQL database everything will flow smoothly to query your streaming data.

Building a Formula 1 Streaming Data Pipeline With Kafka and Risingwave

As you can see the streaming pipeline is now up and running, but we are not taking all the advantages of the streaming database RisingWave. We can add more tables to join data in real time and build a fully functional application.

Let’s create the races table so we can join the streaming data with the race table and get the actual name of the race instead of the race id.

Code by Author

Building a Formula 1 Streaming Data Pipeline With Kafka and Risingwave

Now, let’s insert the data for the specific race id that we need.

Code by Author

Building a Formula 1 Streaming Data Pipeline With Kafka and Risingwave

Let’s follow the same procedure but with the driver’s table.

Code by Author

Building a Formula 1 Streaming Data Pipeline With Kafka and Risingwave

And finally, let’s insert the driver’s data.

Code by Author

We have the tables ready to start joining the streaming data, but we need the materialized view where all the magic will happen. Let’s create a materialized view where we can see the top 3 positions in real-time, joining the driver id and the race id to get the actual names.

Code by Author

Last, but not least let’s create the last materialized view to see how many times a driver got the position number one during the whole race.

Code by Author

And now, it’s time to build the Grafana dashboard and see all the joined data in real-time thanks to the materialized views.

Setting up the Grafana Dashboard

The final step in this streaming data pipeline is visualizing the streaming data in a real-time dashboard. Before we create the Gafana dashboard, we need to create a data source to establish the connection between Grafana and our streaming database RisingWave following the below steps.

  • Go to Configuration > Data sources.
  • Click the Add data source button.
  • Select PostgreSQL from the list of supported databases.
  • Fill in the PostgreSQL Connection fields like so:

Building a Formula 1 Streaming Data Pipeline With Kafka and Risingwave

Scroll down and click on the save and test button. The database connection is now established.

Building a Formula 1 Streaming Data Pipeline With Kafka and Risingwave

Now go to dashboards in the left panel, click on the new dashboard option, and add a new panel. Select the table visualization, switch to the code tab, and let’s query the materialized view live_positions where we can see the joined data for the top 3 positions.

Code by Author

Building a Formula 1 Streaming Data Pipeline With Kafka and Risingwave

Let’s add another panel to visualize the current lap. Select the gauge visualization and in the code tab query the max lap available in the streaming data. Gauge customization is up to you.

Code by Author

Building a Formula 1 Streaming Data Pipeline With Kafka and Risingwave

Finally, let’s add another panel to query the materialized view times_in_position_one and see in real-time how many times a driver got the number one position during the whole race.

Code by Author

Building a Formula 1 Streaming Data Pipeline With Kafka and Risingwave 
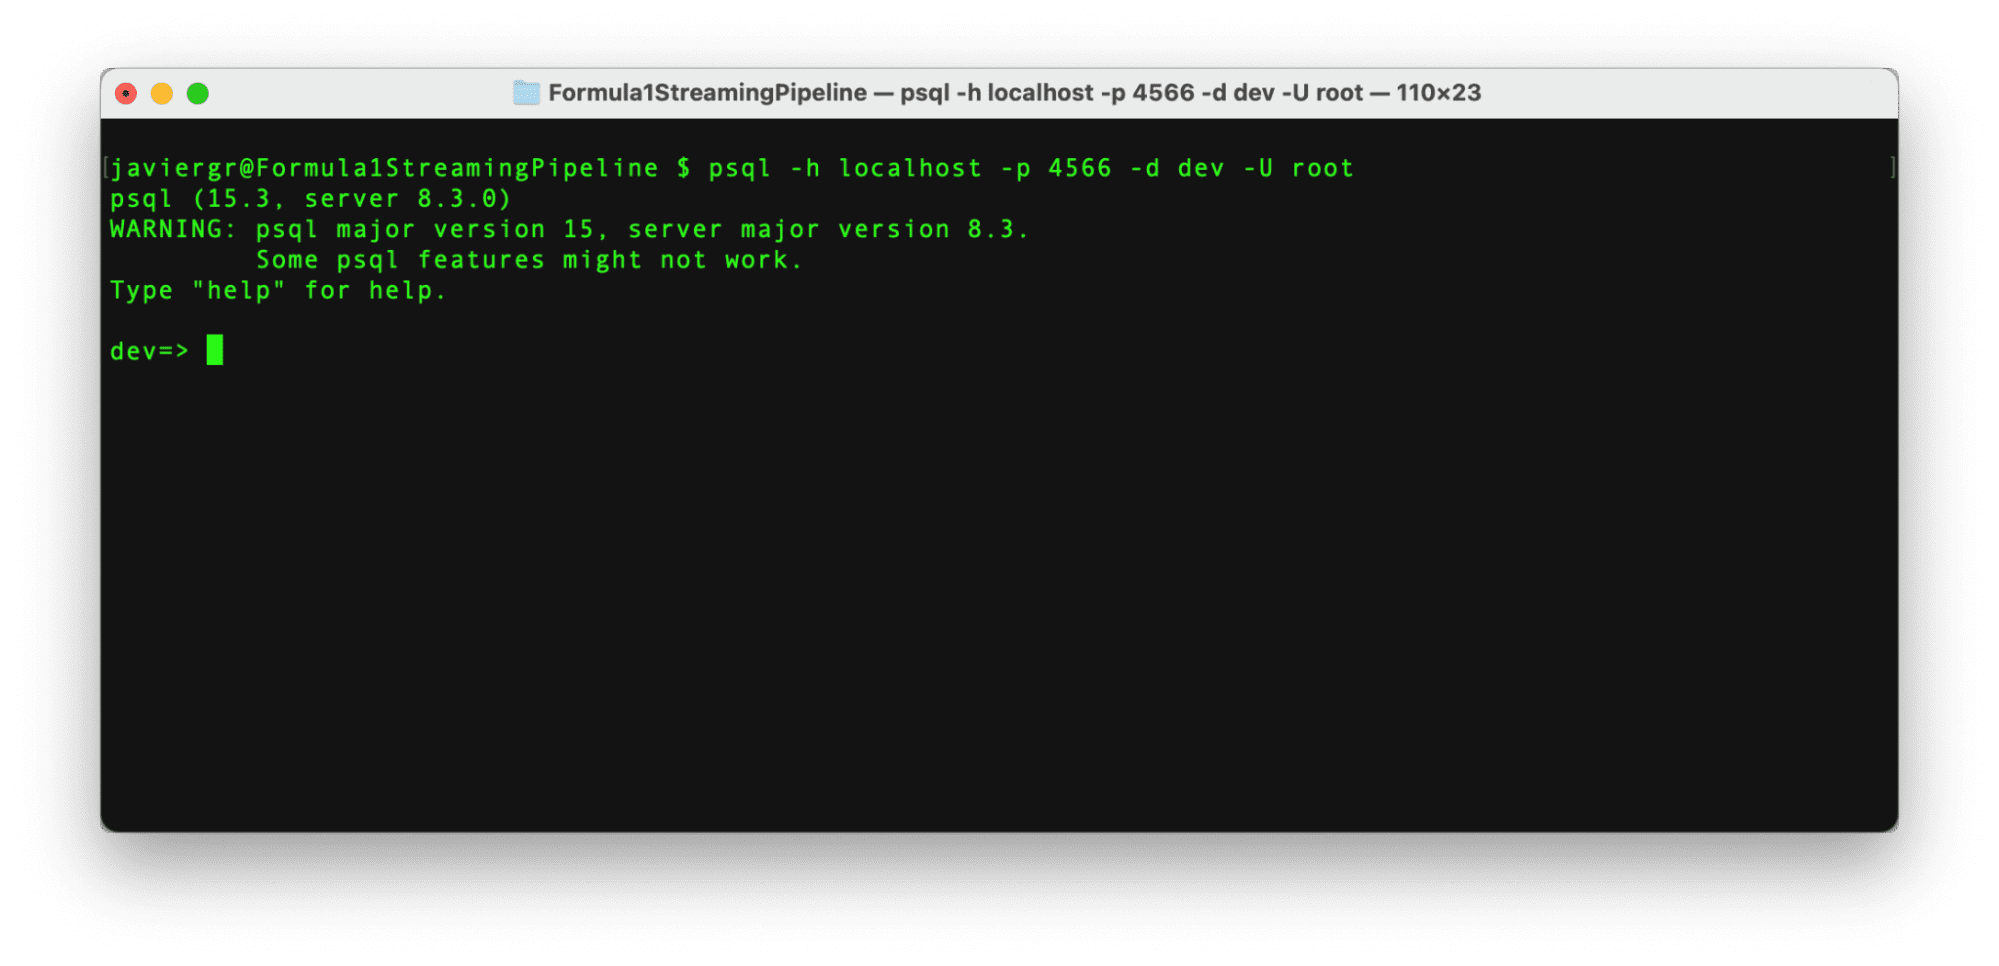
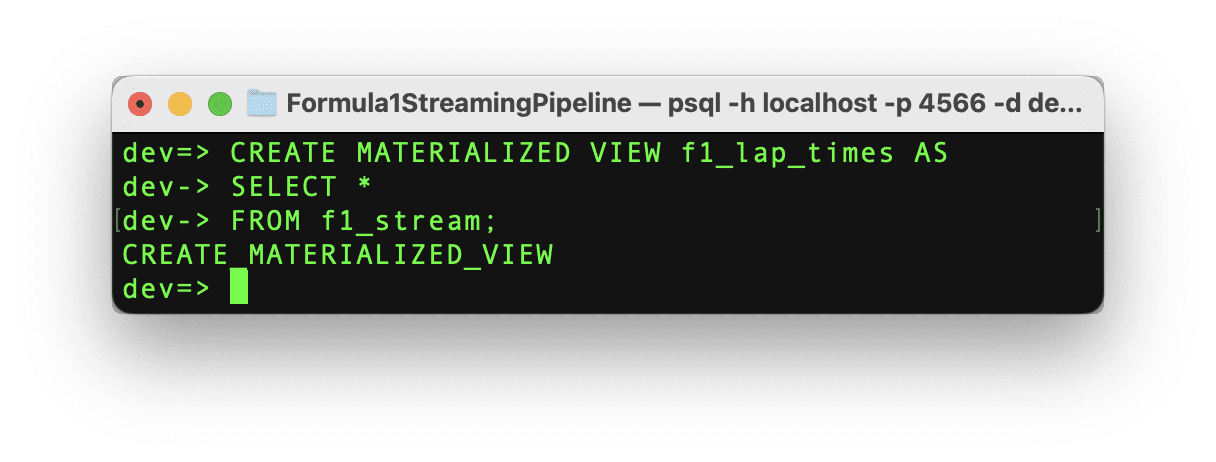
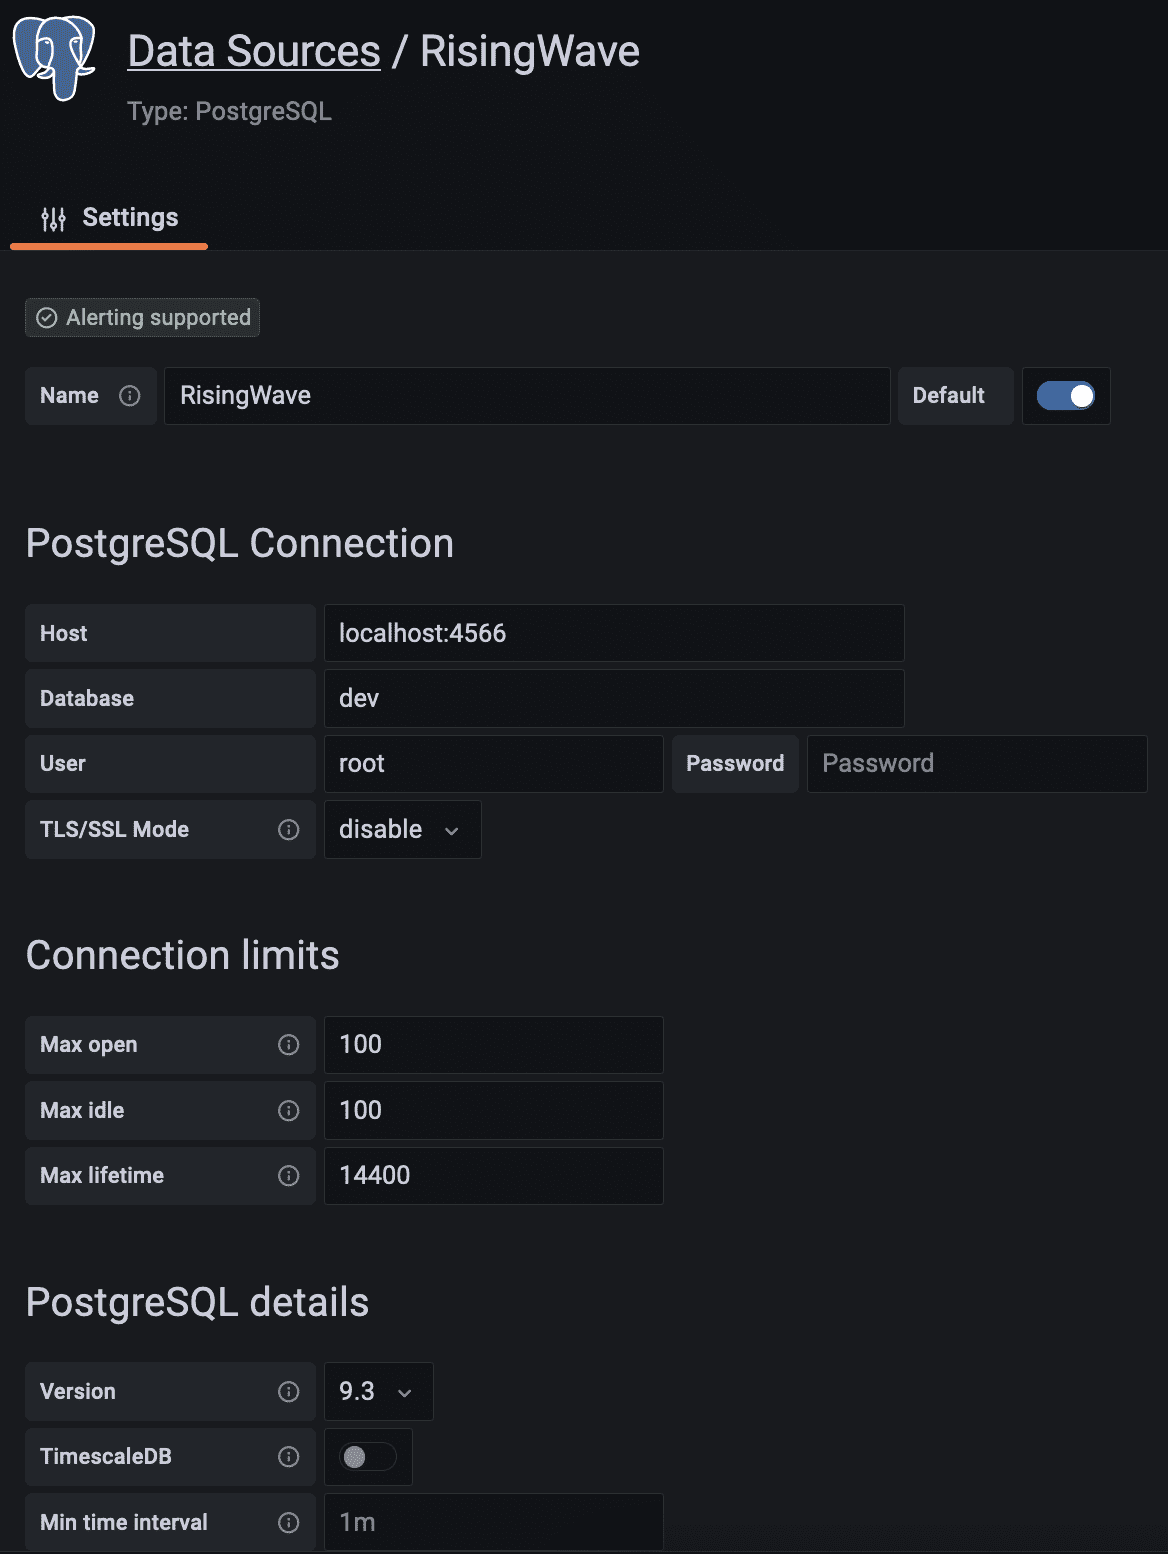
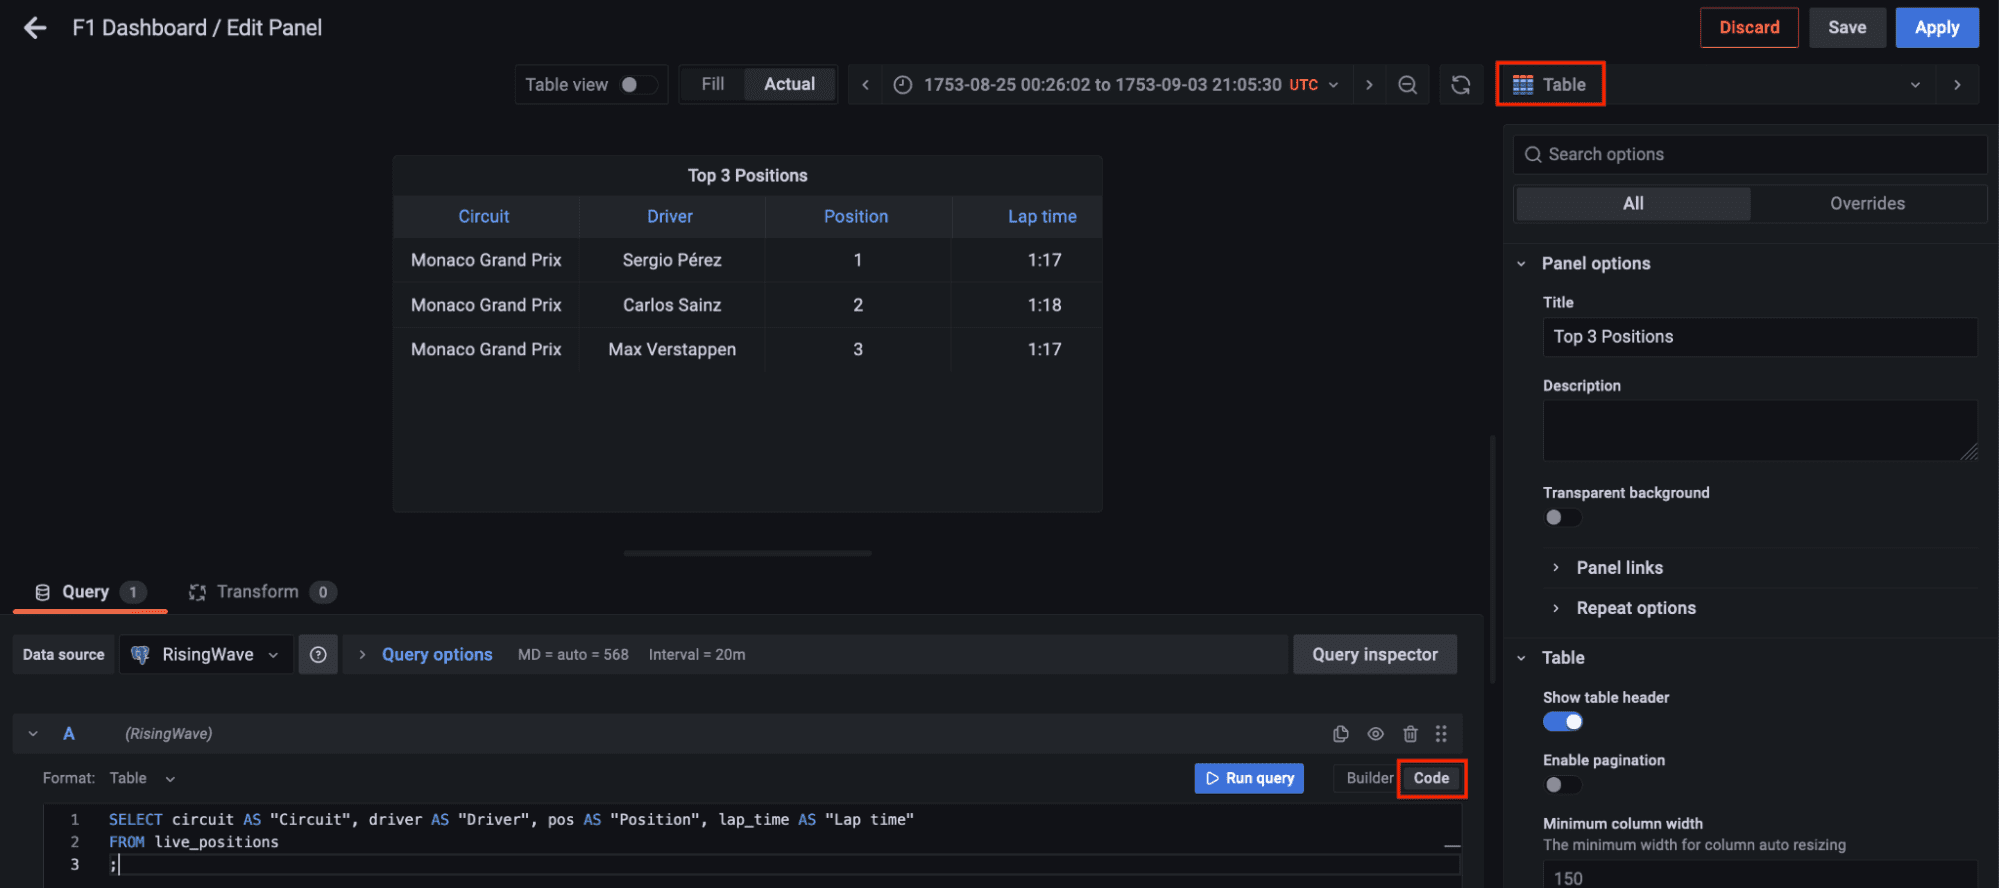
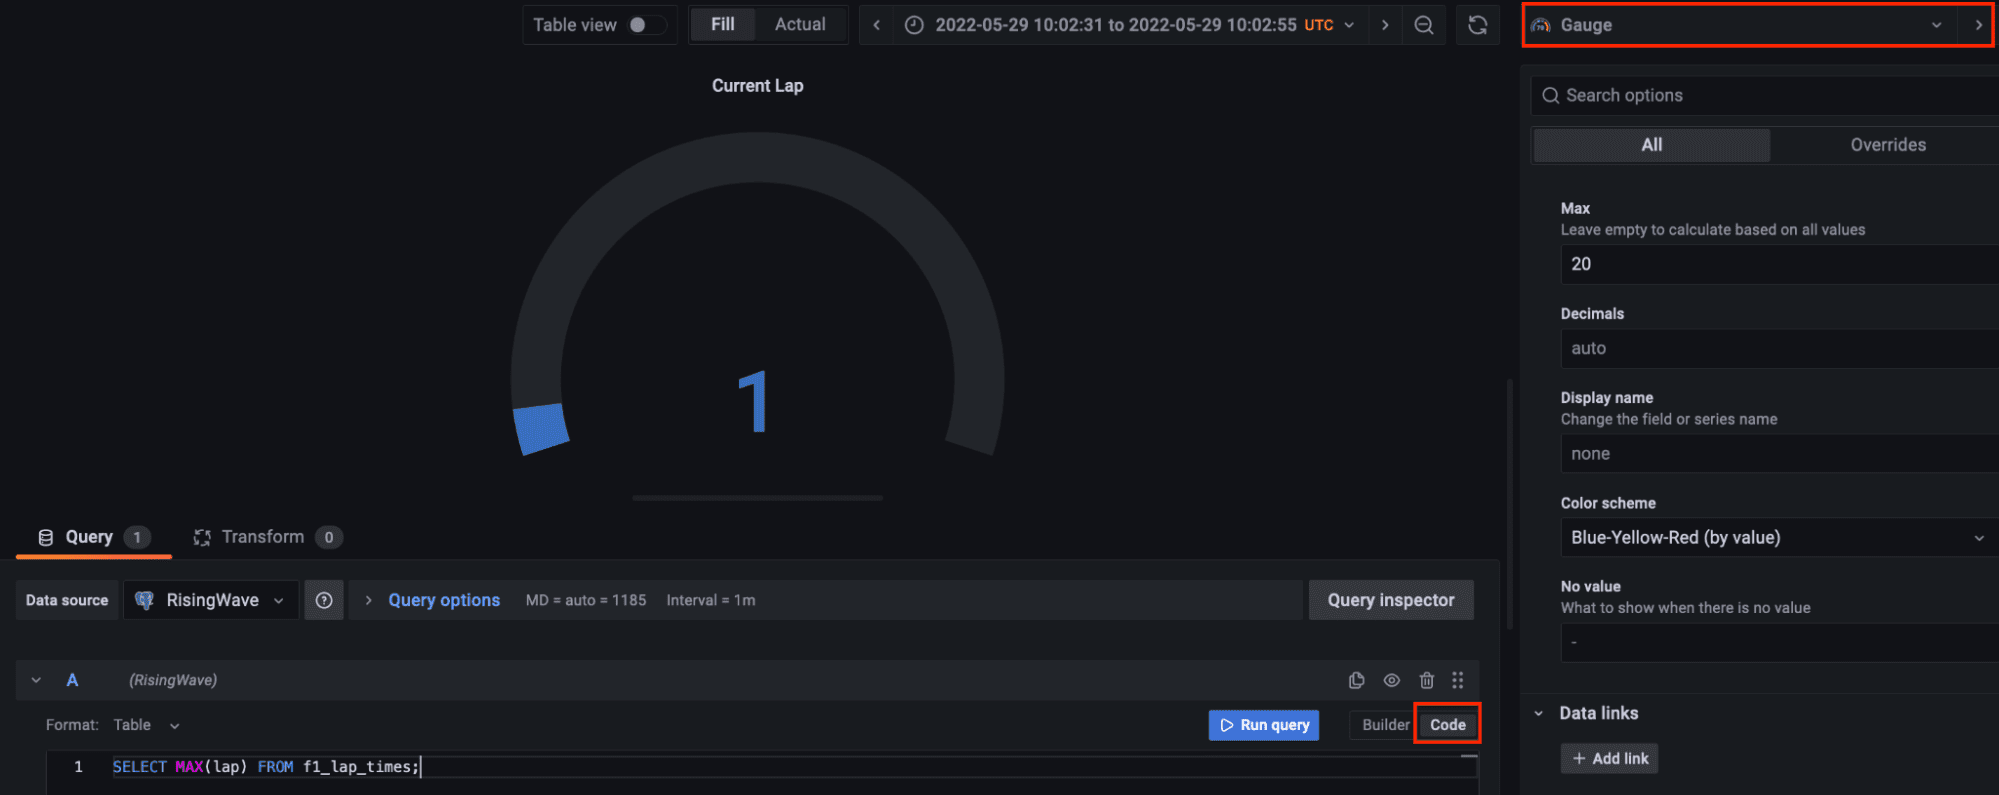
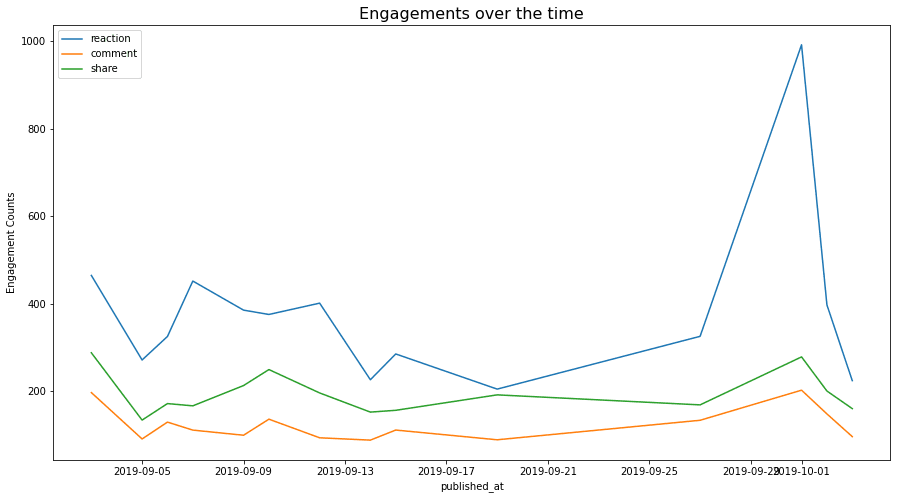
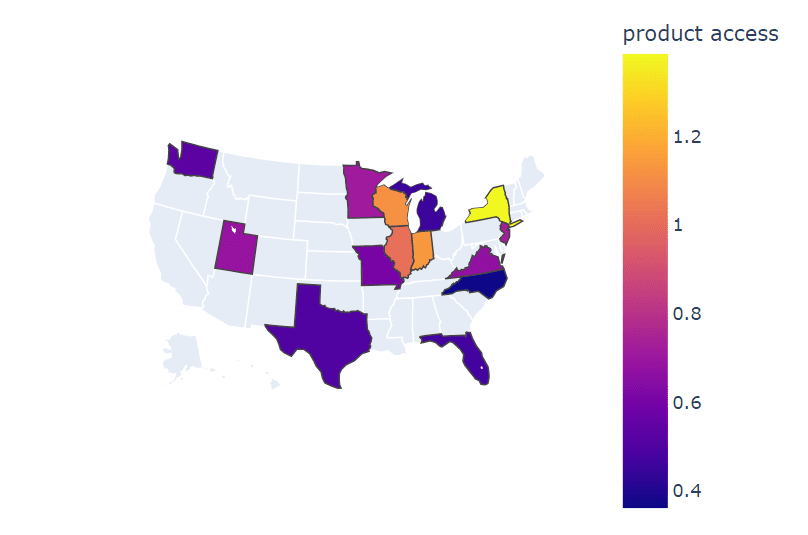
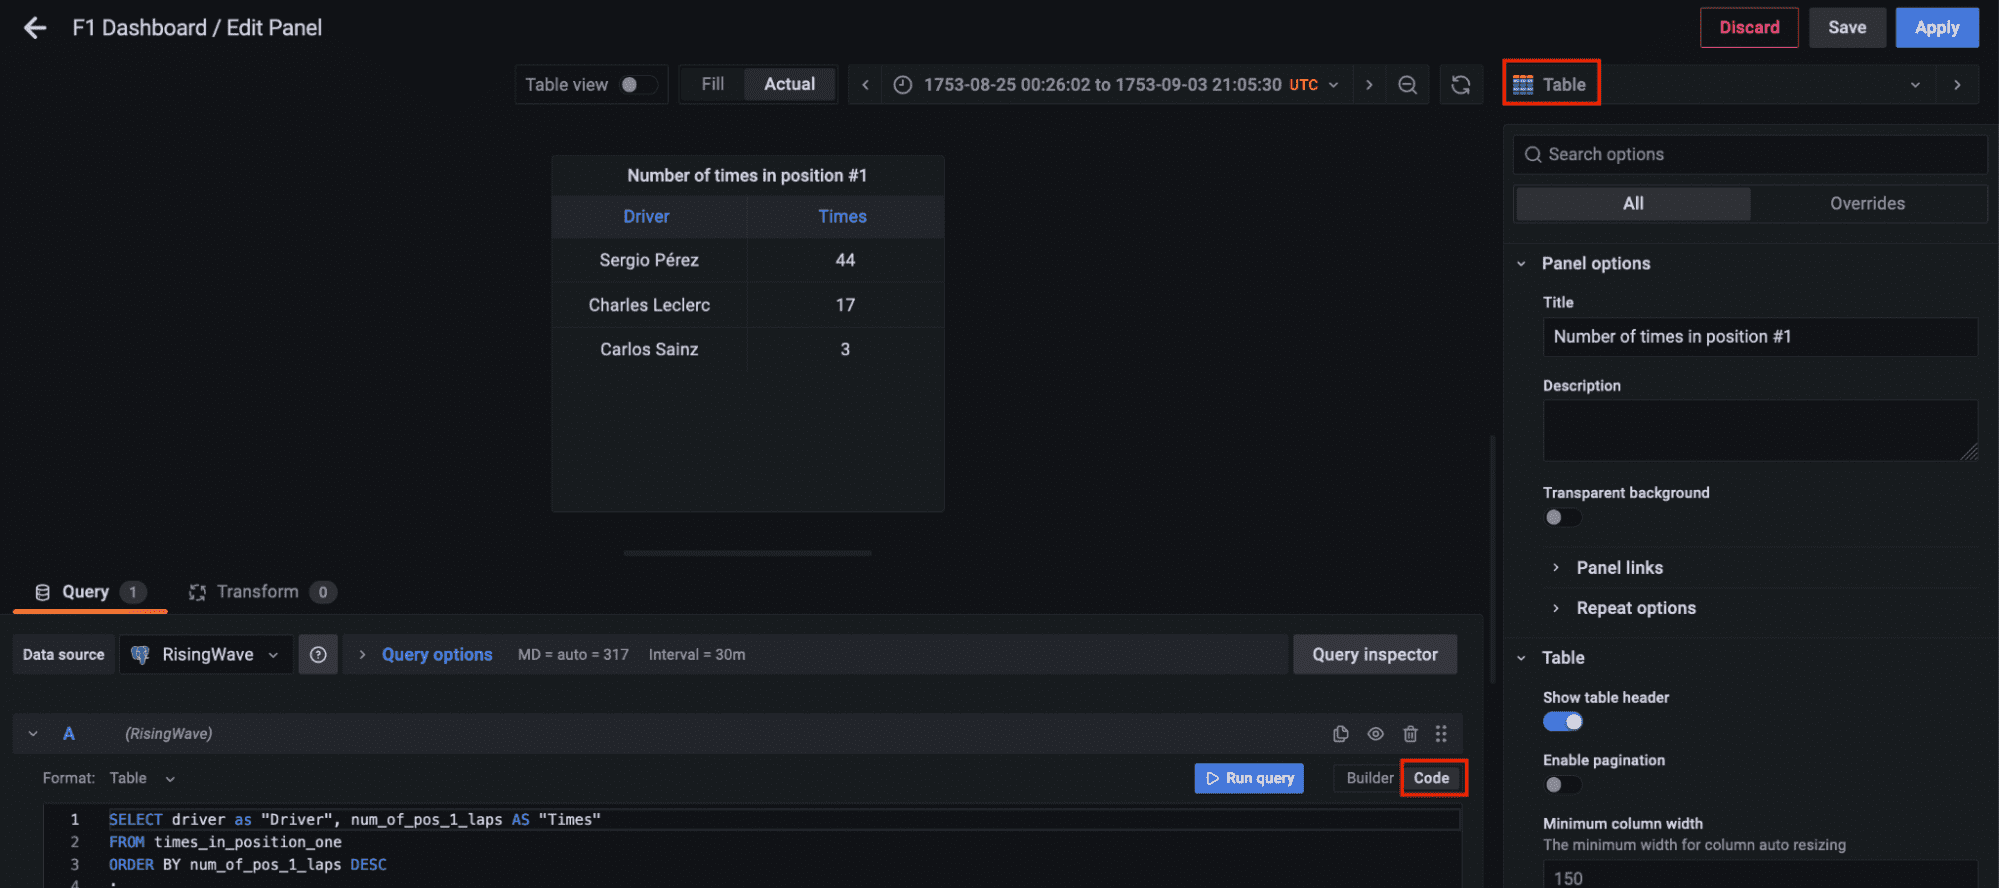
Visualizing the Results

Finally, all the components for the streaming data pipeline are up and running. The Python script has been executed to start streaming the data through the Kafka topic, the streaming database RisingWave is reading, processing, and joining the data in real-time. The materialized view f1_lap_times reads the data from the Kafka topic and each panel in the Grafana dashboard is a different materialized view joining data in real-time to show detailed data thanks to the joins done by the materialized views to the races and drivers tables. The Grafana dashboard queries the materialized views and all the processing has been simplified thanks to the materialized views processed in the streaming database RisingWave.

Building a Formula 1 Streaming Data Pipeline With Kafka and Risingwave

Javier Granados is a Senior Data Engineer who likes to read and write about data pipelines. He specialize in cloud pipelines mainly on AWS, but he is always exploring new technologies and new trends. You can find him in Medium at https://medium.com/@JavierGr

More On This Topic

  • How to Use Kafka Connect to Create an Open Source Data Pipeline for…
  • Building AI Models for High-Frequency Streaming Data — Part Two
  • Building a Tractable, Feature Engineering Pipeline for Multivariate Time…
  • How to Build a Scalable Data Architecture with Apache Kafka
  • Simple and Fast Data Streaming for Machine Learning Projects
  • How to Build a Streaming Semi-structured Analytics Platform on Snowflake

How to Choose When to Use Google Search or Google Bard

Google Bard, at first glance, seems similar to Google Search. Both offer a text input box. Both respond to keyword and natural language queries. Both draw on data from the internet in their responses.

But Bard and Google differ in major ways. Google bills Bard as an experiment that “won’t always get it right” in contrast to the long-established Google Search, which seeks to “connect you to the most relevant, helpful information.” Bard supports a string of related queries, so you can ask additional, related questions, unlike Google Search, which responds to each query as a distinct search. To delve into the differences further, explore these TechRepublic articles I wrote about Bard and Google Search strategies.

The following tutorial will help you determine whether Bard or Google Search is the tool best suited to serve your needs.

Visit Google Bard

Jump to:

  • What Bard does better than Google Search
  • What Google Search does better than Bard
  • Best options: Bard to generate, Google Search to validate

What Bard does better than Google Search

Google Bard (Figure A) is an experimental conversational, generative AI service that provides responses to prompts. It is based on a large language model developed by Google and can access internet information, unlike many other AI chat services.

Figure A

A screenshot of a conversation prompt of Google Bard.
Google Bard, a conversational AI service, provides plausible responses. Image: Andy Wolber/TechRepublic

Bard has at least the following four core capabilities that aren’t available with a standard Google search.

Need a summary? Select Bard

Give Bard a link to an article, and often it can deliver a cogent summary of the content. While Bard may not be able to summarize extremely long text or content stored in files (e.g., PDFs), the system often captures the key points of standard posts. Summarization is entirely outside the scope of a standard Google Search.

SEE: 3 Free Ways to Get an AI Summary of a Long Web Article (TechRepublic)

Want to write or code? Prompt Bard

Unlike a standard search, Bard can generate text such as an email, blog post, cover letter, marketing materials or even computer code. Prompt Bard with the context and explain the type of text you need, and it will often respond with readable, relevant and usable content. For example:

Draft a brief email with a friendly, informal tone for me explaining that the reader should enable 2-factor authentication for any website or service they use.

Treat the response as a draft. Don’t use the text until you review and revise it to make sure it reflects precisely what you wish to convey.

Seeking suggestions? Ask Bard

Bard excels at making suggestions. It works well when you want options for things to read, watch, listen to, buy, do or visit. Bard’s suggestions work best when you provide context. For example, when you want suggestions for a site for a business lunch, you might specify a location, type of food and price range. Similarly, if you want ideas for a new laptop, clarify your priorities (e.g., screen size, battery life or manufacturer) when you ask for options. Bard can also suggest captions for images you upload.

SEE: How to Use Google Bard (2023): A Comprehensive Guide (TechRepublic)

Have a task that requires a series of searches? Switch to Bard

Tasks that would take several steps with a standard search engine can be handled with a single prompt with Bard.

For example, consider the steps needed to produce a table that shows smartphone and computer adoption rates in the 10 most populous countries in the world. With a standard search, you’d either need to get lucky and locate this chart, or you’d need a series of searches: one for the largest countries by population, a few for smartphone adoption rates in each of those countries and another set of searches for computer adoption rates.

Bard can complete this sort of multi-step task with a single prompt:

Can you create a table of the 10 most populated countries in the world, with columns for the percentage of smartphone ownership and percentage of computer ownership in said countries?

Importantly, you can follow up with additional queries that reference, but don’t directly repeat, the initial inquiry. For example, continuing the conversation, you could next prompt:

Can you extend the chart to include the top 15 countries?

The system accurately identifies that you want the same core content but with five more countries added to the list. Export that table to Google Sheets, and you’re ready to review the data.

SEE: How to Use Google Bard With Google Sheets (TechRepublic)

What Google Search does better than Bard

Google Search (Figure B) responds to keyword and natural language queries with links and answers. It is based on Google’s systems developed initially by indexing content across the world wide web.

Figure B

A screencapture of a Google Search page.
Google Search seeks to serve accurate answers and links. Image: Andy Wolber/TechRepublic

Google Search results offer links; this makes it possible not only to evaluate the information provided but also to explore connected content directly instead of via a chat conversation.

Want a specific answer? Use Google Search

Google Search works great when you want specific information about news, weather, a company, a person, a place, a thing, etc. Unlike Bard, it also links to other Google services such as Google Maps, Flights and Shopping. For example, Google Search results for ways to get from Paris to Mexico City display dates, airlines and pricing. Bard’s response suggests bus and car options that aren’t feasible, along with possible plane and train routes.

Need to share or verify sources? Stick with Google Search for links

When you enter keywords or a natural language query on Google Search, you’ll likely get links to relevant resources along with possible “instant answers” and ads. Links are easy to explore and share with other people. Links also make it possible to evaluate the source of information; in contrast, Bard responses generate code or text content that might best be evaluated either by reviewing or running code or by a series of Google searches.

Best options: Bard to generate, Google Search to validate

Selective use of both Bard and Google Search allows you to make the most of each service’s strengths. Turn to Bard when you want a way to explore and generate suggestions, summaries, lists, code or text. Turn to Google Search when you seek reliable answers, resources and links.

Mention or message me on Mastodon (@awolber) to let me know how you leverage either Bard or Google Search in your work.

Google Weekly

Subscribe to the Google Weekly Newsletter

Learn how to get the most out of Google Docs, Google Cloud Platform, Google Apps, Chrome OS, and all the other Google products used in business environments.

Delivered Fridays Sign up today