Analytics and Data Science Jobs in India 2023 by AIM Research & Great Learning

Data has turned into the lifeblood of organizations across industries in today’s swiftly evolving digital landscape. Large volumes of data can now be collected, analyzed, and used to produce insights that enterprises can leverage. As a result, the demand for skilled professionals in the fields of Analytics and Data Science has skyrocketed.

For the year 2023, AIM Research in association with Great Learning has carried out a job study of specialists in analytics and data science in India. The research focuses on the trend of open positions across various industries, businesses, job functions, salaries, years of experience, cities, job roles, and work models.

The data for this report is based on AIM Research’s daily job tracker that collates data related to data science and analytics jobs from various job sites. To present a holistic study AIM Research has referred to several secondary data sources like job portals, news articles and other research databases. Secondary research also covers all public domain information, company websites, annual reports, whitepapers, marketing information, and press releases.

In comparison to the previous year, the research found a decline in the trend of open jobs for data science specialists in India.

Read reports from the previous years here:

2022 | 2021 | 2020 | 2019 | 2018 | 2017

The report highlights the availability of data science jobs across major cities. While cities like Pune, Hyderabad, and Delhi NCR have more positions for data scientists than ever before, there has been a declining demand for data scientists in Bangalore and Mumbai. The study also showed that industries like BFSI, healthcare, and retail & CPG have more need for data science specialists and MNC IT and KPO account for more job openings compared to other company types.

Overall, the research indicates that the number of vacant positions for data science professionals has decreased from the previous year, and that demand for these people is higher in specific industries, businesses, and degrees of experience. The research offers insightful information about the present job market in India for data science specialists.

Read the complete report here:

The post Analytics and Data Science Jobs in India 2023 by AIM Research & Great Learning appeared first on Analytics India Magazine.

Why OpenAI Needs To Be Singled Out in the Troubled Tech Valley 

AI models pretending to be humans come at the expense of everything you search, read or click on the internet. Whether it’s your Instagram photos, conversations with chatbots like Bing or emails, they all produce a trove of personal data for the big tech. Even though Silicon Valley has been feeding on the public’s data, fingers have been particularly raised at the celebrity — OpenAI — for its closed-door activities.

The Californian AI research lab released a 98-page technical report about GPT-4 earlier this year which was deemed not transparent or “open” in any meaningful way. The company run by Sam Altman did not disclose any details about the architecture (including model size), hardware, the magnitude of its dataset, or the training method, making it the most secretive release so far.

Emily M. Bender, a professor of Linguistics at the University of Washington, tweeted that this secrecy did not come as a surprise to her. “They are willfully ignoring the most basic risk mitigation strategies, all while proclaiming themselves to be working towards the benefit of humanity,” she tweeted.

Keeping it so hush-hush has made it unfair to people who are now finding it difficult to know whether their work has been scrapped. Moreover, it has become an impossible task to prove in court to prove their intellectual property and copyright – giving OpenAI a legal yet unfair advantage.

The paper received enormous backlash claiming that the company did not want to reveal the details to maintain its dominant position in the market. OpenAI is at fault — so are the rest of the company building these AI models to mimic the way humans work, play and create. We have just been taking these companies’ word for it — as a result, privacy is a mess.

Safe, private, and secure: theoretically

After some initial struggles, OpenAI got away from being outcast from Italy by providing limited controls. Even Google’s writing-helper Smart Compose, trained on the public’s Gmail data, is off by default as per European Union’s laws. Tech companies often have minute legal struggles now and then but eventually dodge the bullet either by compensating with penalties, finding a legal loophole, or tweaking the company’s guidelines here and there.

In less than a decade tech companies including Google, Apple, Meta, Apple, and Amazon have collectively received penalties of over $30 billion. Fines are not just a ‘cost of doing business’ for tech giants, the president of the French Competition Authority Isabelle da Silva declared publicly. “Fines are an element of the identification of what is wrong in the conduct,” Silva said.

A recent exposé by Geoffrey A. Fowler of The Washington Post, poses a thought-provoking question: “Which data of ours is and isn’t off limits? The investigative piece takes a deep dive at how the Valley companies are using your data and there’s not much you can do about it. He further notes much of the answer is wrapped up in lawsuits, investigations and hopefully some new laws. But meanwhile, big tech is making up its own rules.”

Drawing a line

The debate around tech companies and their Orwellian mass collection of data has been going on since the beginning of time. Their refusal to budge from these practices has often caused outrage, resulting in authorities (finally) stepping in.

Mozilla has launched a campaign calling on the software giant to come clean. “If nine experts in privacy can’t understand what Microsoft does with your data, what chance does the average person have?” the announcement note stated. As a part of the campaign 4 lawyers, 3 privacy experts, and 2 campaigners looked at software giant Microsoft’s updated Service Agreement, which will go into effect on 30 September. Surprisingly, none of the experts could tell if Microsoft plans on using your personal data.

Exactly a year ago, the Federal Trade Commission (FTC) announced an initiative to draft rules to crack down on what it considers to be “harmful commercial surveillance” or “the business of collecting, analyzing and profiting from information about people.” There has been no update on the case since then.

The tech companies are on a thin line between ‘making products better’ and theft. On a darker note, these AI companies have had a constant tussle with in-house and otherwise ethicists globally.

Even though OpenAI started as a non-profit champion it has become a part of the money-making circus in the Bay Area. The company’s darling ChatGPT has given enough reasons for artists and authors to drag the startup to court. But its tight-lipped approach has managed to give it leverage above the others. Ironically, Jack Clark, OpenAI’s former policy director OpenAI, said that rather than act like it isn’t there, “it’s better to talk about AI’s dangers before they arrive” when GPT-2 was released in 2019.

The post Why OpenAI Needs To Be Singled Out in the Troubled Tech Valley appeared first on Analytics India Magazine.

Closed Source VS Open Source Image Annotation

Closed Source VS Open Source Image Annotation

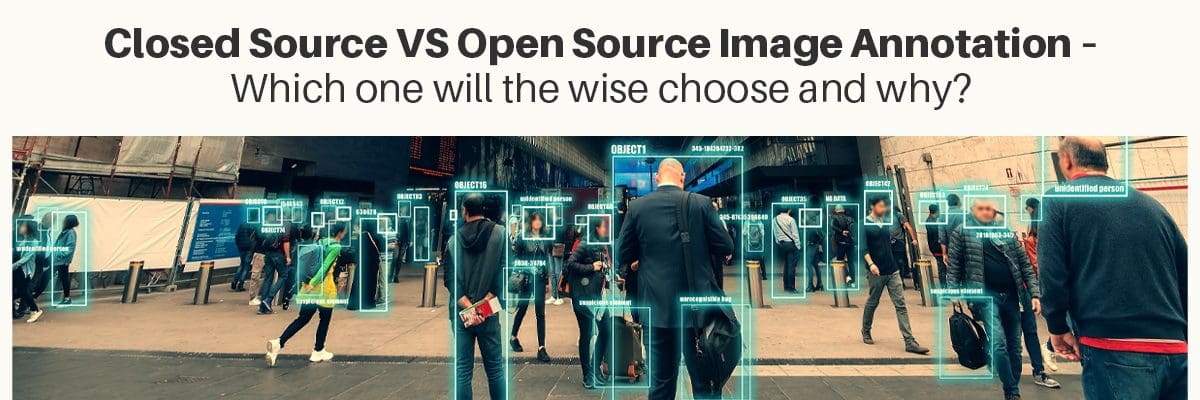
Could computers be trained to recognize cuteness in cats? What would you like to do then? Have trouble concentrating on cat pictures? Are you one of those tech enthusiasts who wants a change for your convenience? Do you remember when you tried to convince your computer that the stop sign wasn't a yield sign when you wanted it to believe it was one? This is no longer a concern for fellow technology enthusiasts. To keep yourself engaged and entertained during the annotation and labeling process, there is a plethora of open-source tools that you can choose from. The use of image annotation tools has emerged as a superhero in the world of pixelated chaos. Using annotation tools, images can be identified in a fast and efficient way. Therefore, machines will become capable of understanding the world the same way as humans do, and computer programs will be able to make better decisions.

The rapidly evolving digital world we live in has paved the path for the requirement of image annotation tools that are accurate, unbiased, and quick. From self-driving cars, medical, augmented reality, agriculture, and robotics, to e-commerce – the dependency on artificial intelligence is on the rise. Thus, the need for reliable and efficient image annotation sources is also increasing by leaps and bounds. In this article, we will draw a comparison between open-source and closed-source image annotation and cite real-life examples to come to a positive conclusion.

Accurate Image Annotation

As training data for AI models, image annotation is time-consuming, tedious, and well worth the effort since it is the key to algorithms' success. Each image must be annotated so that machines can read it correctly (without errors or bias). In order to develop error-free AI models of high quality, the image annotation process must be accurate and precise in nature. As a result, the output we receive is unbiased, accurate, and precise to say the least.

Pros: The Power of Open Source Image Annotation Tools

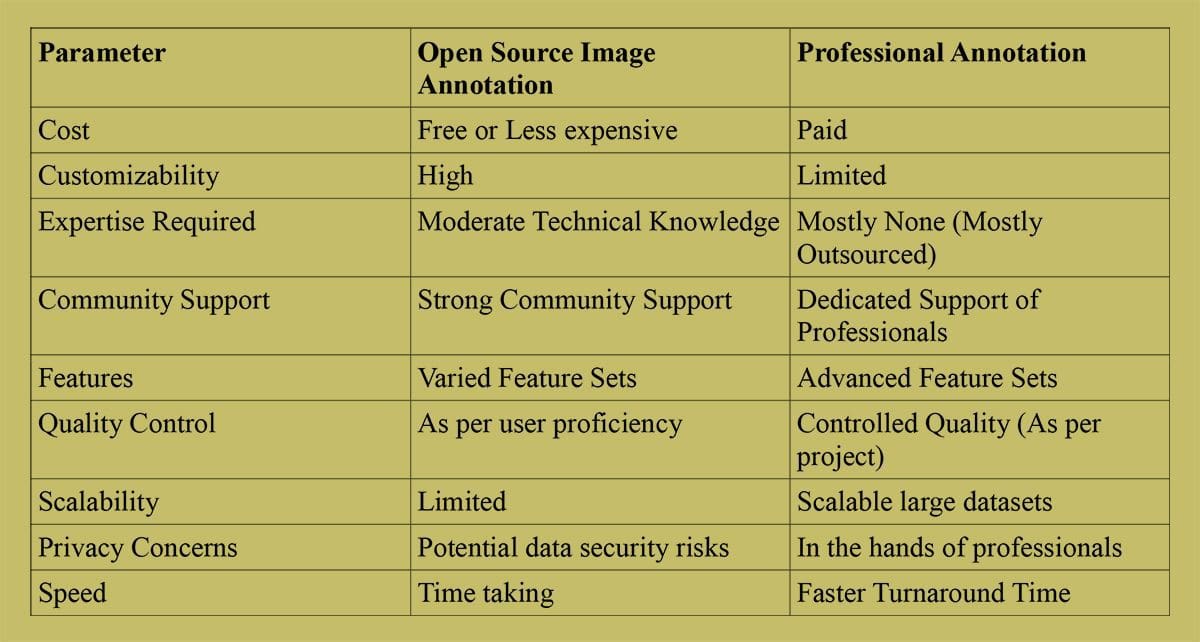
Doubtlessly, image annotation via open sources is gaining popularity because of affordability, easy access, and customization facilities. As most open sources are continuously in the improvement stage, it is luring users to get the free add-ons.

Cons: Challenges of Open-source Image Annotation

Though the thought of free or less expensive tools might be enticing initially. Open-source might only be a temporary pilot tool for those who care about scalability, innovation, and continuous development. On top of this, not all open-source tools are capable enough to produce high-quality outputs. The more precise the annotation and labeling of each image or video, the better off you will be if you are actually trying to transform traditional practices through AI.

Annotating Images Accurately: Tools & Techniques

Be it via open-source or closed-source tools. Image annotation is imperative to enhance the capability of machine learning algorithms to ensure they precisely identify and interpret data in visual form. When images are annotated by the book, AI models are able to function properly and recognize objects, regions, and features presented by images.

Closed Source VS Open Source Image Annotation Some examples of Open-source Annotation Tools

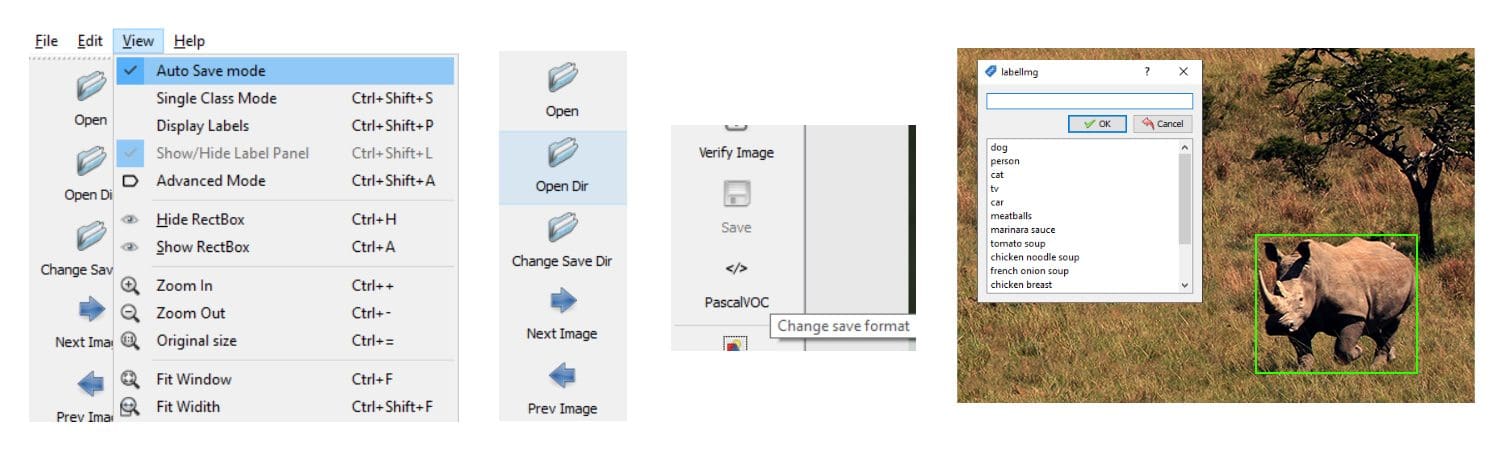
LabelImg is a used tool for annotating images, allowing users to draw bounding boxes around objects and add labels. It is implemented in Python using the Qt library. Here’s a repository — https://github.com/tzutalin/labelImg

Closed Source VS Open Source Image Annotation

Once you install LabelImg and have a set of images ready to be annotated – you can use the below-mentioned python script to open Labellmg for every single image. The annotated images will be saved as XML files.

## https://github.com/tzutalin/labelImg    import os  import subprocess    image_dir = "/path/to/your/image/directory"    # List all image files in the directory  image_files = [f for f in os.listdir(image_dir) if f.endswith(".jpg") or f.endswith(".png")]    # Path to LabelImg executable  labelimg_executable = "/path/to/labelImg.py"    # Loop through the image files and open LabelImg for annotation  for image_file in image_files:      image_path = os.path.join(image_dir, image_file)      subprocess.call([labelimg_executable, image_path])

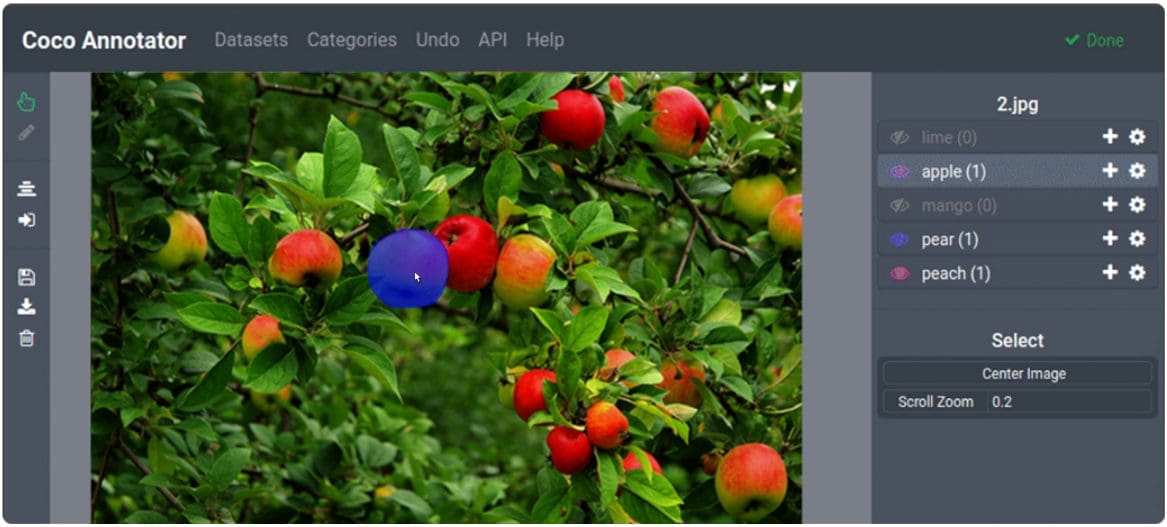
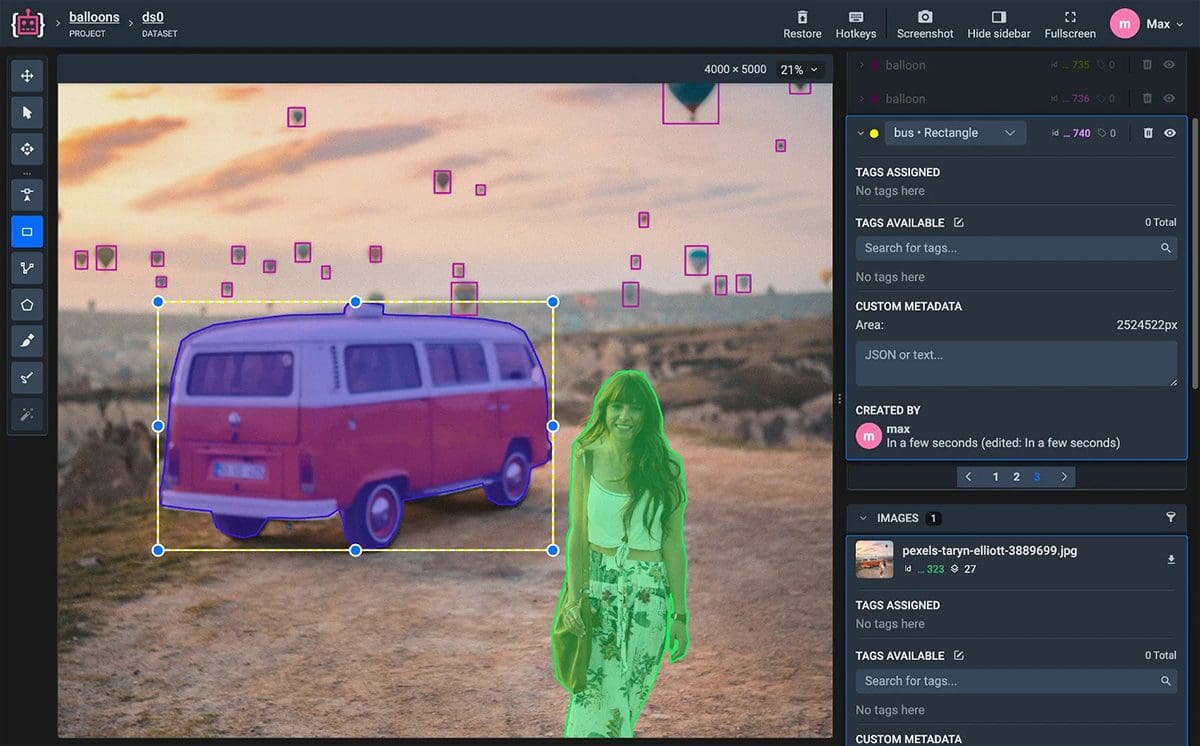
COCO Annotator is a web-based tool designed specifically for annotating images in the COCO format. It is famed for supporting varied types of annotations, namely bounding boxes, polygons, and keypoints. This annotation tool has been built using JavaScript and Django.

Closed Source VS Open Source Image Annotation

VGG Image Annotator (VIA) is an image annotation tool developed by the Visual Geometry Group at the University of Oxford. It gives users the freedom to annotate different types of objects including points, lines, and regions. The interface provided by VIA is user-friendly and intuitive for labeling images.

Closed Source VS Open Source Image Annotation Some examples of Closed-source Annotation Tools

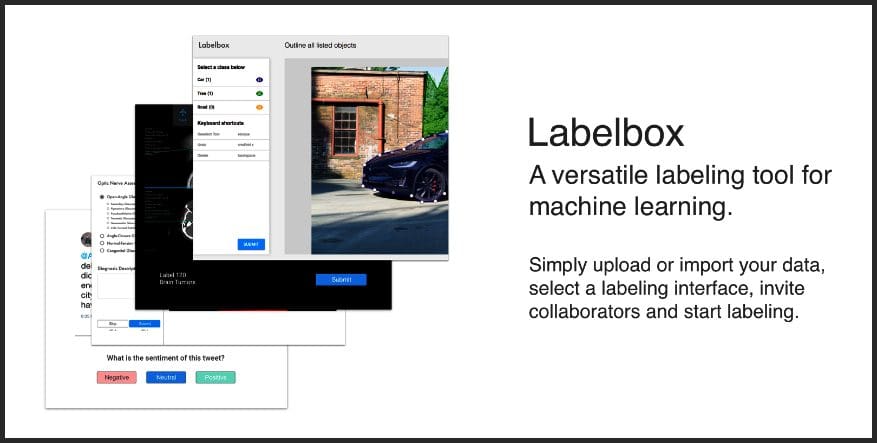
Labelbox is a platform that allows users to annotate images for tasks such as object detection, image segmentation, and classification. This tool offers numerous collaboration features that efficiently integrate with machine learning frameworks.

Closed Source VS Open Source Image Annotation

Supervisely — This tool supports image annotation and also provides features like data versioning and model deployment.

Closed Source VS Open Source Image Annotation Applications and Use Cases of Image Annotation Tools Closed Source VS Open Source Image Annotation
Image annotation tools are used to annotate images across industries. Using image annotation tools, such as pedestrians, vehicles, and traffic signs, a driverless car can navigate safely and make informed decisions. Also, self-driving cars are able to ride safely and make informed decisions. Therefore, in medical imaging, image annotations assist healthcare professionals in flawless diagnosing. Patients receive effective treatment based on this information. In addition to categorizing products and improving search functionality, image annotation is used by e-commerce platforms in order to improve the overall shopping experience for customers, by improving their experience. The utilization of image annotation tools in the below-mentioned examples showcases their versatility and importance in a variety of different domains. Annotating Images in Real Life

Let’s understand the practical applications of image annotation tools by examining a few examples from real-life situations:

1. Vehicles that drive themselves

For autonomous vehicles to be capable of perceiving and navigating the environment faultlessly, it is imperative that only reliable image annotation tools be used. These above-mentioned tools facilitate self-driving vehicles to make informed decisions by detecting pedestrians, vehicles, and traffic signs. Thus, ensuring the safety of passengers with every ride.

2. Medical Imaging

Talking about the medical industry, radiologists are enjoying the advantages of artificial intelligence solutions. Clinical practitioners garner useful medical data using AI that helps them read and analyze reports of X-rays, CT scans, and/or magnetic resonance images with enhanced accuracy. With better data and visibility of patient ailments, doctors are able to treat patients with better care & diligence.

3. The role of visual search in e-commerce

There is widespread usage of image annotation in the e-commerce industry. Products are categorized in numerous parameters like functionality, color, style, and visual search to make the customer's journey easy, enjoyable, and convenient.

4. Augmented Reality (AR)

Image Annotations are used in AR applications for placing virtual objects and information properly as per the real-world environment. Starting with the depth, scale, and orientation of objects – everything is annotated for a realistic and immersive AR experience for users.

5. Robotics and Automation

Robotics professionals can manipulate objects with the help of image annotation tools. When robots are labeled with pertinent attributes, they gain the power to perceive and interact with the environment efficiently.

Final Thoughts

While it is true that the popularity of open-source image annotation tools is on the rise, however, they come along with numerous disadvantages. It becomes difficult to scale big projects and ensure high-quality annotated images using open-source image annotation tools. Hence, opting for closed-source tools would be a prudent move.

If you are a tech enthusiast, you might like to know more about the impact of Prompt Engineering in AI.
Mirza Arique Alam is a passionate AI & ML Writer, and Published Author. He creates engaging and informative content at the intersection of Artificial Intelligence and technology to inspire and educate the world about the limitless potential of artificial intelligence. Currently working with Cogito and Anolytics.

More On This Topic

  • Overview of Albumentations: Open-source library for advanced image…
  • Data Annotation: tooling & workflows latest trends
  • 3 Data Acquisition, Annotation, and Augmentation Tools
  • A Quick Guide to Find the Right Minds for Annotation
  • Bounding Box Deep Learning: The Future of Video Annotation
  • Misconceptions About Semantic Segmentation Annotation

Adobe Firefly, now out of beta, boasts fix for DALL-E’s drawbacks

firefly-collage.png

Artificial intelligence image generators first rose to fame with the release of DALL-E, and since then many competitors — including Adobe's Firefly — have entered the scene. Now, Adobe is launching major upgrades to Firefly's features and availability.

Adobe on Tuesday announced the commercial release of Firefly for Generative AI after a six-month beta period. With Adobe Firefly, users can use text prompts in over 100 languages to generate images, text effects, and vectors.

"With over 2 billion generations, creators amazed us with their engagement and feedback to the Firefly beta, inspiring us to deliver generative AI capabilities that are designed to be commercially safe and seamlessly integrated into the interfaces customers love," said Ely Greenfield, Adobe CTO.

Also: Even TurboTax is adding an AI tool. Here's what Intuit Assist can do for you

One of the most significant differentiating factors between Firefly and other AI image generators — like DALL-E — is that the Firefly model is trained on Adobe Stock Images and public domain content where the copyright has expired, which ensures that the content used to train the models is done so with the creator's permission.

Furthermore, Adobe Stock contributors will receive royalty payments for any of their content used to train the commercial Firefly AI model. Adobe described this Firefly Contributor Bonus as a way to build a fair partnership with image creators.

Content credentials will be included in all generated images to serve as a "nutrition label" with verifiable details that show an asset's name, creation date, tools used for creation, and edits made.

All of the above actions address the most significant controversies of AI image generators including the spread of misinformation through realistic-looking images and the misappropriation of other people's work to train the models.

Adobe also unveiled a new Firefly web application that allows users to test the features for themselves — what the company describes as "a playground for exploring AI-assisted creative expression".

All users need to do to try it out for themselves is visit the web application, log in or create an Adobe account, and then tinker with as many AI models as they'd like to experience for themselves.

Also: How to create your own comic books with AI

Users can also access the Firefly-supported features across the Adobe Creative Cloud and Adove Express including Generative Fill and Generative Expand in Photoshop, Generative Recolor in Illustrator, and Text to Image and Text effects in Adobe Express, according to the press release.

Lastly, Adobe introduced Generative Credits, which give paid customers of the Firefly web application, Express Premium, and Creative Cloud an allocation of tokens for generative AI image workflows.

Once the plan-specific Generative Credits run out, subscribers have the option to continue to use the generative AI features with a slower experience or purchase additional subscription packs.

Artificial Intelligence

Amazon debuts generative AI tools that helps sellers write product descriptions

Amazon debuts generative AI tools that helps sellers write product descriptions Sarah Perez @sarahintampa / 7 hours

Amazon today introduced a new set of generative AI tools aimed at sellers which the retailer says will simplify the process of creating product listings. The retail giant claims these new capabilities are designed to help sellers generate “captivating product descriptions, titles, and listing details.”

Sellers will also be able to add to their existing product descriptions using AI, instead of having to start from scratch.

The AI tools were built using large language models, or LLMs, that were trained on large amounts of data. Though Amazon doesn’t specifically say, it seems that the retailer likely scoured its own listing data to train its machine learning models. Previously, Amazon had used machine learning and deep learning techniques to extract and enrich product information, but the new generation AI capabilities builds on that technology.

“With our new generative AI models, we can infer, improve, and enrich product knowledge at an unprecedented scale and with dramatic improvement in quality, performance, and efficiency” explained Robert Tekiela, vice president of Amazon Selection and Catalog Systems, in a statement. “Our models learn to infer product information through the diverse sources of information, latent knowledge, and logical reasoning that they learn. For example, they can infer a table is round if specifications list a diameter or infer the collar style of a shirt from its image.”

Amazon claims that its generative AI tools will help sellers save time and allow customers to find more complete product information, but there are some concerns around using generative AI models at such scale, given their ability to “hallucinate” — or create false information not based on real data.

The tools could also potentially contain other mistakes that aren’t caught if a human doesn’t review the output. And if the tools end up creating incorrect product listings and descriptions, Amazon could be held liable — particularly if it doesn’t disclose the listing was created using AI.

The Information previously reported Amazon was piloting generative AI tools for content, noting that the tool warns sellers to double-check the content to ensure it complies with Amazon’s listing guidelines. The company had declined to answer questions about the LLMM it was using for the new tool, the report had said.

Amazon is not the only retailer to turn to generative AI to make the process of creating product listings easier. eBay announced last week the launch of a generative AI tool that could generate product listings from photos. Earlier this summer, Shopify announced its own ChatGPT-like sidekick for its e-commerce merchants designed to understand and interpret questions or prompts related to business decision-making, and create content like blog posts, campaign ideas and customer emails, among other things.

eBay rolls out a tool that generates product listings from photos

AWS, ISRO, & IN-SPACe Partner to Fuel Space-Tech Startups

In a landmark collaboration, AWS India Private Limited has entered into a strategic MoU with ISRO and the Indian National Space Promotion and Authorization Centre (IN-SPACe) to advance India’s space capabilities through cloud technologies. This collaboration aims to support space-tech innovations by providing access to cutting-edge cloud technologies for space startups, research institutions, and students, thereby accelerating the development of new solutions in the space sector.

Cloud computing is expected to play a pivotal role in the space industry by facilitating faster decision-making and cost-effective management of large volumes of space-related data, in addition to running AI, ML, and analytics workloads.

Shalini Kapoor, Director and Chief Technologist, Public Sector, AWS India and South Asia, expressed AWS’s commitment to helping startups identify use cases, accelerate solution development, and nurture a talent pool with expertise in cloud and space technologies. “We look forward to helping customers in India build space-tech solutions to make life on Earth better,” Kapoor, added.

The partnership also aligns with India’s focus on expanding its capabilities in the aerospace and satellite industry, as highlighted by Kapoor. AWS’s educational programs on cloud computing, combined with ISRO’s space-tech expertise, aim to inspire and encourage future generations to pursue careers in India’s growing space sector.

“Advancing innovation in the space sector is a top priority for our nation as geospatial solutions have the power to deliver high-quality services for the good governance for citizens and add value to the stakeholders,” Sudheer Kumar N, Director of Capacity Building and Public Outreach at ISRO, said.

The collaboration will support the growth of the startup community in the space-tech sector by providing eligible startups with tools, resources, and technical support through the AWS Activate program, enabling them to build innovative solutions and commercialize them more rapidly. Startups will also benefit from access to AWS’s global experience in building aerospace and satellite solutions through the AWS Space Accelerator program.

Dr. Vinod Kumar, Director, Promotion Directorate, IN-SPACe, highlighted the need to leverage space technology and cloud computing to elevate India’s space sector to new heights. This partnership with AWS aims to empower startups, students, and researchers to drive innovation and contribute to the global space industry.

In addition to the collaboration’s core objectives, the three organizations will work together on a new initiative to train students and educators in cloud computing, AI, ML, analytics, and security, leveraging AWS education programs. This initiative will enable students to pursue industry-recognized cloud computing certifications and foster the development of future space startups in India using advanced technologies.

The partnership follows the recent approval of the Indian Space Policy, 2023, by the Government of India, providing a strategic roadmap for the growth and development of India’s space program. The announcement has also come on the heels of investments that space tech companies in India have received and expect to receive following the exposure that came with the success of Chandrayaan 3.

The post AWS, ISRO, & IN-SPACe Partner to Fuel Space-Tech Startups appeared first on Analytics India Magazine.

KDnuggets Survey: Benchmark With Your Peers On Data Science Spend & Trends 2023 H2

Partnership Content

Benchmark With Your Peers On Data Science Spend & Trends

The All Things Insights Survey Committee along with KDnuggets, AI Business, The AI Summit, Enter Quantum, IOT World Today, the Digital Analytics Association and Marketing Analytics and Data Science have created a Spend & Trends survey to provide you the opportunity to benchmark with your peers on how they are spending and the mindsets around current trends.

The results from this survey will provide you and your colleagues in our community with much needed benchmarking information on mindset and focus trends as well as budget and technology spend.

We’ll analyze the responses and output results into the Spend & Trends Report.

Our goal is to provide resources for analytics and data science disciplinarians to better collaborate with and within the marketing function as well as the rest of the organization.

Alchemer is trusted by tens of thousands of brands around the world. Please take my survey now

We’ll send you the Report as soon as it’s released. Your responses will be kept completely confidential. We appreciate your time—this research helps our entire industry and we can’t do it without you. Thank you for helping us advance the analytics and data science discipline.

Benchmark With Your Peers On Data Science Spend & Trends

More On This Topic

  • KDnuggets Survey: Benchmark with your peers on industry spend and trends
  • H1 2023 Analytics & Data Science Spend & Trends Report
  • What To Expect for AI Quality Trends In 2023
  • 2023 AI Index Report: AI Trends We Can Expect in the Future
  • Chatbot Arena: The LLM Benchmark Platform
  • 5 Key Data Science Trends & Analytics Trends

Dreamforce 2023: Salesforce Net Zero Cloud Automates Writing ESG Reports

Laptop computer displaying logo of Salesforce.
Image: monticellllo/Adobe Stock

Salesforce is adding environmental, social and governance report writing and other features to Net Zero Cloud, a tool to help companies reach environmental sustainability goals. Plus, six nonprofits will receive funding for social impact driven by generative AI, Salesforce announced at the Dreamforce event held in San Francisco on Wednesday.

Jump to:

  • Net Zero Cloud aims to make ESG reporting easier
  • Winners announced for $2 million AI for Impact Accelerator

Net Zero Cloud aims to make ESG reporting easier

Einstein AI generative writing features are coming to Salesforce’s sustainability solution Net Zero Cloud in spring 2024, the company announced at the Dreamforce conference in San Francisco on Wednesday.

SEE: What is ESG, and why does it matter? (TechRepublic)

“Equipped with Einstein, Net Zero Cloud will help simplify the process of reporting ESG data, offering a valuable solution that any company can leverage towards achieving net zero,” said Ari Alexander, vice president and general manager of Net Zero Cloud at Salesforce, in a press release.

Net Zero Cloud can generate reports for environmental impact across scopes 1, 2 and 3 and for social and governance metrics, as well as reports aligned to standards including the Sustainability Accounting Standards Board, CDP Worldwide, the Global Reporting Initiative and the EU’s Corporate Sustainability Reporting Directive.

CSRD Report Builder and Materiality Assessment feature

Einstein has been trained on specific reporting requirements and will suggest responses accordingly.

The EU’s CSRD, which goes into effect for certain companies in 2024, will require companies to disclose scope 3 emissions, climate-related financial risks and societal impacts. Net Zero Cloud’s CSRD Report Builder automatically creates the type of reports the directive mandates.

SEE: Artificial Intelligence: Cheat Sheet (TechRepublic)

A Materiality Assessment tool fulfills another requirement of CSRD: the “double materiality” assessment. With it, companies can rank the ESG topics that are most important to their company and stakeholders and present the results as scores.

The CSRD Report Builder and Materiality Assessment feature are expected to be available globally in October 2023.

Making up for the energy drain of generative AI

Customers are aware that generative AI takes an enormous amount of electricity to run, Sunya Norman, vice president of ESG strategy and engagement at Salesforce, said during a press briefing in advance of Dreamforce. Therefore, Norman advises companies to do the following in addition to adhering to the guidelines Net Zero Cloud assists with:

  • Right-size their AI models.
  • Use data centers powered by clean energy.
  • Use efficient hardware.
  • Look into green code as well as using Einstein for reporting. Green code is Salesforce’s term for the practice of building sustainability into software development, system architecture and other technological development.

Winners announced for $2 million AI for Impact Accelerator

The six nonprofit organizations that will receive prize money from Salesforce’s AI for Impact Accelerator initiative to use generative AI for social good are Beyond 12, CareerVillage.org, CodePath.org, College Possible, Per Scholas and the Teacher Development Trust. CareerVillage.org has a global scope; the Teacher Development Trust is based in the U.K.; and the rest of the nonprofits are based in the U.S.

  • Beyond12 will use AI to discover and customize content from college websites to help students from under-resourced communities graduate.
  • CareerVillage.org runs an AI “career coach” that offers personalized advice.
  • CodePath.org wants to scale its internal AI applications, including AI “coworkers” and a streamlined data terminal.
  • College Possible will use an AI-driven platform to provide custom recommendations to coaches helping students from under-served communities.
  • Per Scholas will leverage generative AI to help students write resumes and cover letters for the tech industry.
  • The Teacher Development Trust plans to coach teachers using AI-generated role-playing scenarios.

The $2 million AI for Impact Accelerator prize money will be distributed across these organizations. In addition, each organization will receive a 24-month contract for donated Salesforce products, six months of coaching from Salesforce personnel and one-on-one coaching for 12 months.

“Our latest accelerator aims to empower participants to push the boundaries of innovation and drive forward AI-focused solutions that better serve their communities,” said Becky Ferguson, chief executive officer of the Salesforce Foundation and senior vice president of philanthropy at Salesforce, in a press release.

Subscribe to the Innovation Insider Newsletter

Catch up on the latest tech innovations that are changing the world, including IoT, 5G, the latest about phones, security, smart cities, AI, robotics, and more.

Delivered Tuesdays and Fridays Sign up today

Analytics and Data Science Jobs in India 2023 by AIM Research & Great Learning

Data has turned into the lifeblood of organizations across industries in today’s swiftly evolving digital landscape. Large volumes of data can now be collected, analyzed, and used to produce insights that enterprises can leverage. As a result, the demand for skilled professionals in the fields of Analytics and Data Science has skyrocketed.

For the year 2023, AIM Research in association with Great Learning has carried out a job study of specialists in analytics and data science in India. The research focuses on the trend of open positions across various industries, businesses, job functions, salaries, years of experience, cities, job roles, and work models.

The data for this report is based on AIM Research’s daily job tracker that collates data related to data science and analytics jobs from various job sites. To present a holistic study AIM Research has referred to several secondary data sources like job portals, news articles and other research databases. Secondary research also covers all public domain information, company websites, annual reports, whitepapers, marketing information, and press releases.

In comparison to the previous year, the research found a decline in the trend of open jobs for data science specialists in India.

Read reports from the previous years here:

2022 | 2021 | 2020 | 2019 | 2018 | 2017

The report highlights the availability of data science jobs across major cities. While cities like Pune, Hyderabad, and Delhi NCR have more positions for data scientists than ever before, there has been a declining demand for data scientists in Bangalore and Mumbai. The study also showed that industries like BFSI, healthcare, and retail & CPG have more need for data science specialists and MNC IT and KPO account for more job openings compared to other company types.

Overall, the research indicates that the number of vacant positions for data science professionals has decreased from the previous year, and that demand for these people is higher in specific industries, businesses, and degrees of experience. The research offers insightful information about the present job market in India for data science specialists.

Read the complete report here:

The post Analytics and Data Science Jobs in India 2023 by AIM Research & Great Learning appeared first on Analytics India Magazine.

Applying Descriptive and Inferential Statistics in Python

Applying Descriptive and Inferential Statistics in Python
Photo by Mikael Blomkvist

Statistics is a field encompassing activities from collecting data and data analysis to data interpretation. It’s a study field to help the concerned party decide when facing uncertainty.

Two major branches in the statistics field are descriptive and Inferential. Descriptive statistics is a branch related to data summarization using various manners, such as summary statistics, visualization, and tables. While inferential statistics are more about population generalization based on the data sample.

This article will walk through a few important concepts in Descriptive and Inferential statistics with a Python example. Let’s get into it.

Descriptive Statistics

As I have mentioned before, descriptive statistics focus on data summarization. It’s the science of processing raw data into meaningful information. Descriptive statistics can be performed with graphs, tables, or summary statistics. However, summary statistics is the most popular way to do descriptive statistics, so we would focus on this.

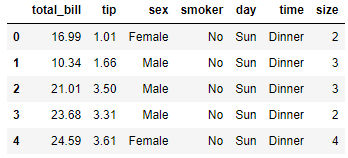
For our example, we would use the following dataset example.

import pandas as pd  import numpy as np  import seaborn as sns    tips = sns.load_dataset('tips')  tips.head()
Applying Descriptive and Inferential Statistics in Python

With this data, we would explore descriptive statistics. In the summary statistics, there are two most used: Measures of Central Tendency and Measures of Spread.

Measures of Central Tendency

Central tendency is the center of the data distribution or the dataset. The measures of central tendency are the activity to acquire or describe the center distribution of our data. The measures of central tendency would give a singular value that defines the data's central position.

Within measures of Central Tendency, there are three popular measurements:

1. Mean

Mean or average is a method to produce a singular value output representing our data's most common value. However, the mean is not necessarily the value observed in our data.

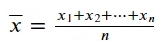
We can calculate the mean by taking a sum of the existing values in our data and dividing it by the number of values. We can represent the mean with the following equation:
Applying Descriptive and Inferential Statistics in Python
Image by Author

In Python, we can calculate data mean with the following code.

round(tips['tip'].mean(), 3)
2.998

Using the pandas series attribute, we can obtain the data mean. We also round the data to make the data reading easier.

Mean has a disadvantage as a measure of central tendency because it is affected heavily by the outlier, which could skew the summary statistic and not best represent the actual situation. In skewed cases, we can use the median.

2. Median

The median is the singular value positioned in the middle of the data if we sort them, representing the data's halfway point position (50%). As a measurement of central tendency, the median is preferable when the data is skewed because it could represent the data center, as the outlier or skewed values do not strongly influence it.

The median is calculated by arranging all the data values in ascending order and finding the middle value. The median is the middle value for an odd number of data values, but the median is the average of the two middle values for an even number of data values.

We can calculate the Median with Python using the following code.

tips['tip'].median()
2.9

3. Mode

Mode is the highest frequency or most occurring value within the data. The data can have a single mode (unimodal), multiple modes (multimodal), or no mode at all (if there are no repeating values).

Mode is usually used for categorical data but can be used in numerical data. For categorical data, though, it might only use the mode. This is because categorical data do not have any numerical values to calculate the mean and median.

We can calculate the data Mode with the following code.

tips['day'].mode()

Applying Descriptive and Inferential Statistics in Python
The result is the series object with categorical type values. The ‘Sat’ value is the only one that comes out because it’s the data mode.

Measures of Spread

The measures of spread (or variability, dispersion) is a measurement to describe data value spreads. The measurement provides information on how our data values vary within the dataset. It is often used with the measures of central tendency as they complement the overall data information.

The measures of the spread also help understand how well our measures of central tendency output. For example, a higher data spread might indicate a significant deviation between the observed data, and the data mean might not best represent the data.

Here are various measures of spread to use.

  1. Range

The range is the difference between the data's largest (Max) and smallest value (Min). It’s the most direct measurement because the information only uses two aspects of the data.

The usage might be limited because it doesn’t tell much about the data distribution, but it might help our assumption if we have a certain threshold to use for our data. Let’s try to calculate the data range with Python.

tips['tip'].max() - tips['tip'].min()
9.0

2. Variance

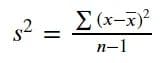
Variance is a measurement of spread that informs our data spreads based on the data mean. We calculate variance by squaring the differences of each value to the data mean and dividing it by the number of the data values. As we usually work with data samples and not populations, we subtract the number of the data values by one. The equation for sample variance is in the image below.
Applying Descriptive and Inferential Statistics in Python
Image by Author

Variance can be interpreted as a value indicating how far the data is spread to the mean and each other. Higher variance means a wider data spread. However, variance calculation is sensitive to the outlier because we squared the scores' deviations from the mean; it means we gave more weight to the outlier.

Let’s try to calculate data variance with Python.

round(tips['tip'].var(),3)
1.914

The variance above might suggest a high variance in our data, but we might want to use the Standard Deviation to have an actual value for our data spread measurement.

3. Standard Deviation

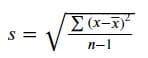
Standard deviation is the most common way to measure the data spread, and it’s calculated by taking the variance's square root.
Applying Descriptive and Inferential Statistics in Python
Image by Author

The difference between variance and the standard deviation is in the information their value gave. Variance value only indicates how spread our values were from the mean, and the variance unit differs from the original value as we squared the original values. However, the standard deviation value is the same unit as the original data value, which means the standard deviation value can be used directly to measure our data's spread.

Let’s try to calculate the Standard Deviation with the following code.

round(tips['tip'].std(),3)
1.384

One of the most common applications of standard deviation is to estimate the data interval. We can estimate the data interval using the empirical rule or the 68–95–99.7 rule. The empirical rule stated that 68% of data is estimated to fall within the data mean ± one STD, 95% of data is mean ± two STD, and 99.7% of data is within mean ± three STD. Outside of this interval, it could be assumed as an outlier.

4. Interquartile Range

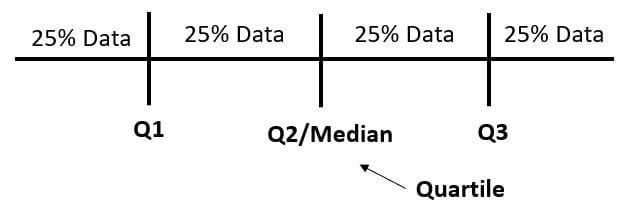
Interquartile Range (IQR) is a measure of spread calculated using the differences between the first and third quartile data. The quartile itself is a value that divides the data into four different parts. To understand better, let’s take a look at the following image.
Applying Descriptive and Inferential Statistics in Python
Image by Author

The quartile is the value that divides the data rather than the result of the division. We can use the following code to find the quartile values and IQR.

q1, q3= np.percentile(tips['tip'], [25 ,75])  iqr = q3 - q1    print(f'Q1: {q1}nQ3: {q3}nIQR: {iqr}')
Q1: 2.0    Q3: 3.5625    IQR: 1.5625

Using the numpy percentile function, we can acquire the quartile. By subtracting the third quartile and the first quartile, we get the IQR.

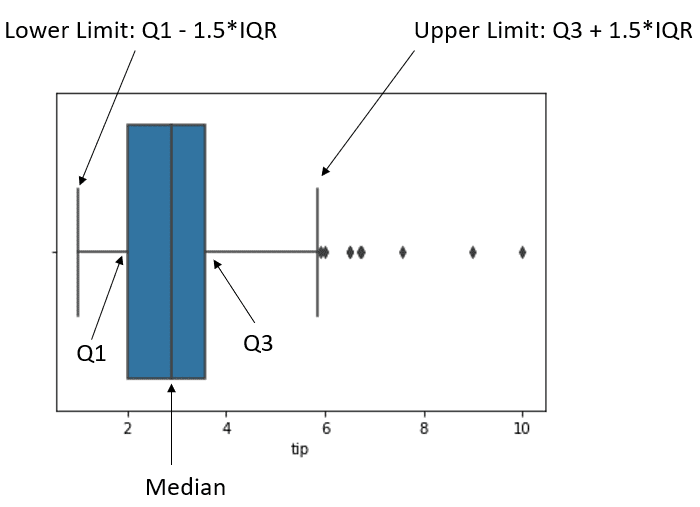
IQR can be used to identify the data outlier by taking the IQR value and calculating the data upper/lower limit. The upper limit formula is the Q3 + 1.5 * IQR, while the lower limit is the Q1 — 1.5 * IQR. Any values passing this limit would be considered outliers.

To understand better, we can use the boxplot to understand the IQR outlier detection.

sns.boxplot(tips['tip'])
Applying Descriptive and Inferential Statistics in Python

The image above shows the data boxplot and the data position. The black dot after the upper limit is what we consider an outlier.

Inferential Statistics

Inferential statistics is a branch that generalizes the population information based on the data sample it comes from. Inferential statistics is used because it is often impossible to get the whole data population, and we need to make inferential from the data sample. For example, we want to understand how Indonesia people’s opinions about AI. However, the study would take too long if we surveyed everyone in the Indonesian population. Hence, we use the sample data representing the population and make inferences about the Indonesian population's opinion about AI.

Let’s explore various Inferential Statistics we could use.

1. Standard Error

The standard error is an inferential statistics measurement to estimate the true population parameter given the sample statistic. The standard error information is how the sample statistic would vary if we repeat the experiment with the data samples from the same population.

The standard error of the mean (SEM) is the most commonly used type of standard error as it tells how well the mean would represent the population given the sample data. To calculate SEM, we would use the following equation.
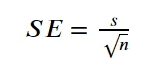
Applying Descriptive and Inferential Statistics in Python
Image by Author

Standard error of Mean would use standard deviation for the calculation. The standard error of the data would be smaller the higher the number of the sample, where smaller SE means that our sample would be great to represent the data population.

To get the standard error of the mean, we can use the following code.

from scipy.stats import sem    round(sem(tips['tip']),3)
0.089

We often report SEM with the data mean where the true mean population would estimated to fall within the mean±SEM.

data_mean = round(tips['tip'].mean(),3)  data_sem = round(sem(tips['tip']),3)  print(f'The true population mean is estimated to fall within the range of {data_mean+data_sem} to {data_mean-data_sem}')
The true population mean is estimated to fall within the range of 3.087 to 2.9090000000000003

2. Confidence interval

Confidence interval is also used to estimate the true population parameter, but it introduces the confidence level. The confidence level estimates the true population parameters range with a certain confidence percentage.

In statistics, confidence can be described as a probability. For example, a confidence interval with a 90% confidence level means that the true mean population estimate would be within the confidence interval's upper and lower values 90 out of 100 times. CI is calculated with the following formula.
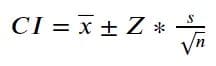
Applying Descriptive and Inferential Statistics in Python
Image by Author

The formula above has a familiar notation except Z. The Z notation is a z-score acquired by defining the confidence level (e.g., 95%) and using the z-critical value table to determine the z-score (1.96 for a confidence level of 95%). Additionally, if our sample is small or below 30, we are supposed to use the t-distribution table.

We can use the following code to get the CI with Python.

import scipy.stats as st    st.norm.interval(confidence=0.95, loc=data_mean, scale=data_sem)
(2.8246682963727068, 3.171889080676473)

The above result could be interpreted that our data true population mean falls between the range 2.82 to 3.17 with 95% confidence level.

3. Hypothesis Testing

Hypothesis testing is a method in inferential statistics to conclude from data samples about the population. The estimated population could be the population parameter or the probability.

In Hypothesis testing, we need to have an assumption called the null hypothesis (H0), and the alternative hypothesis (Ha). Null hypothesis and alternative hypothesis are always opposite of each other. The hypothesis testing procedure then would use the sample data to determine whether or not the null hypothesis can be rejected or we fail to reject it (which means we accept the alternative hypothesis).

When we perform a hypothesis testing method to see if the null hypothesis must be rejected, we need to determine the significance level. The level of significance is the type 1 error ( rejecting H0 when H0 is true) maximum probability that is allowed to happen in the test. Usually, the significance level is 0.05 or 0.01.

To draw a conclusion from the sample, hypothesis testing uses the P-value when assuming the null hypothesis is true to measure how likely the sample results are. When the P-value is smaller than the significance level, we reject the null hypothesis; otherwise, we can’t reject it.

Hypothesis testing is a method that can be performed in any population parameter and could be performed on multiple parameters as well. For example, the below code would perform a t-test on two different populations to see if this data is significantly different than the other.

st.ttest_ind(tips[tips['sex'] == 'Male']['tip'], tips[tips['sex'] == 'Female']['tip'])
Ttest_indResult(statistic=1.387859705421269, pvalue=0.16645623503456755)

In the t-test, we compare the means between two groups (pairwise test). The null hypothesis for the t-test is that there are no differences between the two groups' mean, while the alternative hypothesis is that there are differences between the two groups' mean.

The t-test result shows that the tip between the Male and Female is not significantly different because the P-value is above 0.05 significance level. It means we failed to reject the null hypothesis and conclude that there are no differences between the two groups' means.

Of course, the test above only simplifies the hypothesis testing example. There are many assumptions we need to know when we perform hypothesis testing, and there are many tests that we can do to fulfill our needs.

Conclusion

There are two major branches of statistics field which we need to know: descriptive and Inferential statistics. Descriptive statistics is concerned with summarizing data, while inferential statistics tackle data generalization to make inferences about the population. In this article, we have discussed descriptive and inferential statistics while having examples with the Python code.
Cornellius Yudha Wijaya is a data science assistant manager and data writer. While working full-time at Allianz Indonesia, he loves to share Python and Data tips via social media and writing media.

More On This Topic

  • The Inferential Statistics Data Scientists Should Know
  • Descriptive Statistics Key Terms, Explained
  • Applying Python's Explode Function to Pandas DataFrames
  • Applying Natural Language Processing in Healthcare
  • Data science is not about data — applying Dijkstra principle to data…
  • Data Science, Statistics and Machine Learning Dictionary