After a six-month beta, Adobe, the design software giant, has leapt towards customer-centricity, launching a web application for Firefly, a suite of generative AI models. The once-incipient Firefly is now integrated into Adobe Creative Cloud, Adobe Express, and Adobe Experience Cloud. Alongside this, the company has released GenStudio, a knight in shining armour to solve the content supply chain needs for enterprises.
“With over 2 billion generations, creators amazed us with their engagement and feedback to the Firefly beta, inspiring us to deliver generative AI capabilities that are designed to be commercially safe and seamlessly integrated into the interfaces customers love,” said Ely Greenfield, chief technology officer, Digital Media, Adobe.
The general availability of Firefly for Enterprise extends the reach of AI within Adobe, benefiting GenStudio and Express for Enterprise.
Ashley Still, the senior VP of Digital Media at Adobe, weighed in on this transformative step, saying, “AI innovation is most powerful in the hands of creators.” She further highlighted the new ‘creativity for all’ era with inbuilt AI throughout the Creative Cloud.
Starting today, the Firefly web app, Express Premium, and Creative Cloud’s premium plans have been generously allotted “fast” Generative Credits. These credits serve as the golden keys, enabling customers to turn text-based prompts into vibrant and vector images within Photoshop, Illustrator, Express, and the Firefly web application.
Once the tailor-made quota of “fast” Generative Credits has been used, subscribers can continue to create at a slower pace. Alternatively, they can recharge their stash of “fast” credits through a Firefly paid subscription plan. November 2023 forward, Adobe plans for users to buy additional “fast” credits through a subscription pack.
In June, Adobe introduced Firefly, powered by NVIDIA’s Picasso suite of genAI models to its Adobe Express platform. Upon its launch, Adobe Firefly faced significant criticism for trailing behind its competitors, namely Midjourney and Stable Diffusion. While the design company took its own sweet time to jump on the genAI bandwagon but all the releases in the recent past have been up to the mark.
The post Adobe Launches GenStudio for Enterprises, Firefly WebApp & More appeared first on Analytics India Magazine.
Data centers are known for their impact on the environment. They run 24/7 and exude a lot of heat. Massive warehouses full of hot technology require advanced cooling systems or an HVAC system pushed to its limit.
Data center managers and sustainability leaders no longer settle for antiquated techniques. They’re striving to develop greener and more effective strategies for data center cooling. These innovations are current, adaptable solutions that provide a singular and cooperative approach to keeping data centers regulated.
Liquid and immersion cooling
Liquid cooling is a sensible technique becoming more popular. Recent innovations make liquid cooling more eco-conscious and triumphant over its shortcomings, such as the potential for electrical concerns if water leaks and biofilm cause corrosion, decreasing efficiency. However, novel research shows experts should repurpose the natural bacterial growth in liquid cooling to repurpose it as corrosion prevention or biomass renewable energy.
Data centers must incorporate infrastructure design features that increase safety controls, mobility of cooling resources, and elementally resistant materials for machinery — which data centers must consider, regardless of whether they use liquid cooling.
Immersion is another variant of liquid cooling with a looped pipe system. Submerging tech in non-conductive fluids is a fast way to bring temperatures down and allows professionals to upgrade to legacy tech capable of handling immersion methods. Each method requires less energy and could be 4,000 times more efficient than air cooling by removing instead of displacing heat, making its effect longer-lasting.
Cold plates
Cold plates are another strategy in the liquid cooling camp. Installers individually assign plates to heat sources. The technology is small yet intricate. Direct-to-chip cooling methods allow exponential scaling.
It is essential to decrease barriers when converting to sustainable frameworks, mainly when they require an overhaul or massive upfront investment. They are compatible with other cooling methods, making them immediately integrable in a developing environmentally friendly cooling strategy.
Modular designs
Less obvious cooling solutions involve systems outside of temperature control. If data centers want to reduce the 1.5% electricity demand on the planet, they have to reduce energy consumption before attempting to become sustainable. Legacy technologies and vampire energy are rampant in data centers, requiring more energy as the machines age.
A less expensive way to keep data centers running efficiently while reducing energy use is through modular designs. Modular units use space better, allowing for more customized floor plans to delegate airflow. If units go faulty, replacing individual parts and upgrading for better heat management is more manageable as new technologies arise instead of feeling burdened to rework the entire complex.
Green IoT monitoring
IoT is an influential addition to any technological outfit, but it is particularly noteworthy if you need insight into sustainability analytics. Monitors and sensors will not make your data center greener alone, but they align priorities and distribute budgets to the highest impact areas.
For example, if water sensors detect a temperature change in the cooling system, they notify operators for immediate diagnostics. Other sensors may notice faults in raised floor tile systems and AI integration may suggest updates for more thoughtful positioning. Additionally, data centers can test multiple devices for cost-benefit analyses.
Impact investing
Corporations with money to spare must invest in companies making an impact. The best ideas in sustainable data center cooling have yet to enter the market, and too many of the world’s ideas are locked behind a lack of funding. If companies want to go green, they must support eco-conscious ideas and initiatives from idea generators and startups.
For example, a United Arab Emirates investment agency called Mubadala invested in a Canadian liquid cooling company CoolIT. The funding is an example of impact investing for a greener future. Over four funding opportunities, the agency raised $10 million to bring its sustainable vision to life.
Making data centers sustainable
Cooling data centers to have a lower carbon footprint requires more than replacing old technology. Sustainable data centers will flourish through various efforts, from practical tech upgrades to research and development. It forces data center and IT professionals to engage and collaborate with tech leaders, governments, and environmental advocates to formulate ideas with ingenuity.
You've received an email, text, or website notification that's triggering your Spidey senses, so you're not sure if it's legitimate or malicious. One tool that can help is Norton's Genie.
With this free AI-powered scam detector, you submit the text or image of a suspicious message, social media post, or website. In return, Genie will try to tell you whether the item is a possible scam and let you ask follow-up questions to decide what to do next.
Also: 6 simple cybersecurity rules to live by
Available as a website and an iPhone/iPad app, Norton Genie is currently in an early access phase, which means it's not yet fully widespread or perfected. The app itself is accessible only in the US, UK, Ireland, Australia, and New Zealand.
And like any new AI service, Genie is still in the process of learning. That means it's not going to be accurate or correct all of the time. Instead, you'll want to use this as just one method to identify a possible scam. And the more items the tool scans, the more it will learn how to do its job.
How to use Norton's Genie scam detector
Capture the suspicious item.
Upload the image to the Genie website.
Paste the copied text.
Begin the scan.
Wait for the analysis.
View more details.
Chat with Genie.
Launch the Genie app.
Upload an image or paste the text.
Wait for the response.
How did Genie fare?
I tried Genie with several different emails, some that were legitimate and some that were scams. The results were fairly good, though Genie did miss a few obvious ones based on specific details. For example, the full sextortion email that I submitted was not considered a scam because the Bitcoin URL included in the text was seen as legitimate. When I removed the Bitcoin link from the text, Genie correctly identified this message as a scam.
Also, the chatbot definitely needs improvement as it failed to understand or respond properly to some of my questions. As I said earlier, Genie is in an early access phase, so it certainly requires more time and training to be truly effective. For now, I would use the tool as one way to identify scams but would continue to rely on other methods as well.
To learn more about preventing and combatting scams, check out the following ZDNET articles:
What is phishing? Everything you need to know to protect yourself from scammers
Scam, spam and phishing texts: How to spot SMS fraud and stay safe
Scammers target older people online. Here are the 3 warning signs to watch for
Scammers are using AI to impersonate your loved ones. Here's what to watch out for
Warning: This scam starts with a fake invoice. It could end with crooks stealing your data
Pixis, an AI-powered platform for brands to monitor and orchestrate their marketing campaigns, today announced that it raised $85 million in a Series C1 round led by Touring Capital with participation from Grupo Carso, General Atlantic, Celesta Capital and Chiratae Ventures.
The funding brings Pixis’ total raised to $209 million, and comes at a time when marketers are showing an increasingly acute interest in the potential for AI to enhance their in-house ad efforts. A majority of marketers report having already incorporated AI into their daily workflows, according to a recent survey by The Conference Board, and most expect further adoption of AI to improve productivity.
To wit, Pixis claims to have crossed the $50 million in an annual recurring revenue mark this quarter with a customer base eclipsing 200 brands, including DHL, Joe & The Juice, Sears and Swiggy. Having grown 140% year-over-year in 2023, Pixis expects to achieve profitability in Q4.
“We’ve observed a palpable shift in organizational priorities post-pandemic,” Pixis co-founder and CEO Shubham Mishra told TechCrunch via email. “There’s a heightened emphasis on maximizing profitability and ensuring sustainable growth. It’s not merely about weathering the storm anymore, but about thriving in the new normal.”
Years ago, Mishra and Pixis’ other co-founders, Hari Valiyath and Vrushali Prasade, met at the Birla Institute of Technology & Science in Pilani, Rajasthan, India. The three were researching generative AI, specifically AI to create art and model assets for games.
But once they realized how large the addressable market for AI in marketing was becoming, Mishra, Valiyath and Prasade decided to pivot. Together, they built a prototype to generate marketing assets, which caught the attention of a large bank chain. From there, Mishra, Valiyath and Prasade started laying the groundwork for a full-stack marketing platform for generating assets, dynamically targeting customers and monitoring the performance of campaigns in real time.
That full-stack solution became Pixis.
“Companies, irrespective of their tech proficiency, are looking for tools that can drive results without incurring significant developmental costs or steep learning curves,” Mishra said. “AI is especially powerful for marketers, because there’s no one set of rules, outcomes, or actions that are applicable across every brand, publisher or platform.”
Image Credits: Pixis
Pixis’ platform can be divided into three core pillars: Targeting, creative and performance.
On the targeting side, Pixis uses AI to identify — and ideally convert — audiences for a given brand, product or ad campaign. On the creative end, meanwhile, Pixis can generate assets including texts, images and emails. And when it comes to performance, Pixis offers automated ad bid and budget pacing tools that attempt to mitigate the impact of short-term fluctuations and seasonality.
Each brand that works with Pixis gets it own set of “customized learnings” trained on the brand’s marketing unique data and objectives, Mishra says. Pixis uses these learnings to support its automation and creation tools, also structuring the learnings to deliver them back to the brand in the form of insights and strategies.
“With our AI engines trained on a brand’s performance data, Pixis distributes budgets, finds audiences and generates assets both within and across marketing partners,” Mishra said. “This gives our customers the ability to find and execute delivery actions while dynamically allocating and reallocating spend, aligning the brand’s media budget, target audience and creative assets around patterns discovered by our AI engines.”
Now, that’s a lot of jargon. And this reporter wonders just how Pixis is applying generative AI to create marketing materials. After all, generative AI — whether in-house or third party — has a tendency to make up facts and go off the rails in other unexpected ways.
Mishra emphasized that Pixis has “manual overrides” to steer its AI when necessary and that it takes a “fine-tuning” approach to better control the content that its models create. I’d hope that Pixis encourages human oversight of the platform’s generative AI features. But I can’t be sure, having not been given the opportunity to test them myself.
Pixis seems intent to forge ahead on the AI front regardless, recently launching a chatbot tool called Pixis Analyze that lets users ask questions related to campaigns, marketing data and various “AI actions.” The company’s larger, more ambitious project is Creative Studio, an editing suite for fine-tuning media output by its generative AI models. Creative Studio is available to Pixis’ current brand partners and will launch for new customers next year, Mishra says.
“Our platform pays for itself and improves profitability through unlocked budget efficiencies and time savings that get reinvested back into the business,” Mishra said. “The demand for efficient, scalable and customizable AI has surged, and our products align seamlessly with this new emerging need.”
Mishra says that the proceeds from Pixis’ latest funding round will be used to support Pixis’ R&D, expand its infrastructure to reach more publishers and ad networks and build strategic product and business partnerships. In the near term, Pixis plans to expand its staff of 350 people, focusing on the sales and business development teams in North America and Latin America, and take on debt in Q4 for a potential acquisition. (Mum’s the word on which business Pixis could acquire.)
Tim Davis, is the Co-Founder & President of Modular, an integrated, composable suite of tools that simplifies your AI infrastructure so your team can develop, deploy, and innovate faster. Modular is best known for developing Mojo, a new programming language that bridges the gap between research and production by combining the best of Python with systems and metaprogramming.
Repeat Entrepreneur and Product Leader. Tim helped build, found and scale large parts of Google's AI infrastructure at Google Brain and Core Systems from APIs (TensorFlow), Compilers (XLA & MLIR) and runtimes for server (CPU/GPU/TPU) and TF Lite (Mobile/Micro/Web), Android ML & NNAPI, large model infrastructure & OSS for billions of users and devices. Loves running, building and scaling products to help people, and the world.
When did you initially discover coding, and what attracted you to it?
As a kid growing up in Australia, my dad brought home a Commodore 64C and gaming was what got me hooked – Boulder Dash, Maniac Mansion, Double Dragon – what a time to be alive. That computer introduced me to BASIC and hacking around with that was my first real introduction to programming. Things got more intense through High School and University where I used more traditional static languages for engineering courses, and over time I even dabbled all the way up to Javascript and VBA, before settling on Python for the vast majority of programming as the language of data science and AI. I wrote a bunch of code in my earlier startups but these days, of course, I utilize Mojo and the toolchain we have created around it.
For over 5 years you worked at Google as Senior Product Manager and Group Product Leader, where you helped to scale large parts of Google's AI infrastructure at Google Brain. What did you learn from this experience?
People are what build world-changing technologies and products, and it is a devoted group of people bound by a larger vision that brings them to the world. Google is an incredible company, with amazing people, and I was fortunate to meet and work with many of the brightest minds in AI years ago when I moved to join the Brain team. The greatest lessons I learnt were to always focus on the user and progressively disclose complexity, to empower users to tell their unique stories to the world like fixing the Greater Barrier Reef or helping people like Jason the Drummer, and to attract and assemble a diverse mix of people to drive towards a common goal. In a massive company of very smart and talented people, this is much harder than you can imagine. Reflecting on my time there, it’s always the people you worked with that are truly memorable. I will always look back fondly and appreciate that many people took risks on me, and I’m enormously thankful they did, as many of those risks encouraged me to be a better leader and person, to dive deep and truly understand AI systems. It truly made me realize the profound power AI has to impact the world, and this was the very reason I had the inspiration and courage to leave and co-found Modular.
Can you share the genesis story behind Modular?
Chris and I met at Google and shipped many influential technologies that have significantly impacted the world of AI today. However, we felt AI was being held back by overly complex and fragmented infrastructure that we witnessed first hand deploying large workloads to billions of users. We were motivated by a desire to accelerate the impact of AI on the world by lifting the industry towards production-quality AI software so we, as a global society, can have a greater impact on how we live. One can’t help but wonder how many problems AI can help solve, how many illnesses cured, how much more productive we can become as a species, to further our existence for future generations, by increasing the penetration of this incredible technology.
Having worked together for years on large scale critical AI infrastructure – we saw the enormous developer pain first hand – “why can’t things just work”? For the world to adopt and discover the enormous transformative nature of AI, we need software and developer infrastructure that scales from research to production, and is highly accessible. This will enable us to unlock the next way of scientific discoveries – of which AI will be critical – and is a grand engineering challenge. With this motivating background, we developed an intrinsic belief that we could set out to build a new approach for AI infrastructure, and empower developers everywhere to use AI to help make the world a better place. We are also very fortunate to have many people join us on this journey, and we have the world's best AI infrastructure team as a result.
Can you discuss how the Mojo programming language was initially built for your own team?
Modular’s vision is to enable AI to be used by anyone, anywhere. Everything we do at Modular is focused on that goal, and we walk backwards from that in the way we build out our products and our technology. In this light, our own developer velocity is what matters to us firstly, and having built so much of the existing AI infrastructure for the world – we needed to carefully consider what would enable our team to move faster. We have lived through the two-world language problem in AI – where researchers live in Python, and production and hardware engineers live in C++ – and we had no choice but to either barrel down that road, or rethink the approach entirely. We chose the latter. There was a clear need to solve this problem, but many different ways to solve it – we approached it with our strong belief of meeting the ecosystem where it is today, and enabling a simpler lift into the future. Our team bears the scars of software migration at large scale, and we didn’t want a repeat of that. We also realized that there is no language today, in our opinion, that can solve all the challenges we are attempting to solve for AI and so we undertook a first principles approach, and Mojo was born.
How does Mojo enable seamless scaling and portability across many types of hardware?
Chris, myself and our team at Google (many at Modular) helped bring MLIR into the world years ago – with the goal to help the global community solve real challenges by enabling AI models to be consistently represented and executed on any type of hardware. MLIR is a new type of open-source compiler infrastructure that has been adopted at scale, and is rapidly becoming the new standard for building compilers through LLVM. Given our team's history in creating this infrastructure, it's natural that we utilize it heavily at Modular and this underpins our state of the art approach in developing new AI infrastructure for the world. Critically, while MLIR is now being fast adopted, Mojo is the first language that really takes the power of MLIR and exposes it to developers in a unique and accessible way. This means it scales from Python developers who are writing applications, to Performance engineers who are deploying high performance code, to hardware engineers who are writing very low level system code for their unique hardware.
References to Mojo claim that it’s basically Python++, with the accessibility of Python and the high performance of C. Is this a gross oversimplification? How would you describe it?
Mojo should feel very familiar to any Python programmer, as it shares Python’s syntax. But there are a few important differences that you’ll see as one ports a simple Python program to Mojo, including that it will just work out of the box. One of our core goals for Mojo is to provide a superset of Python – that is, to make Mojo compatible with existing Python programs – and to embrace the CPython implementation for long-tail ecosystem support. Then enable you to slowly augment your code and replace non-performing parts with Mojo’s lower-level features to explicitly manage memory, add types, utilize autotuning and many other aspects to get the performance of C or better! We feel Mojo gives you get the best of both worlds and you don’t have to write, and rewrite, your algorithms in multiple languages. We appreciate Python++ is an enormous goal, and will be a multi-year endeavor, but we are committed to making it reality and enabling our legendary community of more than 140K+ developers to help us build the future together.
In a recent keynote it was showcased that Mojo is 35,000x faster than Python, how was this speed calculated?
It’s actually 68,000x now! But let's recognize that it's just a single program in Mandelbrot – you can go and read a series of three blog posts on how we achieved this – here, here and here. Of course, we’ve been doing this a long time and we know that performance games aren’t what drive language adoption (despite them being fun!) – it’s developer velocity, language usability, high quality toolchains & documentation, and a community utilizing the infrastructure to invent and build in ways we can’t even imagine. We are tool builders, and our goal is to empower the world to use our tools, to create amazing products and solve important problems. If we focus on our larger goal, it's actually to create a language that meets you where you are today and then lifts you easily to a better world. Mojo enables you to have a highly performant, usable, statically typed and portable language that seamlessly integrates with your existing Python code – giving you the best of both worlds. It enables you to realize the true power of the hardware with multithreading and parallelization in ways that raw Python today can not – unlocking the global developer community to have a single language that scales from top to bottom.
Mojo’s magic is its ability to unify programming languages with one set of tools, why Is this so important?
Languages always succeed by the power of their ecosystems and the communities that form around them. We’ve been working with open source communities for a long time, and we are incredibly thoughtful towards engaging in the right way and ensuring that we do right by the community. We’re working incredibly hard to ship our infrastructure, but need time to scale out our team – so we won’t have all the answers immediately, but we’ll get there. Stepping back, our goal is to lift the Python ecosystem by embracing the wholeexistingecosystem, and we aren’t seeking to fracture it like so many other projects. Interoperability just makes it easier for the community to try our infrastructure, without having to rewrite all their code, and that matters a lot for AI.
Also, we have learnt so much from the development of AI infrastructure and tools over the last ten years. The existing monolithic systems are not easily extensible or generalizable outside of their initial domain target and the consequence is a hugely fragmented AI deployment industry with dozens of toolchains that carry different tradeoffs and limitations. These design patterns have slowed the pace of innovation by being less usable, less portable, and harder to scale.
The next-generation AI system needs to be production-quality and meet developers where they are. It must not require an expensive rewrite, re-architecting, or re-basing of user code. It must be natively multi-framework, multi-cloud, and multi-hardware. It needs to combine the best performance and efficiency with the best usability. This is the only way to reduce fragmentation and unlock the next generation of hardware, data, and algorithmic innovations.
Modular recently announced raising $100 million in new funding, led by General Catalyst and filled by existing investors GV (Google Ventures), SV Angel, Greylock, and Factory. What should we expect next?
This new capital will primarily be used to grow our team, hiring the best people in AI infrastructure, and continuing to meet the enormous commercial demand that we are seeing for our platform. Modverse, our community of well over 130K+ developers and 10K’s of enterprises, are all seeking our infrastructure – so we want to make sure we keep scaling and working hard to develop it for them, and deliver it to them. We hold ourselves to an incredibly high standard, and the products we ship are a reflection of who we are as a team, and who we become as a company. If you know anyone who is driven, who loves the boundary of software and hardware, and who wants to help see AI penetrate the world in a meaningful and positive way – send them our way.
What is your vision for the future of programming?
Programming should be a skill that everyone in society can develop and utilize. For many, the “idea” of programming instantly conjures a picture of a developer writing out complex low level code that requires heavy math and logic – but it doesn’t have to be perceived that way. Technology has always been a great productivity enabler for society, and by making programming more accessible and usable, we can empower more people to embrace it. Empowering people to automate repetitive processes and make their lives simpler is a powerful way to give people more time back.
And in Python, we already have a wonderful language that has stood the test of time – it's the world's most popular language, with an incredible community – but it also has limitations. I believe we have a huge opportunity to make it even more powerful, and to encourage more of the world to embrace its beauty and simplicity. As I said earlier, it's about building products that have progressive disclosure of complexity – enabling high level abstractions, but scaling to incredibly low level ones as well. We are already witnessing a significant leap with AI models enabling progressive text-to-code translations – and these will only become more personalized over time – but behind this magical innovation is still a developer authoring and deploying code to power it. We’ve written about this in the past – AI will continue to unlock creativity and productivity across many programming languages, but I also believe Mojo will open the ecosystem aperture even further, empowering more accessibility, scalability and hardware portability to many more developers across the world.
To finish, AI will penetrate our lives in untold ways, and it will exist everywhere – so I hope Mojo catalyzes developers to go and solve the most important problems for humanity faster – no matter where they live in our world. I think that’s a future worth fighting for.
Thank you for the great interview, readers who wish to learn more should visit Modular.
Redis, Inc. today announced the integration of Redis Enterprise Cloud’s vector database capabilities with Amazon Bedrock, a service designed to facilitate the creation of generative AI applications using foundation models (FMs).
This integration will allow customers to ease the process of app creation by capitalizing on developer efficiency and scalability of a fully managed, high-performance database, while making it easy to use an array of leading foundation models (FMs) via API.
As a vector database along with Amazon Bedrock, Redis Enterprise Cloud will offer hybrid semantic search capabilities to pinpoint relevant data. It can also be deployed as an external domain-specific knowledge base. This allows LLMs to receive the most relevant and up-to-date context which improves result quality and reduces undesirable model hallucinations.
For organizations implementing Retrieval Augmented Generation (RAG) architectures or large language model (LLM) caching, this integration eliminates the need to build their own models, customize existing models, or share their proprietary data with a commercial LLM provider.
The integration of Redis Enterprise Cloud and Amazon Bedrock will be available through AWS Marketplace, further enhancing accessibility and convenience for developers and organizations.
“The combination of these robust serverless platforms will help accelerate generative AI application development through efficient infrastructure management and seamless scalability required by these applications.” said Tim Hall, chief product officer at Redis.
“Customers are keen to use techniques like RAG to ensure that FMs deliver accurate and contextualized responses. This integration of Amazon Bedrock and Redis Enterprise Cloud will help customers streamline their generative AI application development process by simplifying data ingestion, management, and RAG in a fully-managed serverless manner.” said Atul Deo, general manager of Amazon Bedrock at AWS.
Sergio Prada, CTO at Metal, highlighted the versatility and reliability of Redis Enterprise Cloud, noting its critical role in their platform’s success. This collaboration between Redis and AWS signifies a step forward in deploying Large Language Model (LLM) applications for enterprises.
The post Redis Enterprise Cloud Partners with Amazon Bedrock to Create Generative AI Apps appeared first on Analytics India Magazine.
Linear Regression is one of the most fundamental tools in machine learning. It is used to find a straight line that fits our data well. Even though it only works with simple straight-line patterns, understanding the math behind it helps us understand Gradient Descent and Loss Minimization methods. These are important for more complicated models used in all machine learning and deep learning tasks.
In this article, we'll roll up our sleeves and build Linear Regression from scratch using NumPy. Instead of using abstract implementations such as those provided by Scikit-Learn, we will start from the basics.
Dataset
We generate a dummy dataset using Scikit-Learn methods. We only use a single variable for now, but the implementation will be general that can train on any number of features.
The make_regression method provided by Scikit-Learn generates random linear regression datasets, with added Gaussian noise to add some randomness.
X, y = datasets.make_regression( n_samples=500, n_features=1, noise=15, random_state=4)
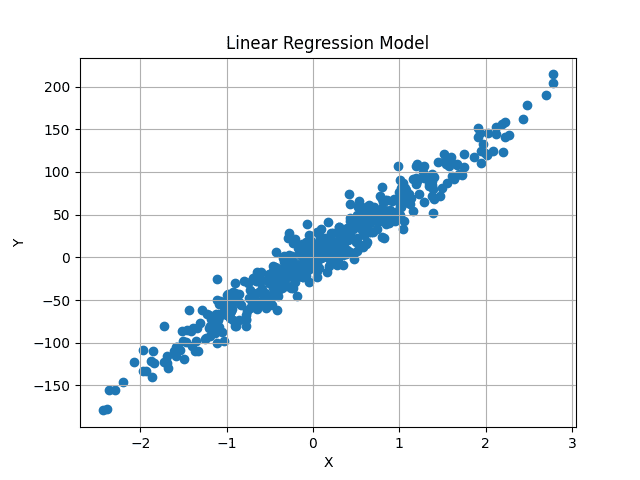
We generate 500 random values, each with 1 single feature. Therefore, X has shape (500, 1) and each of the 500 independent X values, has a corresponding y value. So, y also has shape (500, ).
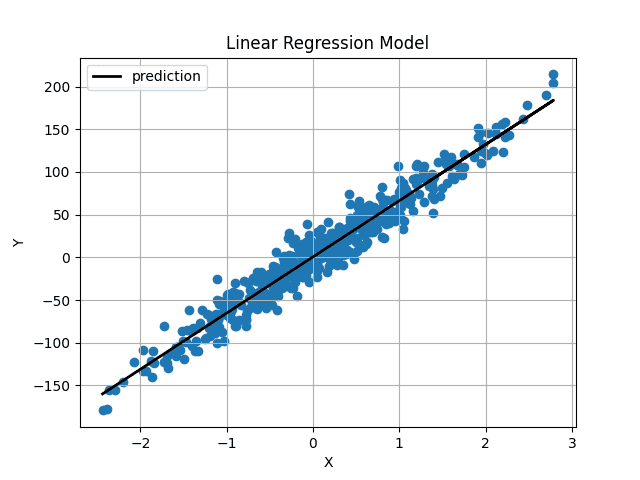
Visualized, the dataset looks as follows:
Image by Author
We aim to find a best-fit line that passes through the center of this data, minimizing the average difference between the predicted and original y values.
Intuition
The general equation for a linear line is:
y = m*X + b
X is numeric, single-valued. Here m and b represent the gradient and y-intercept (or bias). These are unknowns, and varying values of these can generate different lines. In machine learning, X is dependent on the data, and so are the y values. We only have control over m and b, that act as our model parameters. We aim to find optimal values of these two parameters, that generate a line that minimizes the difference between predicted and actual y values.
This extends to the scenario where X is multi-dimensional. In that case, the number of m values will equal the number of dimensions in our data. For example, if our data has three different features, we will have three different m values, called weights.
The equation will now become:
y = w1*X1 + w2*X2 + w3*X3 + b
This can then extend to any number of features.
But how do we know the optimal values of our bias and weight values? Well, we don’t. But we can iteratively find it out using Gradient Descent. We start with random values and change them slightly for multiple steps until we get close to the optimal values.
First, let us initialize Linear Regression, and we will go over the optimization process in greater detail later.
Initialize Linear Regression Class
import numpy as np class LinearRegression: def __init__(self, lr: int = 0.01, n_iters: int = 1000) -> None: self.lr = lr self.n_iters = n_iters self.weights = None self.bias = None
We use a learning rate and number of iterations hyperparameters, that will be explained later. The weights and biases are set to None because the number of weight parameters depends on the input features within the data. We do not have access to the data yet, so we initialize them to None for now.
The Fit Method
In the fit method, we are provided with data and their associated values. We can now use these, to initialize our weights, and then train the model to find optimal weights.
The independent feature X will be a NumPy array of shape (num_samples, num_features). In our case, the shape of X is (500, 1). Each row in our data will have an associated target value, so y is also of shape (500,) or (num_samples).
We extract this and randomly initialize the weights given the number of input features. So now our weights are also a NumPy array of size (num_features, ). Bias is a single value initialized to zero.
Predicting Y Values
We use the line equation discussed above to calculate predicted y values. However, instead of an iterative approach to sum all values, we can follow a vectorized approach for faster computation. Given that the weights and X values are NumPy arrays, we can use matrix multiplication to get predictions.
X has shape (num_samples, num_features) and weights have shape (num_features, ). We want the predictions to be of shape (num_samples, ) matching the original y values. Therefore we can multiply X with weights, or (num_samples, num_features) x (num_features, ) to obtain predictions of shape (num_samples, ).
The bias value is added at the end of each prediction. This can simply be implemented in a single line.
# y_pred shape should be N, 1 y_pred = np.dot(X, self.weights) + self.bias
However, are these predictions correct? Obviously not. We are using randomly initialized values for the weights and bias, so the predictions will also be random.
How do we get the optimal values? Gradient Descent.
Loss Function and Gradient Descent
Now that we have both predicted and target y values, we can find the difference between both values. Mean Square Error (MSE) is used to compare real-valued numbers. The equation is as follows:
We only care about the absolute difference between our values. A prediction higher than the original value is as bad as a lower prediction. So we square the difference between our target value and predictions, to convert negative differences to positive. Moreover, this penalizes a larger difference between targets and predictions, as higher differences squared will contribute more to the final loss.
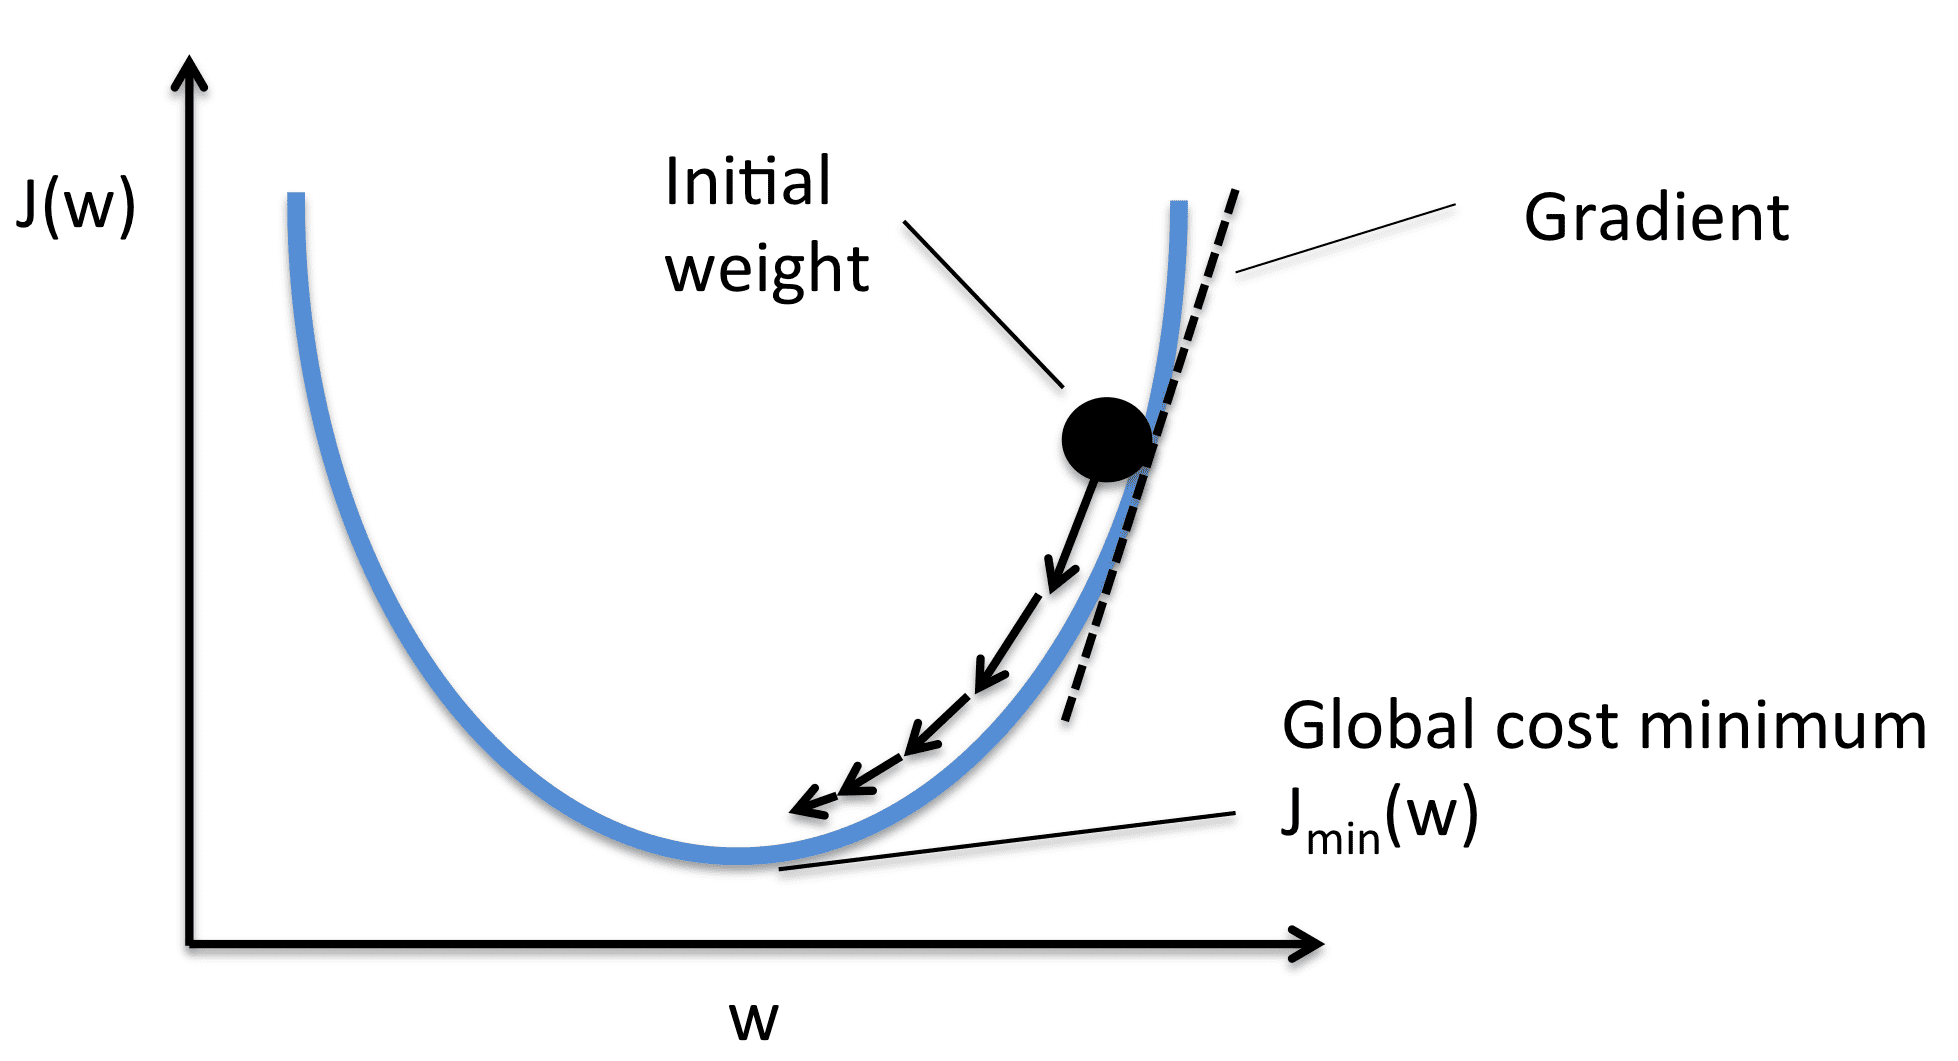
For our predictions to be as close to original targets as possible, we now try to minimize this function. The loss function will be minimum, where the gradient is zero. As we can only optimize our weights and bias values, we take the partial derivates of the MSE function with respect to weights and bias values.
We then optimize our weights given the gradient values, using Gradient Descent.
Image from Sebasitan Raschka
We take the gradient with respect to each weight value and then move them to the opposite of the gradient. This pushes the the loss towards minimum. As per the image, the gradient is positive, so we decrease the weight. This pushes the J(W) or loss towards the minimum value. Therefore, the optimization equations look as follows:
The learning rate (or alpha) controls the incremental steps shown in the image. We only make a small change in the value, for stable movement towards the minimum.
Implementation
If we simplify the derivate equation using basic algebraic manipulation, this becomes very simple to implement.
For the derivate, we implement this using two lines of code:
# X -> [ N, f ] # y_pred -> [ N ] # dw -> [ f ] dw = (1 / num_samples) * np.dot(X.T, y_pred - y) db = (1 / num_samples) * np.sum(y_pred - y)
dw is again of shape (num_features, ) So we have a separate derivate value for each weight. We optimize them separately. db has a single value.
To optimize the values now, we move the values in the opposite direction of the gradient using basic subtraction.
Again, this is only a single step. We only make a small change to the randomly initialized values. We now repeatedly perform the same steps, to converge towards a minimum.
The complete loop is as follows:
for i in range(self.n_iters): # y_pred shape should be N, 1 y_pred = np.dot(X, self.weights) + self.bias # X -> [N,f] # y_pred -> [N] # dw -> [f] dw = (1 / num_samples) * np.dot(X.T, y_pred - y) db = (1 / num_samples) * np.sum(y_pred - y) self.weights = self.weights - self.lr * dw self.bias = self.bias - self.lr * db
Prediction
We predict the same way as we did during training. However, now we have the optimal set of weights and biases. The predicted values should now be close to the original values.
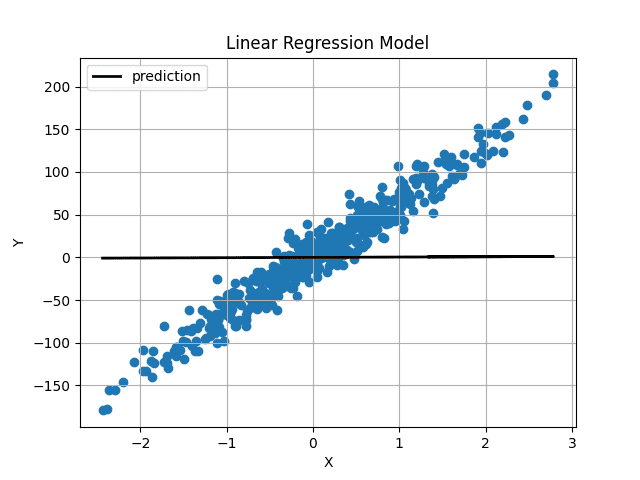
With randomly initialized weights and bias, our predictions were as follows:
Image by Author Weight and bias were initialized very close to 0, so we obtain a horizontal line. After training the model for 1000 iterations, we get this:
Image by Author
The predicted line passes right through the center of our data and seems to be the best-fit line possible.
Conclusion
You have now implemented Linear Regression from scratch. The complete code is also available on GitHub.
import numpy as np class LinearRegression: def __init__(self, lr: int = 0.01, n_iters: int = 1000) -> None: self.lr = lr self.n_iters = n_iters self.weights = None self.bias = None def fit(self, X, y): num_samples, num_features = X.shape # X shape [N, f] self.weights = np.random.rand(num_features) # W shape [f, 1] self.bias = 0 for i in range(self.n_iters): # y_pred shape should be N, 1 y_pred = np.dot(X, self.weights) + self.bias # X -> [N,f] # y_pred -> [N] # dw -> [f] dw = (1 / num_samples) * np.dot(X.T, y_pred - y) db = (1 / num_samples) * np.sum(y_pred - y) self.weights = self.weights - self.lr * dw self.bias = self.bias - self.lr * db return self def predict(self, X): return np.dot(X, self.weights) + self.bias
Muhammad Arham is a Deep Learning Engineer working in Computer Vision and Natural Language Processing. He has worked on the deployment and optimizations of several generative AI applications that reached the global top charts at Vyro.AI. He is interested in building and optimizing machine learning models for intelligent systems and believes in continual improvement.
More On This Topic
Comparing Linear and Logistic Regression
3 Reasons Why You Should Use Linear Regression Models Instead of Neural…
Linear vs Logistic Regression: A Succinct Explanation
KDnuggets News 22:n12, March 23: Best Data Science Books for Beginners;…
Linear Regression for Data Science
Making Predictions: A Beginner's Guide to Linear Regression in Python
Working as a data scientist is the dream of many IT professionals these days. It is no secret that data science is a skyrocketing field attracting young professionals and inspiring many to switch careers to data science. On one front are young professionals who study their courses in colleges to pursue their dream of becoming data scientists and on the other are professionals seeking to enrol in short courses with computing, business analytics, and applied science skills that they already have to switch careers. But are these short courses and data science certifications worth the time and money? Let’s find out.
Benefits of earning data science certifications
Earning a data science certification amid demand for skilled data scientists is a good data science career move. Here’s why:
Skill Validation:
Enrolling in a professional data science certificate offers a valuable opportunity to validate your expertise. These programs, often backed by respected reputed educational institutions, require rigorous examinations to assess your grasp of essential concepts, tools, and methods. Acquiring certification serves as tangible proof of your proficiency, elevating your credibility and setting you apart in a competitive job market.
Networking Benefits:
A certification program offers chances to connect with peers, instructors, and industry experts. Building a network within the data science community can lead to valuable insights, job prospects, and collaborations. It is always good to have access to exclusive forums and alumni groups, that nurture a supportive network and enhance your learning and career development.
Highlighting Expertise:
In the expansive realm of Data Science, there are various specializations, including data engineering, machine learning, data visualization, and more. To match your interests and career aspirations, select a certification program aligned with your desired specialization. By obtaining certification in a specific Data Science area, you demonstrate your dedication to becoming a specialist in that field, positioning yourself as a highly desirable professional in your chosen niche.
Career Advancement:
In today’s data-driven world, organizations actively hunt for skilled data scientists capable of leveraging data for strategic advantage. Possessing a Data Science certification significantly boosts your career prospects and unlocks a plethora of job opportunities. Whether you’re entering the Data Science field or aiming for career progression, certification becomes a pivotal asset in securing your desired position.
Competitive Pay
The high demand for professionals with comprehensive data science skills translates into attractive salaries. Obtaining a data science certification can significantly boost your income compared to non-certified peers. Additionally, with organizations increasingly embracing data-driven approaches, certified data scientists can expect enhanced job security and career stability.
Factors to consider before choosing data science certifications
Not every certification can be an ideal choice for a successful data science career. It is important to consider multiple factors before registering for one.
Syllabus Complexity: It’s essential to gauge the syllabus’s scope and its level of difficulty. Evaluating how well the program is structured and determining the ideal expertise level for a seamless learning experience is crucial.
Study Materials and Outcomes: Beyond assessing difficulty, understanding the program’s content and expected outcomes is vital. Align the study material with learning objectives, and consider hands-on projects and other features to make an informed decision.
Duration: The duration of each course plays a pivotal role in planning your learning journey. Knowing the expected course length allows you to create a suitable learning schedule.
Prerequisite Skills: Some certification programs may require specific skills or prerequisites. Therefore, it’s essential to be aware of the eligibility criteria for courses before enrolling.
Course Cost: Cost is a significant factor to consider when choosing a data science certification. With options ranging from free to USD600 or more, it’s important to select a program that aligns with your budget.
Top choices for 2023
The U.S. Bureau of Labor Statistics anticipates a significant 27.9 percent surge in the demand for professionals with data science expertise by 2026. Obtaining a certification will not only enhance your skills but also equip you with the in-demand skills of the present moment.
SAS Certified Data Scientist
Senior Data Scientist (SDSTM) by Data Science Council of America
Open Certified Data Scientist (Open CDS)
Microsoft Certified: Azure Data Scientist Associate
You can visit the websites of the aforementioned certifications and check their curriculum, exam fees, and the duration required to complete the program. This will help you choose the certification that best suits your career requirements and your organizational goals.
Final thoughts
Data science is a highly sought-after profession that can empower you to make critical business decisions. These certifications on the list will enable you to become a data science expert, as they are comprehensive programs that include a wide range of topics.
Believing that the missing piece to get to AGI is the part where machines have the ability to think or rather have ‘common sense’, former Google DeepMind senior research scientist with a PhD from MIT, Tejas Kulkarni, started Common Sense Machines (CSM). Kulkarni along with Max Kleiman-Weiner, PhD researcher from MIT, and scout investor at Sequoia Capital, started CSM, an end-to-end generative AI platform that creates game-engine ready content. “By 2019 it was clear that LLMs were beginning to work, and image generation was also pretty far along. It was evident that 3D would be next, and the core problem that we had to solve was image to 3d.” said Kulkarni, who believes that 3D has been an unsolved problem in AI for a long time.
@CSM_ai is probably the first fully self serve GenAi tool that I see generating convincing 3D models from stylised input. And using a single image, nonetheless. https://t.co/rkoTvIyeE6
— Ben (@cocolitron) July 1, 2023
Enabling Gamers
With everyone on the way to becoming a gamer, Jensen Huang, chief of NVIDIA, recently told AIM on how AI has revolutionised computer graphics and even exclaimed on how companies are now training AI agents on games to “build something crazy.” In comes CSM-kind of companies that build 3D assets which can be integrated into games and metaverse. “CSM is building content creation layers where our products can go into Omniverse, and a myriad of other engines,” said Kulkarni. UGC (user-generated content) creators consisting of gamers, hobbyists, and professionals who want to ideate, create assets using CSM, and use a 3d printer to build the model, serve as their core audience. “For UGC, you need to build easier intuitive forms of user experiences,” he said. 3D artists, studios, animators, robotics companies and people building visualisation architecture also form their target audience.
GPT of The 3D World
Recently, the company released CSM Cube that allows various modalities for input such as image, video and text. The 3D foundation models are built on an inference stack that combines techniques derived from geometric deep learning, diffusion models, neural radiance fields, computer graphics and 3D computer vision.
“We were the first to build an image to 3D model at our scale- nobody had created it. There isn’t a GPT of this world yet,” stated Kulkarni and acknowledges that CSM is still building such an architecture, with no such precedent. “In terms of algorithms, I think it’s a wild wild west, so nobody knows.”
Building ‘Common Sense’
By creating a 3D environment, one can give an understanding of the physical field. “Right now LLMs predict text but they don’t really have an understanding of objects, people, agents, beliefs, goals and spaces. Whether it’s in a virtual environment or physical environment, that capability is still quite missing in current AI systems,” said Kulkarni. “ Here, we are first creating assets, and then we’re gonna give them movement and then they’re gonna have common sense.”
In a far-fetched goal, CSM would build assets that can probably operate just like how a real character would operate in this environment. A similar development was last tested with AI agents in a virtual world, where a group of researchers from Stanford and Google created 25 AI agents/avatars with different identities that interacted and simulated believable human behaviour.
Kulkarni also spoke about the current gaps in transformer models that can prevent machines from thinking on their own : every token in a transformer model is not grounded (the process of connecting or linking words, and concepts used in language to their real-world referents or meanings). Currently, the tokens are misaligned which leads to hallucinations, and people try ways to solve it which doesn’t get resolved. “I think if you really want to solve the problem, there’s an existence proof which is humans. Unless we ground each word to everything that that object refers to, the missing bits will remain.
Evading Competition Until Now
Founded in 2020, Common Sense Machines has raised a total of $10M in funding, and is backed by VC corporations Intel Capital, Toyota Ventures among others. With a team of 15 people, CSM is working on new developments, and an API option will be soon offered to users. However, competition is shaping up in the field.
“In the last two years, we were playing in no man’s land, but I think now we have escaped that. Now the question is, how do we navigate?” Considering having a head start in the space, Kulkarni is not worried about big tech , which are aligned, but rather other content companies that may be more threatening – “I think all the usual suspects like media companies such as Shutterstock, Getty, older content companies, and game engines such as Unity and Unreal.”
Talking about Midjourney, which Kulkarni counts as a new generation startup, he said that they will probably experiment with 3D as well, but how deep will they go or become discord focused is what needs to be seen. Interestingly, Nick St. Pierre, creative director and community developer in AI and art, tweeted that Midjourney is working on 3D and it might be released soon. However, it will not generate mesh (a 3D object’s surface geometry) but will be more focused on general quality of reflections, transparency, and light field-like outputs like NeRFs – placing CSM ahead at the moment.
The post Bringing ‘Common Sense’ into Machines with Former Google DeepMind Scientist appeared first on Analytics India Magazine.
In this article, I will briefly explain the randomized controlled experiments and why modern companies use them to make data-driven decisions. Then, I will introduce you to a CUPED procedure that improves the sensitivity of these experiments. After that, I will show you why it works in theory and practice. We will simulate an ordinary A/B test and compare results with the CUPED-adjusted procedure. We will see empirically that CUPED allows the detection of more minor effects on the same sample size.
What are controlled experiments, and why do we need them
Controlled experiments, a cornerstone of data science, are systematic and controlled approaches used to investigate the impact of specific changes, interventions, or treatments on a target system. In these experiments, researchers manipulate one or more variables while keeping other factors constant, creating a controlled environment to accurately observe and measure the effects. The goal is to establish a causal relationship between the manipulated variables and the observed outcomes. Controlled experiments provide valuable insights into cause-and-effect relationships, enabling data scientists, researchers, and decision-makers to make informed choices based on empirical evidence rather than mere correlations or assumptions.
Usually, people encounter controlled experiments in the form of A/B tests. In an A/B test, a single variable (such as a webpage design, machine learning algorithm, or pricing plan) is changed between two versions: A (the control) and B (the variant). The goal of an A/B test is to compare the performance of these two versions to determine which one performs better in a specific metric (e.g., click-through rates, revenue). A/B tests are commonly used in marketing and web optimization to make data-driven decisions about changes to user interfaces or marketing material.
To perform an A/B test, you have to gather some data. The amount of data you need is directly connected to the variance of the metric you want to compare between two groups. The more the chosen metric fluctuates naturally, the more data you need to spot the difference between the two groups. The more data you need, the longer you wait until you get the results. And time is money! That is why Microsoft researchers developed a CUPED technique. This statistical trick helps you to decrease the variance of the tested metric. With lower variance, you need a smaller sample size to spot the same difference, or you can spot a smaller one with the same sample size.
What is CUPED and how it works?
CUPED stands for “Controlled-Experiment using Pre-Experiment Data.” The idea is simple: modify the metric of interest in a way that its expectation does not change while variance decreases. The exciting part is how to do so!
Suppose you want to test if there is a difference in metric Y. In a usual A/B test, you would calculate mean value of the metric in control group A and then compare it with mean value of the metric in test group B.
Researchers suggested this transformation:
hat{Y}_{CUPED} = bar{Y} - theta(bar{X} - E(X))
Where X is a random variable correlated with Y but not affected by the A/B test, and theta is some arbitrary (for now) constant.
A great candidate for X is the same metric Y but before the start of the test. Hence, there is “pre-experiment” in the name of the method.
But how does this help to decrease variance and not mess up the results? The theoretical explanation in the paper needed to be more specific for me. So, let us derive results by ourselves.
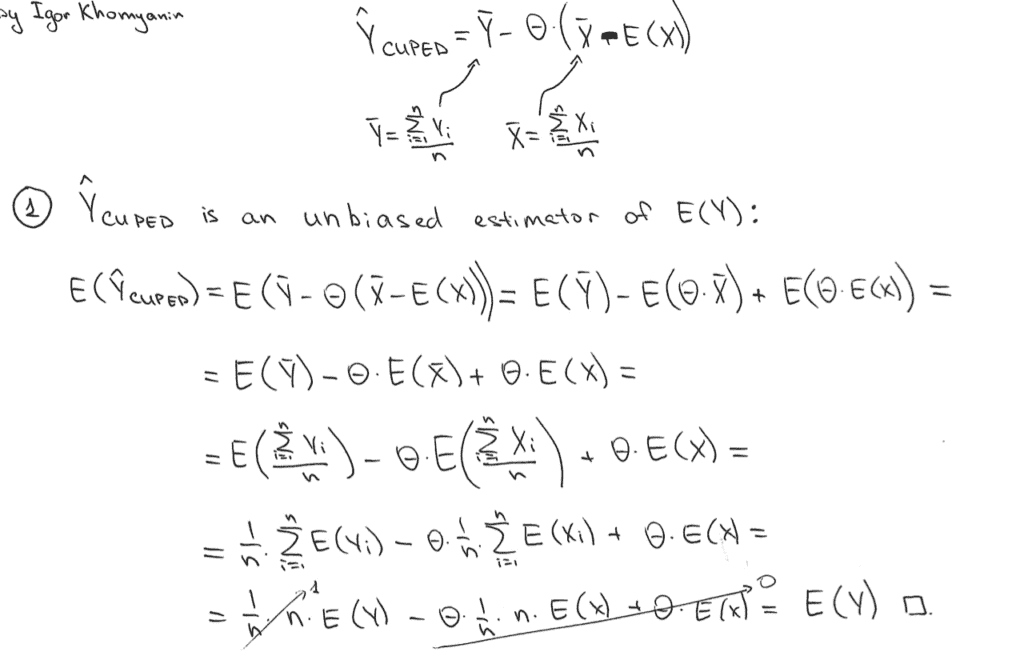
First of all, Y_CUPED is an unbiased estimator of E(Y):
Courtesy of the author
Secondly, let us derive the Var(Y_CUPED):
Courtesy of the author
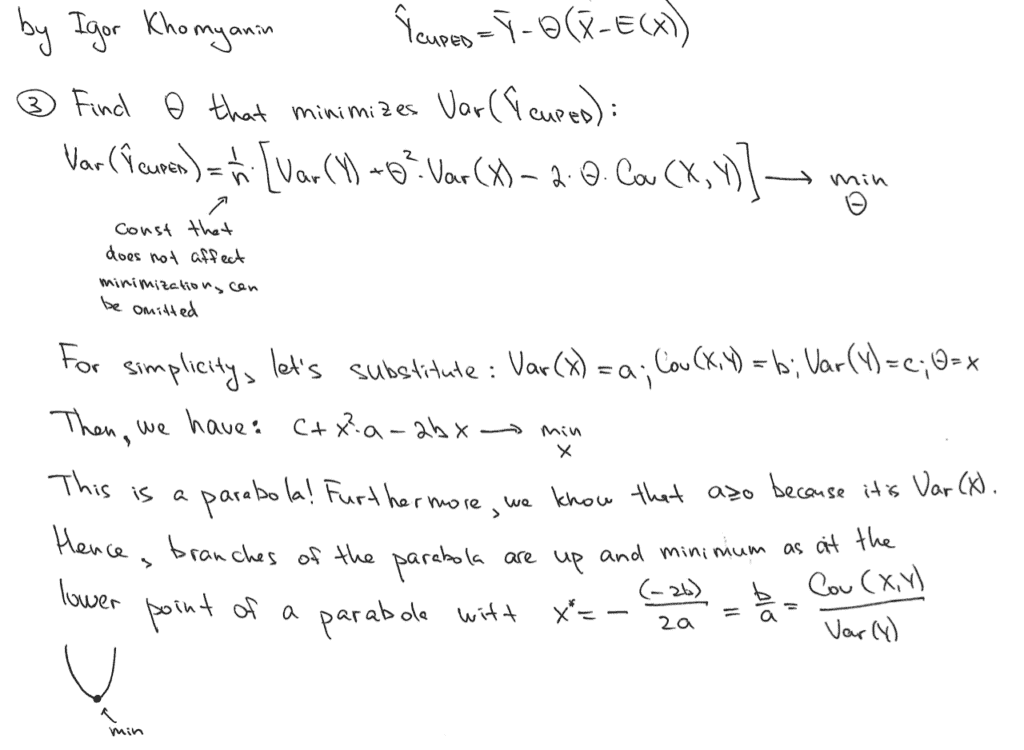
Now, let us find a value of theta that minimizes this variance:
Courtesy of the author
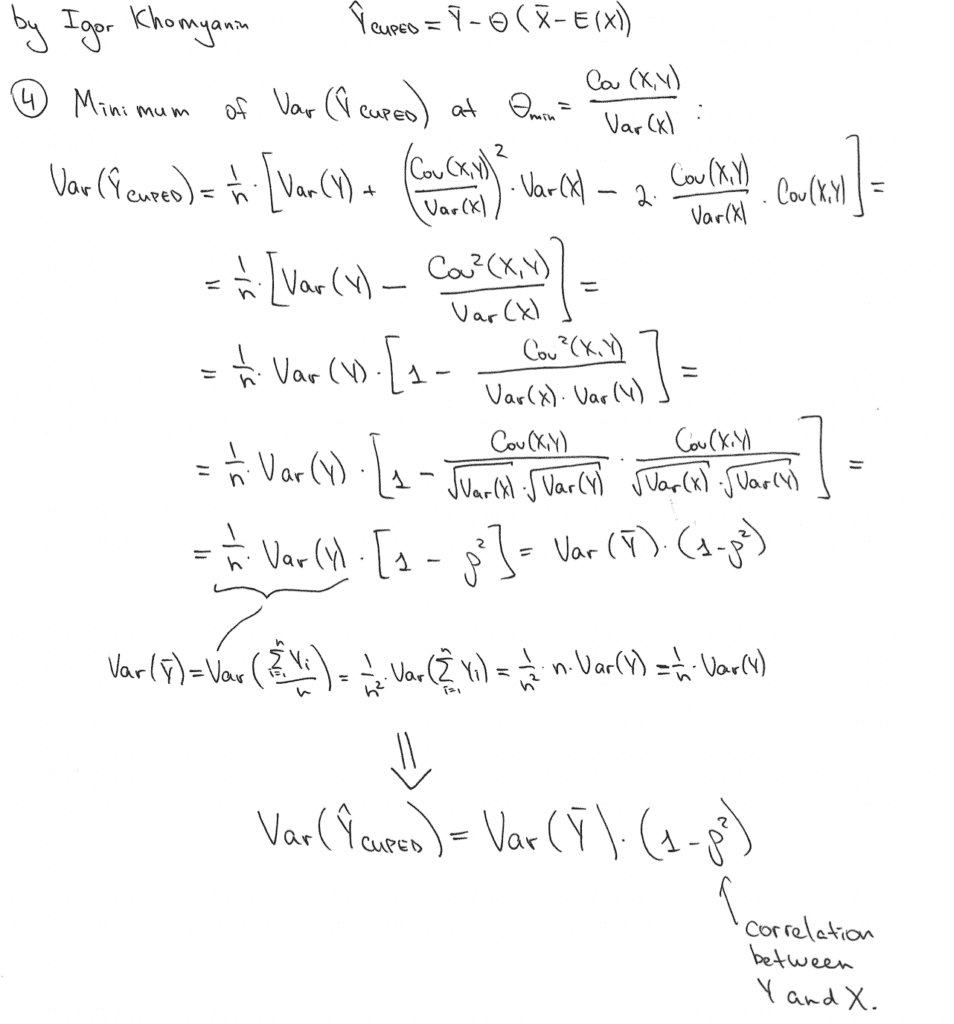
With such theta we will have Var(Y_CUPED):
Courtesy of the author
Cool! Variance is (1 - rho^2) times smaller that the variance of our initial estimate Var(Y_bar)! The higher the correlation between X and Y, the higher the variance reduction power.
How to use CUPED in practice?
Enough theory for today! Let us apply this technique to a real-world problem.
Suppose we are working for some food delivery service (like Uber Eats, for example). Each restaurant has a display of meals users can order. There are so many meals that we want to recommend something to the user to speed up the choosing process. The faster he places an order, the quicker he gets his food, and the faster he becomes happy!
We already have a recommendation engine A, but the ML team has introduced another recommendation engine B. Now we want to understand which engine is better. We need an A/B test! Let us randomly expose each user to either engine A or engine B. Now, we need a metric to compare between two groups. Money is the best metric as each business tries to maximize its profits. So, let us measure the commission revenue from users within two weeks.
I have prepared a simple dataset that represents this A/B test. Each row represents a user. Here is an explanation of what each column means:
group – is either test or control; if it is test, then the user is in the group with new recommendation engine
user_id – a unique identifier of a user
commission_revenue_pre – commission revenue company got from orders of this user in a pre-experiment period
commission_revenue_exp – commission revenue company for from order of this user during an experiment period
The only thing different from real life here is that I know exactly how a new engine impacts the metric. If a user is exposed to engine B, his commission_revenue_exp will increase by 2%.
Let us do the usual A/B test comparing average commission_revenue_exp for two engines using a t-test (assume that all assumptions hold, and we can use it here).
First of all, we need to import some useful libraries.
import matplotlib.pyplot as plt import numpy as np import pandas as pd from scipy import stats
Let’s have a look at the average commission revenue during the experiment in two groups:
commission_revenue_exp_test_avg = exp_data[exp_data['group'] == 'test']['commission_revenue_exp'].mean() commission_revenue_exp_control_avg = exp_data[exp_data['group'] == 'control']['commission_revenue_exp'].mean() print(f'In a test group (new engine B), the metric is on average equal to {commission_revenue_exp_test_avg:0.2f}') print(f'In a control group (old engine A), the metric is on average equal to {commission_revenue_exp_control_avg:0.2f}') print(f'Relative increase is equal to {100.0 * (commission_revenue_exp_test_avg / commission_revenue_exp_control_avg - 1):0.1f}%') # Returns: # > In a test group (new engine B), the metric is on average equal to 101.73 # > In a control group (old engine A), the metric is on average equal to 99.24 # > Relative increase is equal to 2.5%
We already know that engine B increases metric by two percent because data was synthetically created. But in the real world, we need to run some statistical procedures to understand whether this increase is statistically significant. Maybe we were just lucky to get this result.
Using Student’s t-tets, we can test a hypothesis of zero difference in the averages of two groups. Let’s use alpha equal to 0.05 for this test, meaning that we will test this hypothesis at a 5% significance level.
We got a p-value near 0.07, which is definitely greater than 0.05 / 2=0.025. Then, we cannot reject the null hypothesis of equal averages. This means we did not see any statistically significant improvement in the target metric from using the new recommendation engine B in production.
You may ask how this happened, if we know there must be an increase of 2%. When we have an infinite number of observations, sample means are equal to population means (because of central limit theorem). Unfortunately, we have to operate with finite samples in our experiments. This introduces some variation in our estimates of the parameters of distributions. So, we always have some margin of error in our estimates. And the smaller the sample size, the bigger the margin or error. When the sample size is not big enough, we cannot say that the difference between two samples is not present because of random associated with finite sample size.
As discussed earlier, CUPED can help us improve sensitivity by decreasing the metric variance we compare between two groups. Ultimately, this means we can detect smaller parameter changes for the same sample size. Let’s make a CUPED transformation using commission_revenue_pre. We can do so because commission_revenue_pre is highly likely to be correlated with commission_revenue_exp because this is the same metric of the same users but in different time periods. But commission_revenue_pre is not affected by the new engine B because engine B was introduced after the metric was calculated. Hence, commission_revenue_pre is a fantastic candidate for X.
A closer look at the data shows that not all users have a commission_revenue_pre defined. This is absolutely normal in the real world – some users do not have pre-experiment data because they were not users before the experiment! We need to understand what to do with “newbies”. Here, we can rely on the experience of Booking.com on how to handle missing data. They suggest to do nothing to the metric in case pre-experiment data is not available. The idea behind this trick is straightforward. When there is a missing value, you want to fill it with an average derived from the samples where this value is not missing. So, you will plug X_bar into the X_i in CUPED transformation, and it will be canceled out with E(X) with a big enough sample size!
Now, let’s calculate theta, handle missing values, and make sure that the CUPED transformation yields an unbiased estimate:
commission_revenue_exp_cuped_test_avg = exp_data[exp_data['group'] == 'test']['commission_revenue_exp_cuped'].mean() commission_revenue_exp_cuped_control_avg = exp_data[exp_data['group'] == 'control']['commission_revenue_exp_cuped'].mean() print(f'In a test group (new engine B), the CUPED-metric is on average equal to {commission_revenue_exp_cuped_test_avg:0.2f}') print(f'In a control group (old engine A), the CUPED_metric is on average equal to {commission_revenue_exp_cuped_control_avg:0.2f}') print(f'Relative increase is equal to {100.0 * (commission_revenue_exp_cuped_test_avg / commission_revenue_exp_cuped_control_avg - 1):0.1f}%') # Returns: # > In a test group (new engine B), the CUPED-metric is on average equal to 101.69 # > In a control group (old engine A), the CUPED_metric is on average equal to 99.28 # > Relative increase is equal to 2.4%
In the test group, we got 101.73 before transformation and 101.69 after. A 0.04 absolute difference appears because we have missing pre-experiment data. If there were no missing values, the values would match exactly. Consider the proof of that fact as a take-home exercise.
Somewhere above, we have proved that the variance of sample average CUPED-metric is (1 - rho^2) times smaller, where rho is a correlation between X and Y. So, we must see this in the data also.
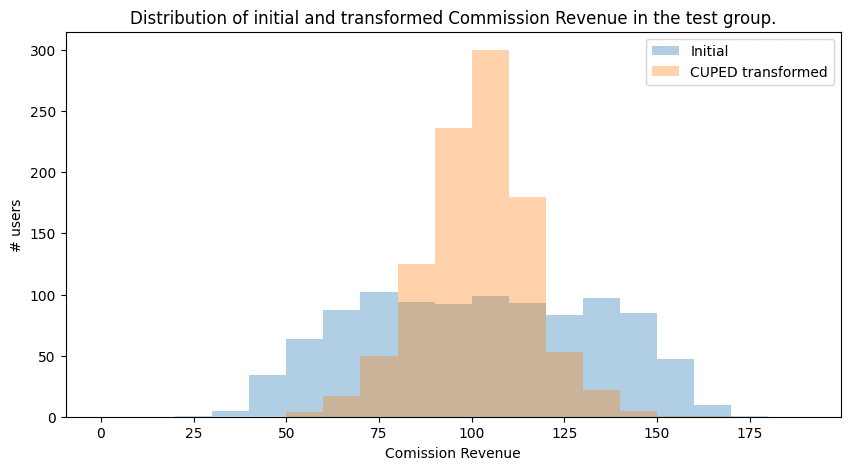
A decrease in variance can also be visualized easily. We assume that the metric is normally distributed. Metric with lower variance would have a “slimmer” probability mass function with a “taller” peak:
plt.figure(figsize=(10, 5)) plt.hist(exp_data[exp_data['group'] == 'test']['commission_revenue_exp'], bins=np.arange(0.0, 200.0, 10.0), alpha=0.35, label='Initial') plt.hist(exp_data[exp_data['group'] == 'test']['commission_revenue_exp_cuped'], bins=np.arange(0.0, 200.0, 10.0), alpha=0.35, label='CUPED transformed') plt.legend() plt.xlabel('Comission Revenue') plt.ylabel('# users') plt.title('Distribution of initial and transformed Commission Revenue in the test group.') plt.savefig('./output/distributions.png', bbox_inches='tight', dpi=100) plt.show()
Courtesy of the author
We are sure the transformed metric is an unbiased estimator empirically and theoretically. We have seen that variance indeed decreases with such transformation. It is time to rerun our A/B test using the transformed metric.
The p-value is 0.0002, lower than 0.025 by at least one order! Finally, we’ve got a statistically significant result! We now have statistical and data-driven proof that the engine’s B recommendations increase commission revenue. Based on the results, we can recommend rolling out new functionality to 100% of users to increase the metric by two 2% of the full scale of a company.
Conclusion
I hope now it is clear what CUPED is and how it can enhance your A/B experiments in production. In the article, we went through the theoretical foundations of CUPED and had hands-on experience applying it to a real-life A/B test.
If you have any questions, do not hesitate to reach out on LinkedIn 🙂
Notebook with all the code can be found in my GitHub repo.
References
Kohavi, Ron & Deng, Alex & Xu, Ya & Walker, Toby. (2013). Improving the Sensitivity of Online Controlled Experiments by Utilizing Pre-Experiment Data. 10.1145/2433396.2433413.
“How Booking.com increases the power of online experiments with CUPED” by Simon Jackson at https://booking.ai/how-booking-com-increases-the-power-of-online-experiments-with-cuped-995d186fff1d