Your Features Are Important? It Doesn’t Mean They Are Good

Your Features Are Important? It Doesn’t Mean They Are Good
[Image by Author]
“Important” and “Good” Are Not Synonyms

The concept of “feature importance” is widely used in machine learning as the most basic type of model explainability. For example, it is used in Recursive Feature Elimination (RFE), to iteratively drop the least important feature of the model.

However, there is a misconception about it.

The fact that a feature is important doesn’t imply that it is beneficial for the model!

Indeed, when we say that a feature is important, this simply means that the feature brings a high contribution to the predictions made by the model. But we should consider that such contribution may be wrong.

Take a simple example: a data scientist accidentally forgets the Customer ID between its model’s features. The model uses Customer ID as a highly predictive feature. As a consequence, this feature will have a high feature importance even if it is actually worsening the model, because it cannot work well on unseen data.

To make things clearer, we will need to make a distinction between two concepts:

  • Prediction Contribution: what part of the predictions is due to the feature; this is equivalent to feature importance.
  • Error Contribution: what part of the prediction errors is due to the presence of the feature in the model.

In this article, we will see how to calculate these quantities and how to use them to get valuable insights about a predictive model (and to improve it).

Note: this article is focused on the regression case. If you are more interested in the classification case, you can read “Which features are harmful for your classification model?”

Starting from a Toy Example

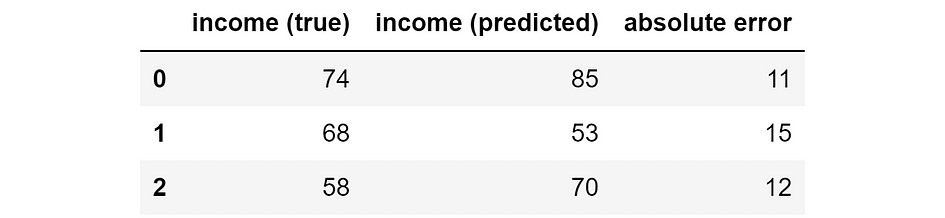
Suppose we built a model to predict the income of people based on their job, age, and nationality. Now we use the model to make predictions on three people.

Thus, we have the ground truth, the model prediction, and the resulting error:
Your Features Are Important? It Doesn’t Mean They Are Good
Ground truth, model prediction, and absolute error (in thousands of $). [Image by Author]
Computing “Prediction Contribution”

When we have a predictive model, we can always decompose the model predictions into the contributions brought by the single features. This can be done through SHAP values (if you don’t know about how SHAP values work, you can read my article: SHAP Values Explained Exactly How You Wished Someone Explained to You).

So, let’s say these are the SHAP values relative to our model for the three individuals.

Your Features Are Important? It Doesn’t Mean They Are Good
SHAP values for our model’s predictions (in thousands of $). [Image by Author]

The main property of SHAP values is that they are additive. This means that — by taking the sum of each row — we will obtain our model’s prediction for that individual. For instance, if we take the second row: 72k $ +3k $ -22k $ = 53k $, which is exactly the model’s prediction for the second individual.

Now, SHAP values are a good indicator of how important a feature is for our predictions. Indeed, the higher the (absolute) SHAP value, the more influential the feature for the prediction about that specific individual. Note that I am talking about absolute SHAP values because the sign here doesn’t matter: a feature is equally important if it pushes the prediction up or down.

Therefore, the Prediction Contribution of a feature is equal to the mean of the absolute SHAP values of that feature. If you have the SHAP values stored in a Pandas dataframe, this is as simple as:

prediction_contribution = shap_values.abs().mean()

In our example, this is the result:

Your Features Are Important? It Doesn’t Mean They Are Good
Prediction Contribution. [Image by Author]

As you can see, job is clearly the most important feature since, on average, it accounts for 71.67k $ of the final prediction. Nationality and age are respectively the second and the third most relevant feature.

However, the fact that a given feature accounts for a relevant part of the final prediction doesn’t tell anything about the feature’s performance. To consider also this aspect, we will need to compute the “Error Contribution”.

Computing “Error Contribution”

Let’s say that we want to answer the following question: “What predictions would the model make if it didn’t have the feature job?” SHAP values allow us to answer this question. In fact, since they are additive, it’s enough to subtract the SHAP values relative to the feature job from the predictions made by the model.

Of course, we can repeat this procedure for each feature. In Pandas:

y_pred_wo_feature = shap_values.apply(lambda feature: y_pred - feature)

This is the outcome:

Your Features Are Important? It Doesn’t Mean They Are Good
Predictions that we would obtain if we removed the respective feature. [Image by Author]

This means that, if we didn’t have the feature job, then the model would predict 20k $ for the first individual, -19k $ for the second one, and -8k $ for the third one. Instead, if we didn’t have the feature age, the model would predict 73k $ for the first individual, 50k $ for the second one, and so on.

As you can see, the predictions for each individual vary a lot if we removed different features. As a consequence, also the prediction errors would be very different. We can easily compute them:

abs_error_wo_feature = y_pred_wo_feature.apply(lambda feature: (y_true - feature).abs())

The result is the following:

Your Features Are Important? It Doesn’t Mean They Are Good
Absolute errors that we would obtain if we removed the respective feature. [Image by Author]

These are the errors that we would obtain if we removed the respective feature. Intuitively, if the error is small, then removing the feature is not a problem — or it’s even beneficial — for the model. If the error is high, then removing the feature is not a good idea.

But we can do more than this. Indeed, we can compute the difference between the errors of the full model and the errors we would obtain without the feature:

error_diff = abs_error_wo_feature.apply(lambda feature: abs_error - feature)

Which is:

Your Features Are Important? It Doesn’t Mean They Are Good
Difference between the errors of the model and the errors we would have without the feature. [Image by Author]

If this number is:

  • negative, then the presence of the feature leads to a reduction in the prediction error, so the feature works well for that observation!
  • positive, then the presence of the feature leads to an increase in the prediction error, so the feature is bad for that observation.

We can compute “Error Contribution” as the mean of these values, for each feature. In Pandas:

error_contribution = error_diff.mean()

This is the outcome:

Your Features Are Important? It Doesn’t Mean They Are Good
Error Contribution. [Image by Author]

If this value is positive, then it means that, on average, the presence of the feature in the model leads to a higher error. Thus, without that feature, the prediction would have been generally better. In other words, the feature is making more harm than good!

On the contrary, the more negative this value, the more beneficial the feature is for the predictions since its presence leads to smaller errors.

Let’s try to use these concepts on a real dataset.

Predicting Gold Returns

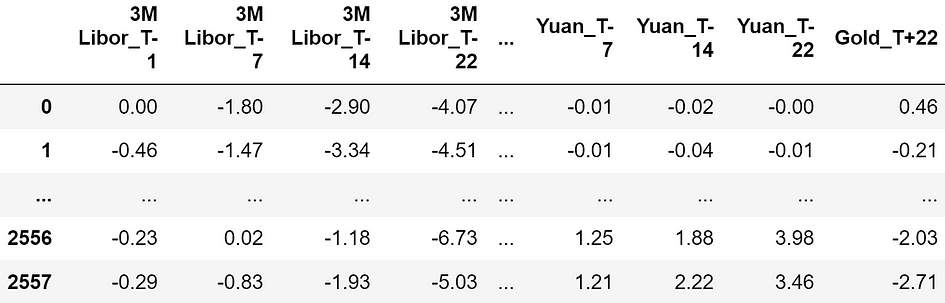
Hereafter, I will use a dataset taken from Pycaret (a Python library under MIT license). The dataset is called “Gold” and it contains time series of financial data.
Your Features Are Important? It Doesn’t Mean They Are Good
Dataset sample. The features are all expressed in percentage, so -4.07 means a return of -4.07%. [Image by Author]

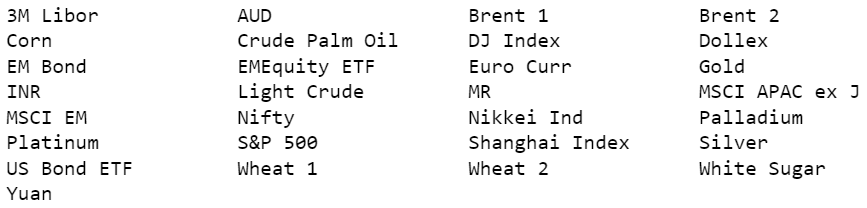
The features consist in the returns of financial assets respectively 22, 14, 7, and 1 days before the observation moment (“T-22”, “T-14”, “T-7”, “T-1”). Here is the exhaustive list of all the financial assets used as predictive features:
Your Features Are Important? It Doesn’t Mean They Are Good
List of the available assets. Each asset is observed at time -22, -14, -7, and -1. [Image by Author]

In total, we have 120 features.

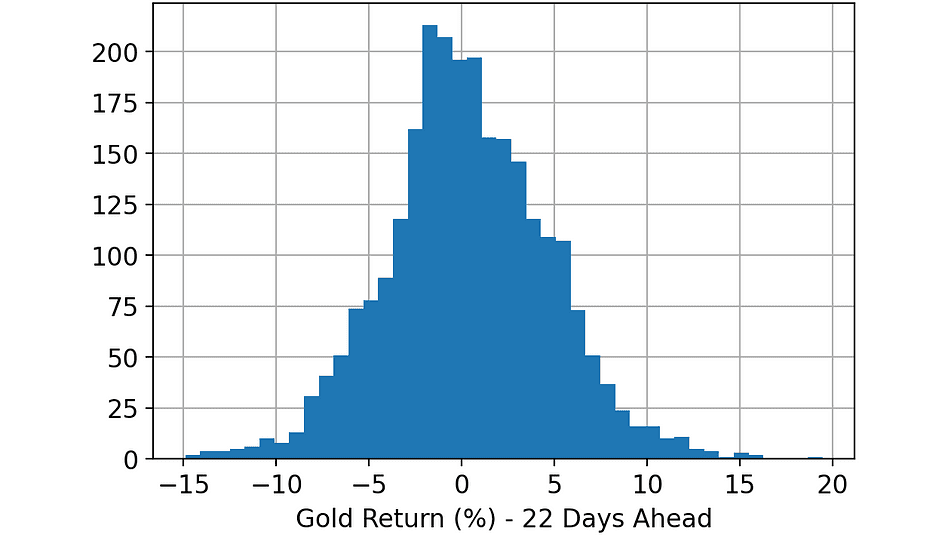
The goal is to predict the Gold price (return) 22 days ahead in time (“Gold_T+22”). Let’s take a look at the target variable.
Your Features Are Important? It Doesn’t Mean They Are Good
Histogram of the variable. [Image by Author]

Once I loaded the dataset, these are the steps I carried out:

  1. Split the full dataset randomly: 33% of the rows in the training dataset, another 33% in the validation dataset, and the remaining 33% in the test dataset.
  2. Train a LightGBM Regressor on the training dataset.
  3. Make predictions on training, validation, and test datasets, using the model trained at the previous step.
  4. Compute SHAP values of training, validation, and test datasets, using the Python library “shap”.
  5. Compute the Prediction Contribution and the Error Contribution of each feature on each dataset (training, validation, and test), using the code we have seen in the previous paragraph.

Comparing Prediction Contribution and Error Contribution

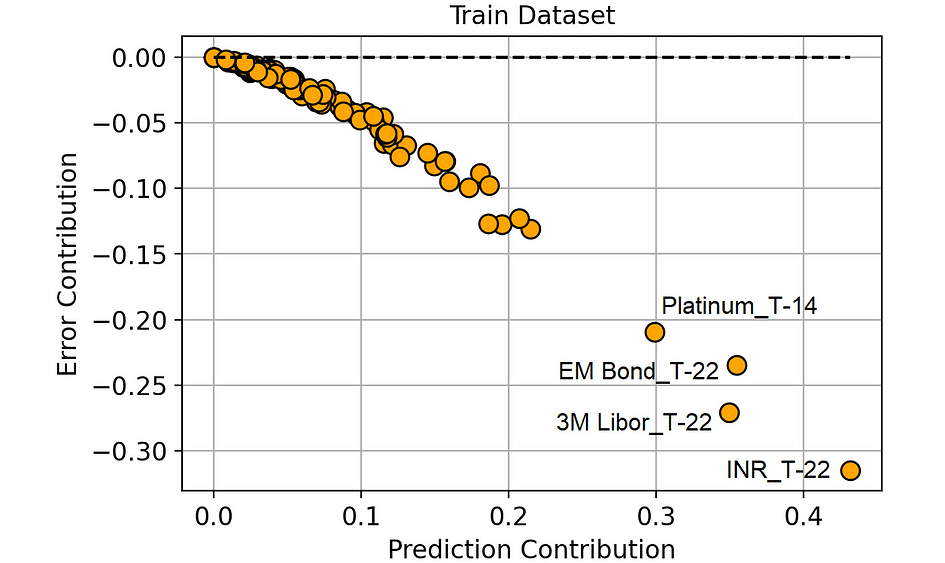
Let’s compare the Error Contribution and the Prediction Contribution in the training dataset. We will use a scatter plot, so the dots identify the 120 features of the model.
Your Features Are Important? It Doesn’t Mean They Are Good
Prediction Contribution vs. Error Contribution (on the Training dataset). [Image by Author]

There is a highly negative correlation between Prediction Contribution and Error Contribution in the training set.

And this makes sense: since the model learns on the training dataset, it tends to attribute high importance (i.e. high Prediction Contribution) to those features that lead to a great reduction in the prediction error (i.e. highly negative Error Contribution).

But this doesn’t add much to our knowledge, right?

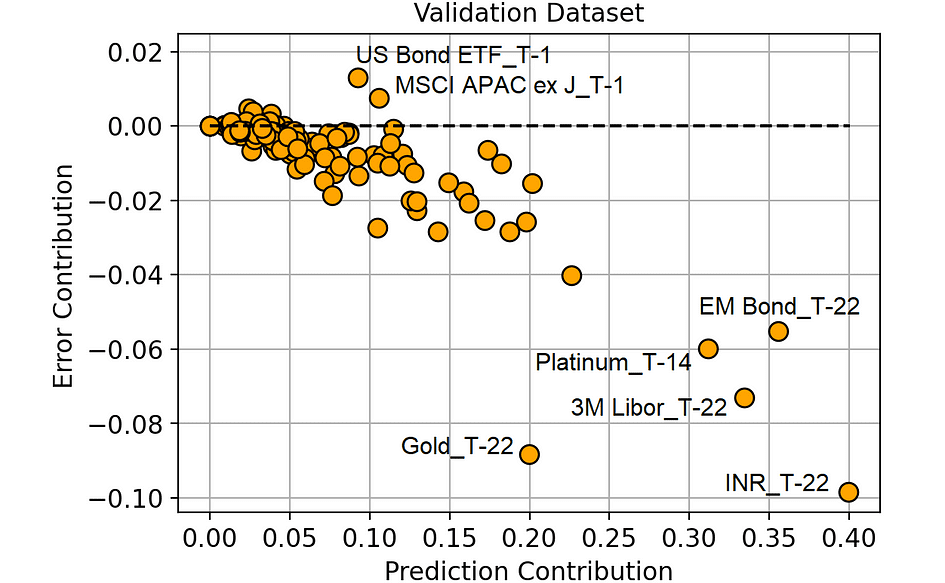
Indeed, what really matters to us is the validation dataset. The validation dataset is in fact the best proxy we can have about how our features will behave on new data. So, let’s make the same comparison on the validation set.
Your Features Are Important? It Doesn’t Mean They Are Good
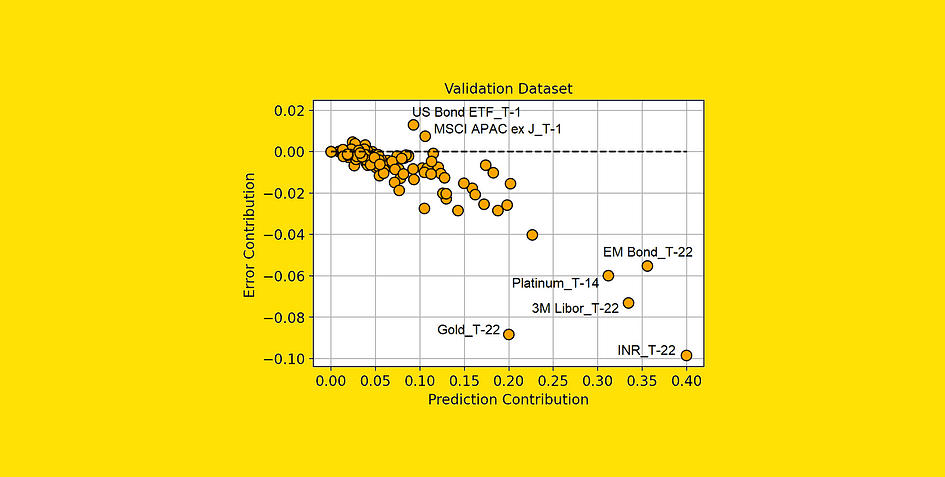
Prediction Contribution vs. Error Contribution (on the Validation dataset). [Image by Author]

From this plot, we can extract some much more interesting information.

The features in the lower right part of the plot are those to which our model is correctly assigning high importance since they actually bring a reduction in the prediction error.

Also, note that “Gold_T-22” (the return of gold 22 days before the observation period) is working really well compared to the importance that the model is attributing to it. This means that this feature is possibly underfitting. And this piece of information is particularly interesting since gold is the asset we are trying to predict (“Gold_T+22”).

On the other hand, the features that have an Error Contribution above 0 are making our predictions worse. For instance, “US Bond ETF_T-1” on average changes the model prediction by 0.092% (Prediction Contribution), but it leads the model to make a prediction on average 0.013% (Error Contribution) worse than it would have been without that feature.

We may suppose that all the features with a high Error Contribution (compared to their Prediction Contribution) are probably overfitting or, in general, they have different behavior in the training set and in the validation set.

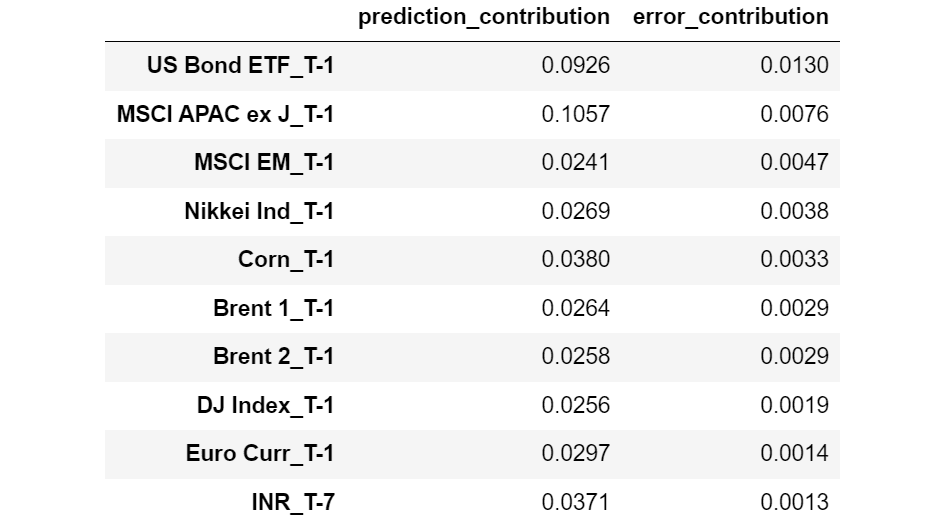
Let’s see which features have the largest Error Contribution.
Your Features Are Important? It Doesn’t Mean They Are Good
Features sorted by decreasing Error Contribution. [Image by Author]

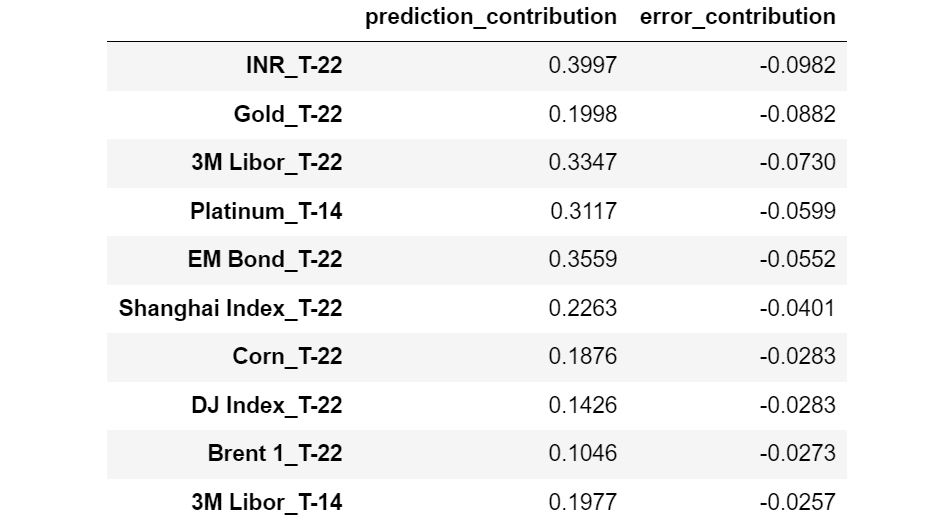
And now the features with the lowest Error Contribution:
Your Features Are Important? It Doesn’t Mean They Are Good
Features sorted by increasing Error Contribution. [Image by Author]

Interestingly, we may observe that all the features with higher Error Contribution are relative to T-1 (1 day before the observation moment), whereas almost all the features with smaller Error Contribution are relative to T-22 (22 days before the observation moment).

This seems to indicate that the most recent features are prone to overfitting, whereas the features more distant in time tend to generalize better.

Note that, without Error Contribution, we would never have known this insight.

RFE Using Error Contribution

Traditional Recursive Feature Elimination (RFE) methods are based on the removal of unimportant features. This is equivalent to removing the features with a small Prediction Contribution first.

However, based on what we said in the previous paragraph, it would make more sense to remove the features with the highest Error Contribution first.

To check whether our intuition is verified, let’s compare the two approaches:

  • Traditional RFE: removing useless features first (lowest Prediction Contribution).
  • Our RFE: removing harmful features first (highest Error Contribution).

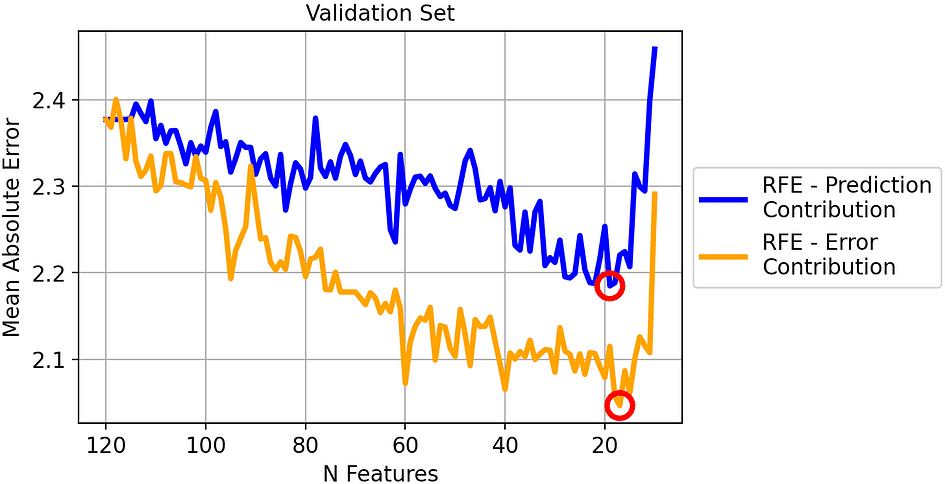
Let’s see the results on the validation set:
Your Features Are Important? It Doesn’t Mean They Are Good
Mean Absolute Error of the two strategies on the validation set. [Image by Author]

The best iteration for each method has been circled: it’s the model with 19 features for the traditional RFE (blue line) and the model with 17 features for our RFE (orange line).

In general, it seems that our method works well: removing the feature with the highest Error Contribution leads to a consistently smaller MAE compared to removing the feature with the highest Prediction Contribution.

However, you may think that this works well just because we are overfitting the validation set. After all, we are interested in the result that we will obtain on the test set.

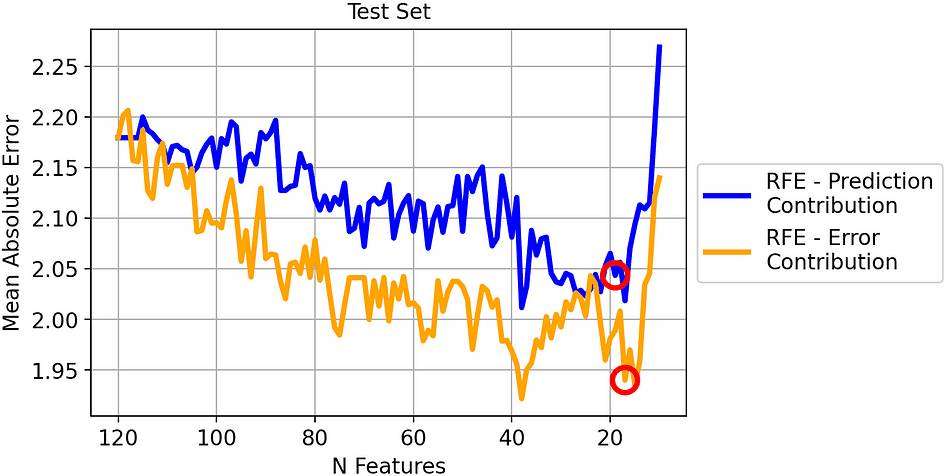
So let’s see the same comparison on the test set.
Your Features Are Important? It Doesn’t Mean They Are Good
Mean Absolute Error of the two strategies on the test set. [Image by Author]

The result is similar to the previous one. Even if there is less distance between the two lines, the MAE obtained by removing the highest Error Contributor is clearly better than the MAE by obtained removing the lowest Prediction Contributor.

Since we selected the models leading to the smallest MAE on the validation set, let’s see their outcome on the test set:

  • RFE-Prediction Contribution (19 features). MAE on test set: 2.04.
  • RFE-Error Contribution (17 features). MAE on test set: 1.94.

So the best MAE using our method is 5% better compared to traditional RFE!

Conclusions

The concept of feature importance plays a fundamental role in machine learning. However, the notion of “importance” is often mistaken for “goodness”.

In order to distinguish between these two aspects we have introduced two concepts: Prediction Contribution and Error Contribution. Both concepts are based on the SHAP values of the validation dataset, and in the article we have seen the Python code to compute them.

We have also tried them on a real financial dataset (in which the task is predicting the price of Gold) and proved that Recursive Feature Elimination based on Error Contribution leads to a 5% better Mean Absolute Error compared to traditional RFE based on Prediction Contribution.

All the code used for this article can be found in this notebook.

Thank you for reading!

Samuele Mazzanti is Lead Data Scientist at Jakala and currently lives in Rome. He graduated in Statistics and his main research interests concern machine learning applications for the industry. He is also a freelance content creator.

Original. Reposted with permission.

More On This Topic

  • What are Vector Databases and Why Are They Important for LLMs?
  • 5 ChatGPT Features to Boost your Daily Work
  • Deep learning doesn’t need to be a black box
  • Machine Learning is Not Like Your Brain Part Seven: What Neurons are Good…
  • Evaluating Object Detection Models Using Mean Average Precision
  • What Can AI-Powered RPA and IA Mean For Businesses?

Tech salaries are dropping. Here’s who’s getting hit the hardest

illustration of an arrow striking down a man

The last three years have been a whirlwind of change, from the response to a global pandemic, to increasing inflation, and onto the emergence of generative artifical intelligence (AI). These factors have impacted nearly every aspect of people's lives, and not surprisingly, their salaries too.

On Wednesday, Hired released its 2023 State of Tech Salaries Report, which uses the recruitment specialist's proprietary data and responses from a survey of more than 1,300 tech professionals to analyze the current state of the tech job market.

Also: Amazon is turning Alexa into a hands-free ChatGPT

The report reveals that both fully in-person and hybrid local U.S. roles experienced their most significant year-over-year decline during the past year, dropping 3% from $161,000 to $156,000.

"When adjusting for inflation, Hired's data reveals a staggering story — local US salaries have plummeted to their lowest point in the past five years, decreasing 9% from $141,000 to $129,000 from 2022 to mid-2023," said the report.

Hired found some patterns that could put your salary concerns at ease — or even increase them, if you are greener in your career. According to the company's data, the more experienced the talent, the less likely their salary is to decrease.

The rise of generative AI combined with market conditions caused leadership to make difficult decisions regarding their workforce, and as a result, junior talent — which is classed as professionals with less than four years of experience — experienced the most significant decrease in salary at nearly 5% year on year.

Moreover, the demand for junior staff also declined, with the number of roles posted on Hired dropping from 45% in 2019 to 25% in the first half of 2023.

These facts and figures don't sound too promising for the tech industry, but it's still a good sector to work in, with an average salary of $158,000.

Also: BCG partners with Anthropic to launch yet another AI consulting initiative

That rate is nearly double the average U.S. knowledge worker who has an average salary of $78,000, according to the U.S. Department of Labor.

Artificial Intelligence

YouTube Shorts to gain a generative AI feature called Dream Screen

YouTube Shorts to gain a generative AI feature called Dream Screen Sarah Perez @sarahintampa / 7 hours

YouTube today announced a new feature coming to its short-form video platform Shorts that will allow users to leverage AI tools to create videos. The feature, called Dream Screen, will allow users to create an AI-generated video or image background just by typing in what you want to see.

For example, explained YouTube CEO Neal Mohan at the company’s live event “Made on YouTube” this morning, you could type in something as crazy as “a panda drinking coffee,” and then the video image appears on the screen.

The company also suggested other examples, like underwater castles, or imagery that you could could have imagined in a dream, like dragons or sci-fi moonrises.

Image Credits: YouTube

Mohan said he believed the technology would allow more people to publish on YouTube, without feeling like they have to have a deep understanding of YouTube analytics or a full production studio.

The Shorts platform today is now averaging over 70 billion daily views, up from 50 billion in January. And YouTube expects AI will increase those numbers further.

“At YouTube, we want to make it easier for everyone to feel like they can create and we believe generative AI will make that possible,” said Mohan.

The feature is expected to roll out early next year.

IN-SPACe’s Standards Catalogue Aims to Elevate Indian Space Sector

This Indian Startup is Going to Space

In a significant move towards enhancing the competitiveness of the Indian space industry, the Indian Space Promotion and Authorisation Centre (IN-SPACe) has unveiled the “Catalogue of Indian Standards for Space Industry.” This release was announced by the Director of the Technical Directorate at IN-SPACe, Rajeev Jyoti during the inaugural session of the International Conference on Space 2023, organised by the Confederation of Indian Industry (CII).

The Indian Space Policy – 2023 entrusted IN-SPACe with the crucial task of establishing frameworks for developing space industry standards aligned with global benchmarks. This initiative aims to foster a culture of excellence within the Indian space industry and ensure its global competitiveness.

The catalogue comprises a compilation of 15 standards published by the Bureau of Indian Standards (BIS). These standards encompass a wide range of domains crucial to space endeavors, including Space System Program Management strategies, Systems Engineering principles, Product Assurance Mechanisms, and more. These standards cover all sectors of space activities, including satellites, launch systems, ground systems, and beyond.

Jyoti emphasised that the release of these standards represents a significant step forward for the Indian space industry. By aligning with internationally accepted best practices, these standards will enable Indian space companies to produce reliable space products, setting the stage for global competitiveness.

In the future, IN-SPACe, in collaboration with BIS, plans to expand the catalogue of Indian standards. Subsequent volumes will introduce additional Indian Standards for the space industry across various domains, including the management of space programs, security and safety, space transportation, design and test methodology, production, maintenance, operations, and more.

IN-SPACe, established in June 2020, operates as an autonomous nodal agency under the Department of Space, Government of India. Its mission is to promote, enable, authorise, and supervise non-government entities (NGEs) to engage in space activities. This includes manufacturing launch vehicles and satellites, providing space-based services, establishing ground stations, sharing space infrastructure and facilities, and creating new facilities under the Department of Space.

The release of the “Catalogue of Indian Standards for Space Industry” underscores India’s commitment to advancing its presence in the global space arena, which could potentially touch $100 billion by 2040. It positions Indian space industry stakeholders to achieve new heights in innovation, reliability, and competitiveness on the world stage.

The post IN-SPACe’s Standards Catalogue Aims to Elevate Indian Space Sector appeared first on Analytics India Magazine.

Pinterest Points Out the Good, Bad and Ugly of Personalisation Algos

There’s a lot of information on the Internet – good, bad, and some irrelevant. Sifting through all that clutter to get what you are looking for has become a burning necessity for Internet-based entities. The solution? Filtered content and personalised algorithms.

“Emerging research underscores the substantial value personalised advertisements yield, contributing billions of dollars to publisher earnings,” Aayush Mudgal, a senior ML expert at Pinterest told AIM.

The conversation hinted towards Google and Meta which are heavily reliant on its advertisement revenues for filling their pockets. In 2023 alone, Google made a whopping $162 billion from its ad business, 58% of its overall revenue. Even Meta’s ad revenues are estimated at $153.76 billion in 2023, a 13.1% increase from 2022.

At the image sharing platform, Mudgal is the tech lead for privacy aware conversion modelling and focuses on ads ranking. He holds expertise in large-scale recommendation systems, personalization, and ads marketplace.

He continued, “Personalization equips advertisers with the ability to display pertinent products and services, setting the stage for an engaging ad experience that augments customer satisfaction while safeguarding consumer privacy, which is a priority in our evolving digital age.”

How Pinterest Strikes the Sweet Balance

Same as other social media platforms, Pinterest brings in cash mainly by inviting businesses to advertise on its platform. But here, the platform lets the users choose whether they want to see personalised ads or not through their ‘Do not track’ feature.

Founded in 2010, Pinterest struggled at first to gain traction and followed by a struggle to deal with bias. But over the years, the engineers redesigned its systems and retrained its algorithms to better target diverse users and map their interests. As the platform evolved over the years, striking a sweet spot between making money and not exploring user data, its algorithms are often lauded for avoiding scandals around recommendation bias its rivals continue to face today.

In regards to the ongoing paradigm shift in the digital landscape, Mudgal advises that “moving away from individual third-party data has become ever more apparent. Notable developments within the industry show accelerated interest in privacy-enhancing methodologies, such as differential privacy, federated learning, and homomorphic encryption, as well as de-identified learning.” He noted that these methods safeguard the confidentiality of sensitive data majorly dealt with.

Even though these approaches found their way in finance and medicine, recently they have become important in advertising due to an increased emphasis on privacy.

Elaborating the need for these methods, Mudgal stated that these solutions strike a balance between tailoring personalization and preserving user privacy. “As the momentum for privacy within the advertising domain continues to escalate in strength, the utilisation of these methodologies will likely emerge as the standard in the ad industry,” he added.

The delicate act of balancing personalization and preventing filter bubbles in recommendation systems presents an intricate challenge. Nonetheless, it’s a crucial undertaking, ensuring users are exposed to a diverse, pertinent content spectrum, thus averting potential isolation within like-minded echo chambers, Mudgal pointed out.

Privacy Talks

In the series of privacy debates, the latest development has been made by Google with its project Privacy Sandbox. Through the project, Google aims to mine users’ browsing histories to support its own advertising profits by kicking out third party advertisers. In short, it means websites can fetch your online interests straight from your browser.

“As advertising evolves, privacy will always be top of mind for the entire tech industry,” believes Mudgal. The IIT Kanpur graduate noted that with the evolving privacy regulatory landscape, digital advertising must become less reliant on individual third party data, and be more privacy safe.

He further explains how advertisers can reach people on the platform who are more likely to take the business desired action. “This leverages ML models that help serve ads to the people we believe are the most likely to convert. Models emphasise on platform signals and extrapolation techniques, reducing reliance on offsite data,” he added.

The post Pinterest Points Out the Good, Bad and Ugly of Personalisation Algos appeared first on Analytics India Magazine.

Machine Learning Evaluation Metrics: Theory and Overview

Machine Learning Evaluation Metrics: Theory and Overview
Illustration by Author

Building a machine learning model that generalizes well on new data is very challenging. It needs to be evaluated to understand if the model is enough good or needs some modifications to improve the performance.

If the model doesn’t learn enough of the patterns from the training set, it will perform badly on both training and test sets. This is the so-called underfitting problem.

Learning too much about the patterns of training data, even the noise, will lead the model to perform very well on the training set, but it will work poorly on the test set. This situation is overfitting. The generalization of the model can be obtained if the performances measured both in training and test sets are similar.

In this article, we are going to see the most important evaluation metrics for classification and regression problems that will help to verify if the model is capturing well the patterns from the training sample and performing well on unknown data. Let’s get started!

Classification

When our target is categorical, we are dealing with a classification problem. The choice of the most appropriate metrics depends on different aspects, such as the characteristics of the dataset, whether it’s imbalanced or not, and the goals of the analysis.

Before showing the evaluation metrics, there is an important table that needs to be explained, called Confusion Matrix, that summarizes well the performance of a classification model.

Let’s say that we want to train a model to detect breast cancer from an ultrasound image. We have only two classes, malignant and benign.

  • True Positives: The number of terminally ill people that are predicted to have a malignant cancer
  • True Negatives: The number of healthy people that are predicted to have a benign cancer
  • False Positives: The number of healthy people that are predicted to have malignant cancer
  • False Negatives: The number of terminally ill people that predicted to have benign cancer

Machine Learning Evaluation Metrics: Theory and Overview
Example of Confusion Matrix. Illustration by Author.

Accuracy

Machine Learning Evaluation Metrics: Theory and Overview

Accuracy is one of the most known and popular metrics to evaluate a classification model. It is the fraction of the corrected predictions divided by the number of Samples.

The Accuracy is employed when we are aware that the dataset is balanced. So, each class of the output variable has the same number of observations.

Using Accuracy, we can answer the question “Is the model predicting correctly all the classes?”. For this reason, we have the correct predictions of both the positive class (malignant cancer) and the negative class (benign cancer).

Precision

Machine Learning Evaluation Metrics: Theory and Overview

Differently from Accuracy, Precision is an evaluation metric for classification used when the classes are imbalanced.

Precision answer to the following question: “What proportion of malignant cancer identifications was actually correct?”. It’s calculated as the ratio between True Positives and Positive Predictions.

We are interested in using Precision if we are worried about False Positives and we want to minimize it. It would be better to avoid running the lives of healthy people with fake news of a malignant cancer.

The lower the number of False Positives, the higher the Precision will be.

Recall

Machine Learning Evaluation Metrics: Theory and Overview

Together with Precision, Recall is another metric applied when the classes of the output variable have a different number of observations. Recall answers to the following question: “What proportion of patients with malignant cancer I was able to recognize?”.

We care about Recall if our attention is focused on the False Negatives. A false negative means that that patient has a malignant cancer, but we weren’t able to identify it. Then, both Recall and Precision should be monitored to obtain the desirable good performance on unknown data.

F1-Score

Machine Learning Evaluation Metrics: Theory and Overview

Monitoring both Precision and Recall can be messy and it would be preferable to have a measure that summarizes both these measures. This is possible with the F1-score, which is defined as the harmonic mean of precision and recall.

A high f1-score is justified by the fact that both Precision and Recall have high values. If recall or precision has low values, the f1-score will be penalized and, then, will have a low value too.

Regression Machine Learning Evaluation Metrics: Theory and Overview
Illustration by Author

When the output variable is numerical, we are dealing with a regression problem. As in the classification problem, it’s crucial to choose the metric for evaluating the regression model, depending on the purposes of the analysis.

The most popular example of a regression problem is the prediction of house prices. Are we interested in predicting accurately the house prices? Or do we just care about minimizing the overall error?

In all these metrics, the building block is the residual, which is the difference between predicted values and actual values.

MAE

Machine Learning Evaluation Metrics: Theory and Overview
The Mean Absolute Error calculates the average absolute residuals.

It doesn’t penalize high errors as much as other evaluation metrics. Every error is treated equally, even the errors of outliers, so this metric is robust to outliers. Moreover, the absolute value of the differences ignores the direction of error.

MSE

Machine Learning Evaluation Metrics: Theory and Overview

The Mean Squared Error calculates the average squared residuals.

Since the differences between predicted and actual values are squared, It gives more weight to higher errors,

so it can be useful when big errors are not desirable, rather than minimizing the overall error.

RMSE

Machine Learning Evaluation Metrics: Theory and Overview

The Root Mean Squared Error calculates the square root of the average squared residuals.

When you understand MSE, you keep a second to grasp the Root Mean Squared Error, which is just the square root of MSE.

The good point of RMSE is that it is easier to interpret since the metric is in the scale of the target variable. Except for the shape, it’s very similar to MSE: it always gives more weight to higher differences.

MAPE

Machine Learning Evaluation Metrics: Theory and Overview

Mean Absolute Percentage Error calculates the average absolute percentage difference between predicted values and actual values.

Like MAE, it disregards the direction of the error and the best possible value is ideally 0.

For example, if we obtain a MAPE with a value of 0.3 for predicting house prices, it means that, on average, the predictions are below of 30%.

Final Thoughts

I hope that you have enjoyed this overview of the evaluation metrics. I just covered the most important measures for evaluating the performance of classification and regression models. If you have discovered other life-saving metrics, that helped you on solving a problem, but they are not nominated here, drop them in the comments.
Eugenia Anello is currently a research fellow at the Department of Information Engineering of the University of Padova, Italy. Her research project is focused on Continual Learning combined with Anomaly Detection.

More On This Topic

  • More Performance Evaluation Metrics for Classification Problems You Should…
  • Understanding Supervised Learning: Theory and Overview
  • Statistics in Data Science: Theory and Overview
  • How to calculate confidence intervals for performance metrics in Machine…
  • What is Graph Theory, and Why Should You Care?
  • Data Visualization: Theory and Techniques

OpenAI Unveils Third Iteration of DALL·E

OpenAI, a frontrunner in artificial intelligence research and application, has recently unveiled the third version of its generative AI model, DALL·E. This innovative technology stands as a testament to the ongoing advancements in the AI sector, offering unprecedented capabilities in generating images from textual descriptions. The recent upgrade underscores OpenAI’s commitment to enhancing the interaction between language and imagery, paving the way for a myriad of applications across various domains.

Enhanced Symbiosis Between Text and Imagery

DALL·E’s third iteration presents significant enhancements in harmonizing text and image generation. It takes textual prompts and transmutes them into intricate and detailed images with heightened accuracy and coherence, reflecting a profound understanding of the context provided. This advancement makes it an invaluable tool in areas like content creation, design, and education, where visual representation plays a crucial role in conveying ideas and concepts effectively.

The upgraded model is trained meticulously to grasp nuanced textual cues and translate them into visually compelling images that adhere to the prompt’s essence. This intricate synergy between language and image interpretation by the AI is pivotal for generating coherent and contextually relevant visuals, a feature that holds immense promise for a multitude of industries, including gaming, entertainment, and digital art.

Transformative Applications Across Various Domains

The extensive potential applications of DALL·E’s third version span diverse fields. In the educational sector, it can act as an instrumental tool in facilitating learning and comprehension by providing visual aids generated in real-time, aiding educators in illustrating complex concepts dynamically and interactively.

Similarly, the realms of design and digital art will witness a revolutionary transformation as artists and designers can leverage DALL·E to materialize their visions and ideas instantly. This swift ideation process will enable creators to experiment with different concepts effortlessly and refine their creations with unprecedented ease and flexibility.

Moreover, the gaming and entertainment industries stand to gain significantly from this technological marvel. Game developers can utilize DALL·E to create intricate and diverse game environments, characters, and assets swiftly, expediting the development cycle and allowing for enhanced creative exploration.

In the domain of content creation and marketing, the upgraded DALL·E offers brands and content creators the ability to generate tailored visual content instantaneously, aligning with their narrative or branding needs. This ability to create bespoke imagery on-demand is set to redefine content strategies and promotional campaigns, enabling more dynamic and visually enriched communication.

OpenAI's Commitment to Advancing AI

The launch of the third version of DALL·E epitomizes OpenAI’s relentless pursuit of excellence in the field of artificial intelligence. By continually refining and enhancing its models, OpenAI is shaping the future of how we interact with and leverage AI, fostering an environment where technological innovation and human creativity coalesce to solve complex problems and create new possibilities.

The constant evolution of DALL·E underscores the infinite potential housed within generative AI models. It invites us to envision a future where the boundaries between textual descriptions and visual representations are seamless, and where our ideas, thoughts, and visions can be visualized and shared with the world effortlessly.

The unveiling of the third version of DALL·E by OpenAI is not just a technological advancement; it’s a leap towards a future where the symbiosis of text and image can redefine creative expressions and applications. The enhanced capabilities of this generative AI model are poised to bring forth transformative changes across various domains, offering a glimpse into a future filled with untapped potential and uncharted possibilities in the realm of artificial intelligence. The convergence of imagination and technology is on the horizon, promising a world where our creative visions are only a prompt away.

Oracle Announces AI/ML Features To Its MySQL HeatWave: A Pioneering Shift in Database Innovation with AI and ML Superpowers

In a landmark announcement today, Oracle Corp. introduced a series of significant enhancements to its MySQL HeatWave database platform. These enhancements offer a robust array of features that span AL/ML, data optimization, and query acceleration for data management and analysis.

One of the highlights is the introduction of the Vector Store for more precise insights, utilising their proprietary data of LLMs. The store accepts documents in various formats, storing them as embeddings generated through an encoder model. These embeddings facilitate accurate searches, improving the contextual relevance of responses when interacting with MySQL HeatWave.

Coupled with the Vector Store, the platform now boasts generative AI capabilities, for users to interact with MySQL HeatWave in natural language. This advancement enhances document searches within the HeatWave Lakehouse.

“Vector stores and generative AI bring the power of LLMs to customers, providing them with an intuitive way to interact with data in their enterprise and get the accurate answers that they need for their business,” said Edward Screven, chief corporate architect, Oracle.

Oracle has reinforced HeatWave’s ML capabilities with a fully automated pipeline for model training. A key advantage is the ability to conduct ML tasks without the need to migrate data to external services. Customers can securely apply ML training, inference, and explanation directly within HeatWave.

MySQL Autopilot has undergone significant improvements, too. It now includes features such as Autopilot indexing, which automates index creation for optimal OLTP workload performance. Auto compression assists in selecting the best compression algorithm for each column, improving load and query performance while reducing costs.

This release introduces JavaScript support, enabling developers to create stored procedures and functions in JavaScript. Notably, data remains within the database, eliminating the need for data transfers to the client, and code execution benefits from Just-In-Time (JIT) compilation in the GraalVM runtime.

Developers and database administrators can use HeatWave for real-time analytics on JSON documents stored within the MySQL database, achieving significant query acceleration. Furthermore, the platform now supports new analytic operators, including CUBE, Hyper Log Log, Qualify, and Table sample, facilitating migration of diverse workloads to HeatWave.

The post Oracle Announces AI/ML Features To Its MySQL HeatWave: A Pioneering Shift in Database Innovation with AI and ML Superpowers appeared first on Analytics India Magazine.

Authors, Including George RR Martin, Sue OpenAI For Mass Theft

Adding to the already existing heap of lawsuits against OpenAI, a group of authors including George RR Martin best known for his magnum opus ‘A Song of Ice and Fire’ series have sued ChatGPT’s developer OpenAI over data infringement.

In papers filed in the New York federal court, the 17 authors alleged “flagrant and harmful infringements of plaintiffs’ registered copyrights” and called ChatGPT a “massive commercial enterprise” that is reliant upon “systematic theft on a mass scale”

This lawsuit presents a compelling case, citing specific instances of ChatGPT searches related to each author. For instance, in the case of GRRM, the program is alleged to have generated “an infringing, detailed outline for a prequel” to ‘Game of Thrones,’ titled ‘A Dawn of Direwolves.’ Shockingly, it purportedly used “identical characters from Martin’s pre-existing series.”

Just last month, OpenAI requested a California federal judge to dismiss two analogous lawsuits, one involving the author/comedian Sarah Silverman and the other from the author Paul Tremblay. In their legal defence, OpenAI said that these claims “misconceive the scope of copyright, failing to take into account the limitations and exceptions (including fair use) that properly leave room for innovations like the large language models now at the forefront of artificial intelligence”.

Even though Silicon Valley has been feeding on artist’s data, fingers have been particularly raised at the celebrity — OpenAI — for its closed-door activities. While policy makers have been demanding change, no solution appears in far-sight. OpenAI is not the only one being slapped left, right and centre with legal cases.

In response, Stable Diffusion and Midjourney jointly sought the dismissal of a class-action lawsuit initiated by artists. Their argument rested on the premise that the AI-generated images differed significantly from the artists’ work and that the lawsuit failed to pinpoint specific instances of misuse.

Read more: Big Tech Don’t Care About The Lawsuits

The post Authors, Including George RR Martin, Sue OpenAI For Mass Theft appeared first on Analytics India Magazine.

OpenAI Banks on Red Team to Win the Moral Battle

If a compound for a chemical weapon can be created using ChatGPT, or, if the chatbot is able to spew out misinformation along with extreme biases that can possibly target various interest groups, the moral grounds of an LLM model is pretty much compromised. With big tech companies fighting to bring down these anomalies, the need to form a dedicated team that can bring in safety, security and morality, is probably more crucial than ever, and OpenAI is on it.

To fix this morality part of its LLM, OpenAI is inviting people to enhance their AI safety features and democratise AI use. As a responsible AI company, OpenAI recently announced plans to build a Red Teaming Network.

The company is inviting domain experts from various fields to help improve safety for OpenAI’s models. Interestingly, the announcement comes in less than a week of the AI Senate meeting that convened all the tech titans of the industry, including OpenAI CEO Sam Altman, to discuss AI regulations.

The ‘Red Teaming Network’ will be selected based on specific skills who can assist at different points in the model and product development process. The program is flexible where members will not be engaged in all projects and the time commitments for each of them can vary, going as low as 5-10 hours in a year.

Domain experts required for Red Teaming Network. Source : OpenAI

Big Tech Fancies Red Teaming

Sam Altman had often spoken about how they took six months for testing the safety of the GPT-4 model before releasing it to the public. Those six months involved red teamers of domain experts to test the product. Paul Röttger, postdoctoral researcher at MilaNLP, who was part of the red team for testing the GPT-4 model for six months, mentioned that model safety is a difficult and challenging task.

I was part of OpenAI’s red team for GPT-4, testing its ability to generate harmful content.
Working with the model in various iterations over the course of six months convinced me that model safety is the most difficult, and most exciting challenge in NLP right now.
🧵 https://t.co/pFaovXnob4

— Paul Röttger (@paul_rottger) March 14, 2023

Red teamers were also involved in OpenAI’s latest image-generation model DALL.E 3 that was launched yesterday. The domain experts were consulted to improve the safety feature and mitigate biases and misinformation that can be generated from the model – the company confirmed on their blog.

Red remaining is no new concept for other big tech companies too. Interestingly, in July, Microsoft released an article on red teaming for large language models, listing out all nuances of the process and why it is an essential practice for ‘responsible development of systems’ using LLMs. The company also confirmed on using red teaming exercises that included content filters and other mitigation strategies for its Azure OpenAI Service models.

Google is also not far behind. The company also released a report in July emphasising the importance of red teaming in every organisation. Google believes that red teaming is essential for preparing against attacks on AI systems, and has built an AI Red Team comprising ethical hackers, who can simulate various potential adversaries.

AI Attacks that Google’s Red Team tests. Source: GoogleBlog

Lure With Money

While there is no clarification on remuneration of the previous red team members at OpenAI, the latest red teaming network that OpenAI is trying to build will pay a compensation for the participants. However, the project will entail contributors to sign a Non-Disclosure Agreement (NDA) or maintain confidentiality for an ‘indefinite period’.

This is not the first time that OpenAI is splurging big on sourcing experts to improve their AI models on security and safety. A few months ago, the company announced a program to democratise AI rules where it will fund experiments on deciding AI system rules. A total of 1 million grant was offered.

Furthermore, OpenAI also launched its new cybersecurity grant program of $1 million that aimed to help and enable the creation and advancement of AI-powered cybersecurity tools and technologies. Interestingly, these announcements also came shortly after the first AI Senate meeting that Altman attended, where he emphasised on the need to regulate AI.

Going by how OpenAI has already been using red teams to make their models safe, the latest effort broadens its horizon to include a diverse group of people to help with the model. It could probably be in an attempt to get various perspectives on fixing their models, and at the same time, continue to brand itself as a company that works for the people. However, the opportunity seems to be exciting too.

Nothing New Here

Last year, Andrew White, chemical engineering professor at the University of Rochester, was part of a team of 50 academics and experts that were hired to test OpenAI’s GPT-4 much before the model was publicly released in March. The ‘red team’ tested the model for over six months with the goal of finding vulnerabilities to break the model. What Andrew learned was that with GPT-4, he was able to suggest a compound as a chemical weapon, emphasising on the risks that the model poses – an unsolved problem that still persists.

While this was months ago, OpenAI’s latest red team efforts take safety checks to a higher magnitude, calling it a more formal effort to collaborate with outside experts, research institutions, and civil society organisations.

The post OpenAI Banks on Red Team to Win the Moral Battle appeared first on Analytics India Magazine.