
Image by Author
ChatGPT, its successor GPT-4, and their open-source alternatives have been extremely successful. Developers and data scientists are all looking to be more productive and use ChatGPT to simplify their day-to-day tasks.
Here, we’ll see how to use ChatGPT for data science through a pair programming session with ChatGPT. We’ll build a text classification model, visualize the dataset, identify the best hyper parameters for the model, try out different machine learning algorithms, and more—all using ChatGPT.
Along the way, we’ll also look at certain tips to structure prompts so as to get helpful results. To follow along, you need to have a free OpenAI account. If you're a GPT-4 user, you can follow along with the same prompts, too.
Build a Working Model Faster
Let us try to build a news classification model using ChatGPT for the 20 newsgroups dataset in scikit-learn.
Here’s the prompt I used: “I’d like to build a news classification model using sklearn 20 newsgroups dataset. Do you know about this?”
Though my prompt is not very specific at this point, I’ve stated both the objective and the dataset:
- Objective: To build a new classification model
- Dataset to use: 20 newsgroups dataset from scikit-learn
The response from ChatGPT tells us to start by loading the dataset.
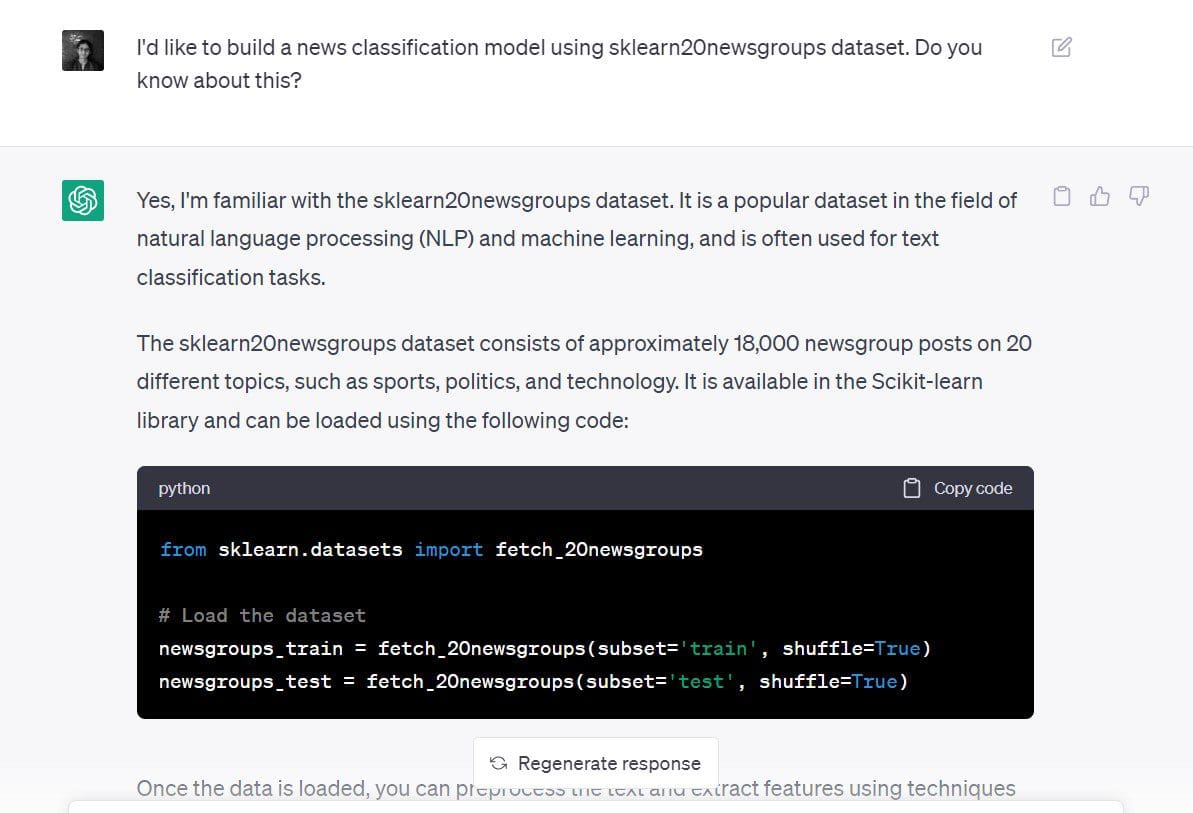
# Load the dataset newsgroups_train = fetch_20newsgroups(subset='train', shuffle=True) newsgroups_test = fetch_20newsgroups(subset='test', shuffle=True)As we’ve also stated the objective (to build a text classification model), ChatGPT tells us how we can go about doing this.
We see that it gives us the following steps:
- Using
TfidfVectorizerfor text preprocessing and coming up with a numerical representation. This approach of using the TF-IDF scores is better than using the count occurrences using aCountVectorizer. - Creating a classification model on the numeric representation of the dataset using a Naive Bayes or Support Vector Machine (SVM) classifier.
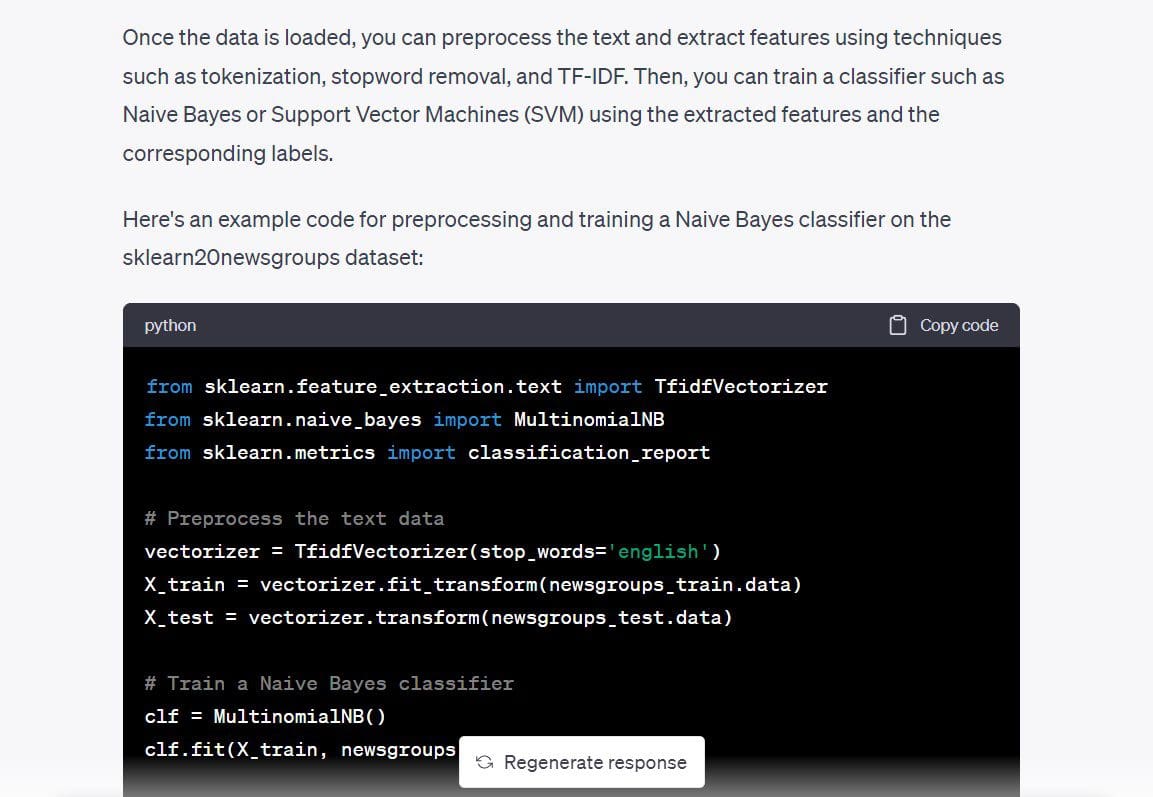
It also gave the code for a Multinomial Naive Bayes classifier, so let’s use it and check if we can have a working model already.
from sklearn.feature_extraction.text import TfidfVectorizer from sklearn.naive_bayes import MultinomialNB from sklearn.metrics import classification_report # Preprocess the text data vectorizer = TfidfVectorizer(stop_words='english') X_train = vectorizer.fit_transform(newsgroups_train.data) X_test = vectorizer.transform(newsgroups_test.data) # Train a Naive Bayes classifier clf = MultinomialNB() clf.fit(X_train, newsgroups_train.target) # Evaluate the performance of the classifier y_pred = clf.predict(X_test) print(classification_report(newsgroups_test.target, y_pred))I went ahead and ran the above code. And it works as expected—without errors. We went from a blank screen to a text classification model—in a few minutes—with a single prompt.
Output >> precision recall f1-score support 0 0.80 0.69 0.74 319 1 0.78 0.72 0.75 389 2 0.79 0.72 0.75 394 3 0.68 0.81 0.74 392 4 0.86 0.81 0.84 385 5 0.87 0.78 0.82 395 6 0.87 0.80 0.83 390 7 0.88 0.91 0.90 396 8 0.93 0.96 0.95 398 9 0.91 0.92 0.92 397 10 0.88 0.98 0.93 399 11 0.75 0.96 0.84 396 12 0.84 0.65 0.74 393 13 0.92 0.79 0.85 396 14 0.82 0.94 0.88 394 15 0.62 0.96 0.76 398 16 0.66 0.95 0.78 364 17 0.95 0.94 0.94 376 18 0.94 0.52 0.67 310 19 0.95 0.24 0.38 251 accuracy 0.82 7532 macro avg 0.84 0.80 0.80 7532 weighted avg 0.83 0.82 0.81 7532Though we got a working model to solve the problem at hand, here are certain tips that can help you when prompting. The prompt could have been better and broken down into smaller steps, like so:
- Please tell me more about the scikit-learn 20 newsgroups dataset.
- What are the possible tasks that I can perform with this dataset? Can I build a text classification model?
- Can you tell me which machine learning algorithm will be best suited for this application?
Visualize the Dataset
Okay, we’ve already built a text classification model. But it happened really fast, so let's slow down and try to come up with the simple visualization of the dataset.
In particular, let’s try to understand the distribution of the training samples across the 20 news categories and identify if there is any class imbalance.
Here is the prompt that I used: “I’d like to visualize the dataset to understand the class distribution and identify class imbalance. Can you help me with the visualization?”
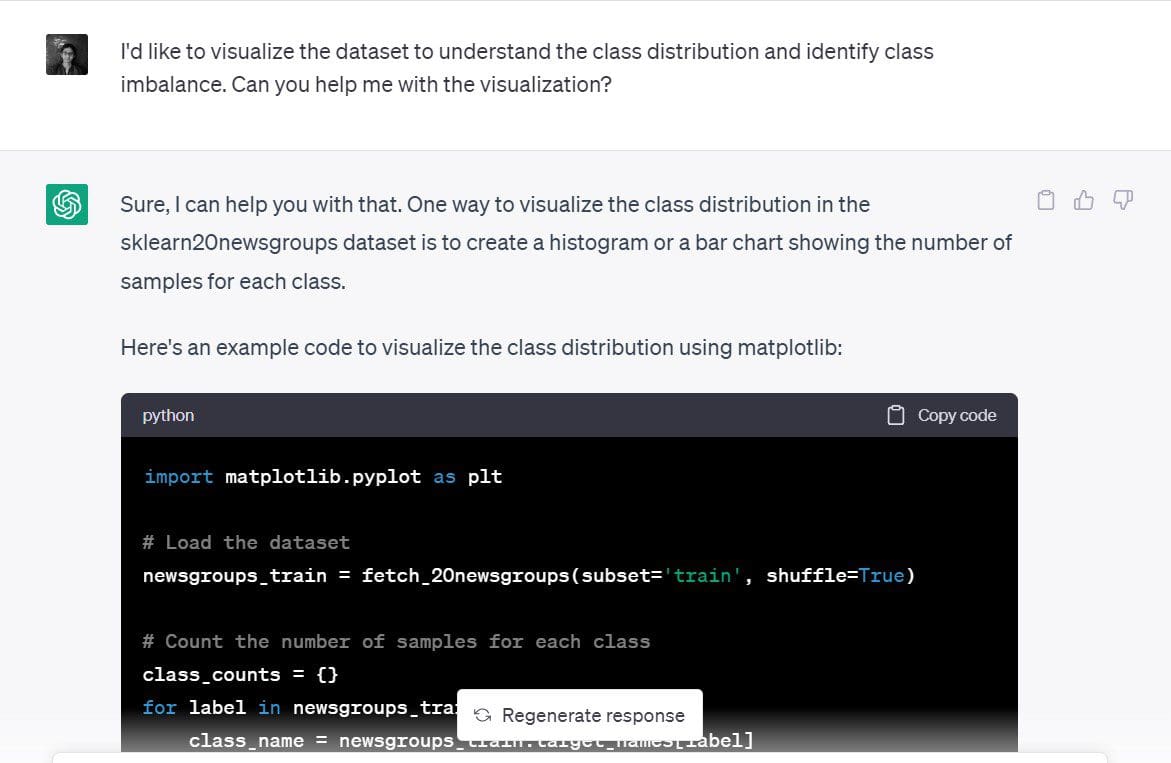
ChatGPT suggested that a bar chart or histogram of the number of samples in each of the classes would be a good visualization. That sounds reasonable.
Here is the code that ChatGPT generated to create a simple bar chart in matplotlib:
import matplotlib.pyplot as plt # Load the dataset newsgroups_train = fetch_20newsgroups(subset='train', shuffle=True) # Count the number of samples for each class class_counts = {} for label in newsgroups_train.target: class_name = newsgroups_train.target_names[label] if class_name in class_counts: class_counts[class_name] += 1 else: class_counts[class_name] = 1 # Plot the class distribution plt.bar(class_counts.keys(), class_counts.values()) plt.xticks(rotation=90) plt.xlabel('Class') plt.ylabel('Number of Samples') plt.title('Class Distribution') plt.show()Here is the plot. It's neat, the labels are readable. We can also see the number of samples in each of the 20 classes.
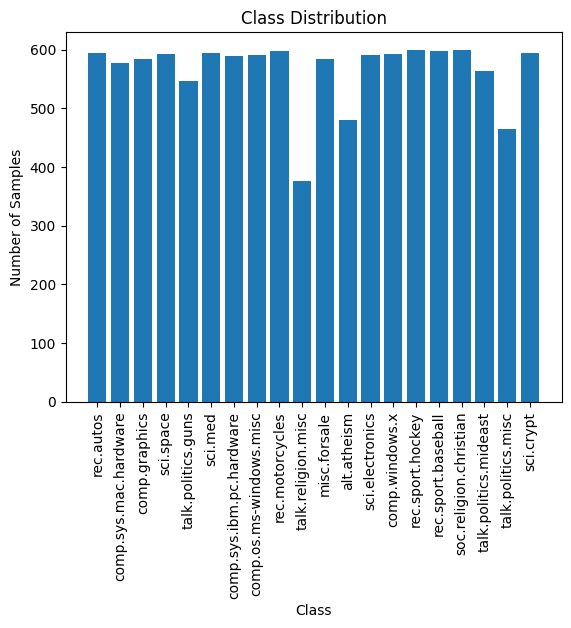
The distribution of training samples across the 20 classes is approximately even, and there is no visible class imbalance. Therefore, the model that we obtained in the previous step is useful. And we don't need to use any novel resampling techniques to address class imbalance.
Hyperparameter Tuning
Next, I would like to tune the hyperparameters of the model. First, I would like to understand the different hyperparameters that can be tuned. Then, we can do a simple grid search if there are not too many hyperparameters.
Here’s the prompt: “Are there any hyperparameters I can tune to make the classifier model better?”
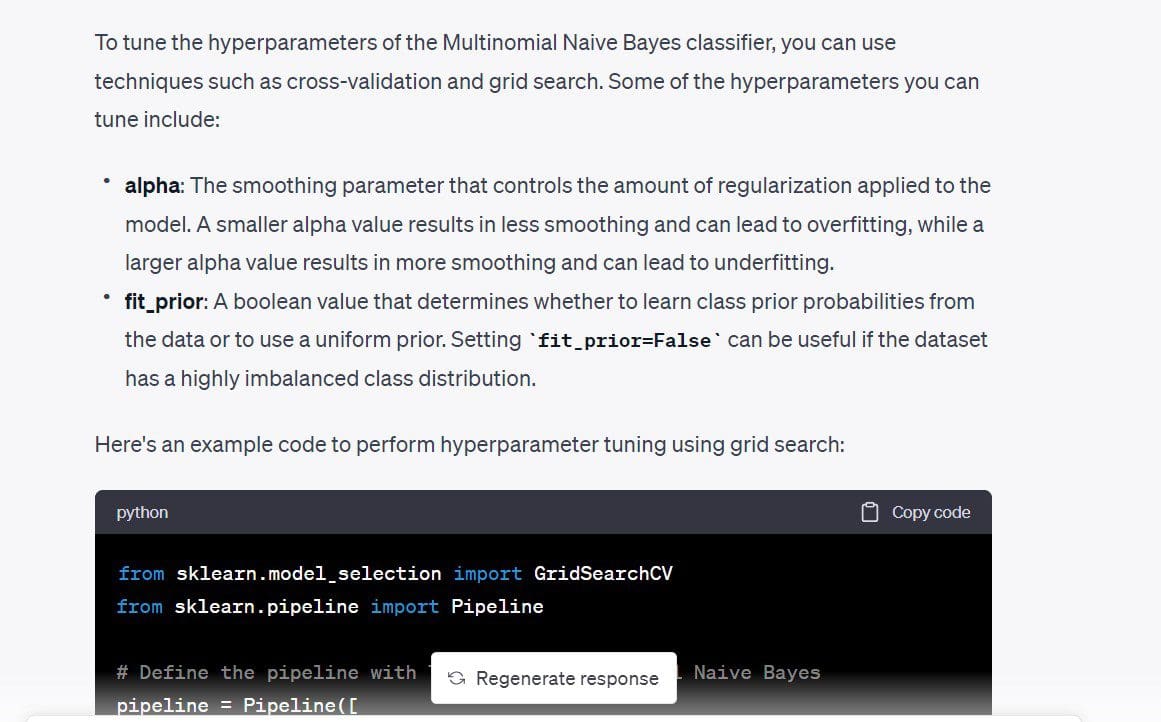
In the code that we got, max_df for the TfidfVectorizer is also tunable. We know that TF-IDF score works by assigning higher weight to terms that occur frequently in a particular document while assigning substantially lower weight to terms that occur frequently in all the documents. The max_df uses the percentage of occurrence to ignore a particular term.
For example, max_df of 0.5 indicates that all terms that occur in at least 50% of the documents will be ignored. If you’d like, you can remove this. But I am going to retain it just to see what max_df I can use.
The code uses a simple grid search and picks the optimal values based on cross-validation scores.
from sklearn.model_selection import GridSearchCV from sklearn.pipeline import Pipeline # Define the pipeline with TF-IDF and Multinomial Naive Bayes pipeline = Pipeline([ ('tfidf', TfidfVectorizer(stop_words='english')), ('clf', MultinomialNB()) ]) # Define the hyperparameter grid param_grid = { 'tfidf__max_df': [0.5, 0.75, 1.0], 'clf__alpha': [0.1, 0.5, 1.0], 'clf__fit_prior': [True, False], } # Perform grid search with cross-validation grid_search = GridSearchCV(pipeline, param_grid, cv=5) grid_search.fit(newsgroups_train.data, newsgroups_train.target) # Print the best hyperparameters and cross-validation score print("Best hyperparameters: ", grid_search.best_params_) print("Cross-validation score: ", grid_search.best_score_)Output >> Best hyperparameters: {'clf__alpha': 0.1, 'clf__fit_prior': False, 'tfidf__max_df': 0.5} Cross-validation score: 0.9088736147919108Plugging in the values of these hyperparameters, I got about 2% improvement in the classification accuracy.
Here, we didn’t have a lot of hyperparameters to tune. If you have a lot of hyperparameters where each can take on a set of values, running grid search might be expensive. And it might make sense to run a randomized search instead.
Faster Iteration Over Different Models
We saw in one of the first steps that an SVM works fine for such a classification problem, too.
I’d now like to build a support vector classifier for the same dataset.
The prompt I used: “Can you let me know if I can use an SVM to solve the same problem? Can you generate the code to do that?”
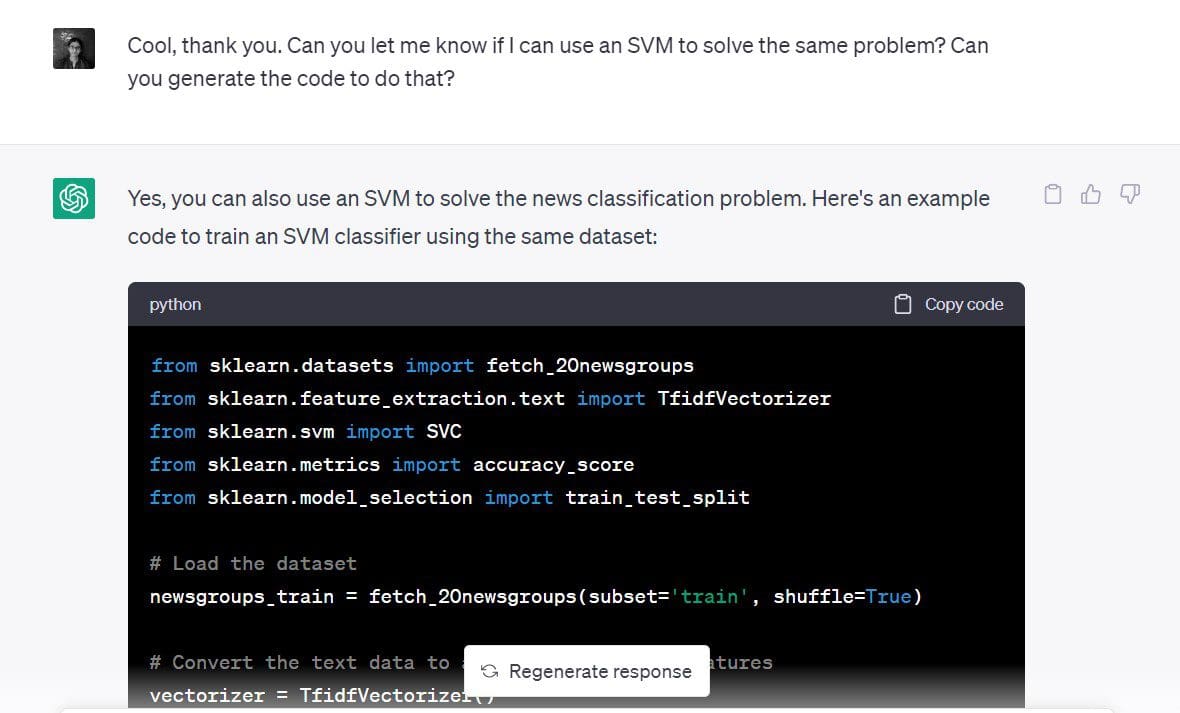
And here we go:
from sklearn.datasets import fetch_20newsgroups from sklearn.feature_extraction.text import TfidfVectorizer from sklearn.svm import SVC from sklearn.metrics import accuracy_score from sklearn.model_selection import train_test_split # Load the dataset newsgroups_train = fetch_20newsgroups(subset='train', shuffle=True) # Convert the text data to a matrix of TF-IDF features vectorizer = TfidfVectorizer() X = vectorizer.fit_transform(newsgroups_train.data) y = newsgroups_train.target # Split the data into training and testing sets X_train, X_test, y_train, y_test = train_test_split(X, y, test_size=0.2, random_state=42) # Define the SVM classifier clf = SVC(kernel='linear') # Train the SVM classifier clf.fit(X_train, y_train) # Predict the class labels for the test set y_pred = clf.predict(X_test) # Calculate the accuracy of the SVM classifier accuracy = accuracy_score(y_test, y_pred) print('Accuracy:', accuracy)Given that we have an accuracy score of over 90%, SVM seems to be a good choice for this dataset.
Output >> Accuracy: 0.9019001325673884As seen, you can use ChatGPT to quickly try out different models to solve the same problem.
Exploring Dimensionality Reduction
Once you’ve doubled down on building a working model, you can as well explore other available directions. Let’s look at dimensionality reduction as an example.
At this point, I’m not interested in running dimensionality reduction algorithms because I already have a working model. And the feature space is not very high dimensional. So we don’t need to reduce the number of dimensions ahead of model building.
However, let’s look at the approaches to dimensionality reduction for this specific dataset.
The prompt I used: “Can you tell me the dimensionality reduction techniques that I can use for this dataset?”
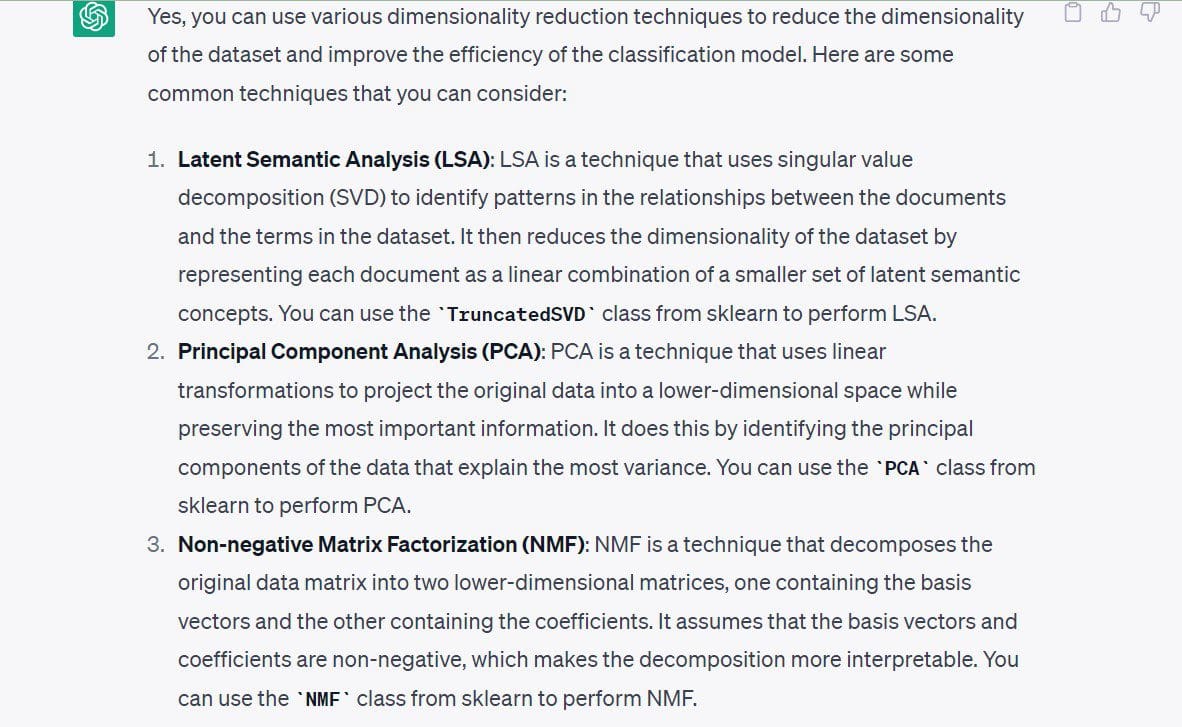
The following techniques have been suggested by ChatGPT:
- Latent Semantic Analysis or SVD
- Principal Component Analysis (PCA)
- Non-negative Matrix Factorization (NMF)
Let's end our discussion by enumerating the best practices to use ChatGPT.
Best Practices to Use ChatGPT for Data Science
The following are some of the best practices to keep in mind when using ChatGPT for data science:
- Don't input sensitive data and source code: Do not feed in any sensitive data into ChatGPT. When you’re working on data teams in organizations, you’ll often build models on customer data—which should be kept confidential. You can instead try to build prototypes for similar publicly available datasets and try to transpose it onto your dataset or problem. Similarly, refrain from inputting sensitive source code or any info that should not be disclosed.
- Be specific with your prompts: Without specific prompts, it is quite difficult to get helpful answers from ChatGPT. Therefore, structure your prompt such that they’re specific enough. Prompts should at the least, convey the objective clearly. one step at a time.
- Decompose longer prompts into smaller prompts: If you have a chain of thought on accomplishing a particular task, try to break it down into simpler steps and prompt ChatGPT to do each of the steps.
- Debug effectively using ChatGPT: In this example, all the code that we got ran without errors; but this may not always be the case. You may run into errors because of deprecated features, invalid API references, and more. When you run into errors, you can feed in the error message and relevant traceback in your prompt. And look at the offered solutions, then proceed to debug your code.
- Track prompts: If you use (or plan on using) ChatGPT a lot in your everyday data science workflow, it might be a good idea to keep track of the prompts. This can help refine prompts over time and identify prompt engineering techniques to get better results from ChatGPT.
Conclusion
When using ChatGPT for data science applications, understanding the business problem is the first and the most important step. Therefore, ChatGPT is only a tool to simplify and automate certain tasks and is not a replacement for the technical expertise of developers.
However, it’s still an invaluable tool to increase productivity by helping quickly build and test out different models and algorithms. So let’s leverage ChatGPT to hone our skills and become better developers!
Bala Priya C is a developer and technical writer from India. She likes working at the intersection of math, programming, data science, and content creation. Her areas of interest and expertise include DevOps, data science, and natural language processing. She enjoys reading, writing, coding, and coffee! Currently, she's working on learning and sharing her knowledge with the developer community by authoring tutorials, how-to guides, opinion pieces, and more.
- Software Engineering Tips and Best Practices for Data Science
- Automation in Data Science Workflows
- 7 Tips for Data Science Project Management
- Quick Data Science Tips and Tricks to Learn SAS
- 7 Tips To Produce Readable Data Science Code
- Six Tips on Building a Data Science Team at a Small Company