
Image by rawpixel.com on Freepik
The machine learning model is only helpful if used in production to solve business problems. However, the business problem and the machine learning model are constantly evolving. That is why we need to maintain the machine learning so the performance keeps up with the business KPI. This is where the MLOps concept came from.
MLOps, or machine learning operations, is a collection of techniques and tools for machine learning in production. From the machine learning automation, versioning, delivery, and monitoring is something that MLOps handle. This article will focus on monitoring and how we use Python packages to set up monitoring model performance in production. Let’s get into it.
Monitor Model Performance
When we talk about monitoring in the MLOps, it could refer to many things, as one of the MLOps principles is monitoring. For example:
– Monitor the data distribution change over time
– Monitor the features used in the development vs. production
– Monitor model decay
– Monitor model performance
– Monitor the system staleness
There are still a lot of elements to monitor in the MLOps, but in this article, we will focus on monitoring model performance. Model performance, in our case, refers to the capability of the model to make reliable predictions from unseen data, measured with specific metrics such as accuracy, precision, recall, etc.
Why do we need to monitor the model performance? It’s to maintain the model prediction reliability to solve the business problem. Before production, we often calculate the model performance and its effect on the KPI; for example, the baseline is 70% Accuracy if we want our model still follow the business needs, but below that is unacceptable. That is why monitoring the performance would allow the model always to meet the business requirements.
Using Python, we would learn how model monitoring is done. Let’s start by installing the package. There are many choices for model monitoring, but for this example, we would use the open-source package for monitoring called evidently.
Setup the Model Monitoring with Python
First, we need to install the evidently package with the following code.
pip install evidentlyAfter installing the package, we would download the data example, the insurance claim data from Kaggle. Also, we would clean the data before we use them further.
import pandas as pd df = pd.read_csv("insurance_claims.csv") # Sort the data based on the Incident Data df = df.sort_values(by="incident_date").reset_index(drop=True) # Variable Selection df = df[ [ "incident_date", "months_as_customer", "age", "policy_deductable", "policy_annual_premium", "umbrella_limit", "insured_sex", "insured_relationship", "capital-gains", "capital-loss", "incident_type", "collision_type", "total_claim_amount", "injury_claim", "property_claim", "vehicle_claim", "incident_severity", "fraud_reported", ] ] # Data Cleaning and One-Hot Encoding df = pd.get_dummies( df, columns=[ "insured_sex", "insured_relationship", "incident_type", "collision_type", "incident_severity", ], drop_first=True, ) df["fraud_reported"] = df["fraud_reported"].apply(lambda x: 1 if x == "Y" else 0) df = df.rename(columns={"incident_date": "timestamp", "fraud_reported": "target"}) for i in df.select_dtypes("number").columns: df[i] = df[i].apply(float) data = df[df["timestamp"] < "2015-02-20"].copy() val = df[df["timestamp"] >= "2015-02-20"].copy()In the code above, we select some columns for model training purposes, transform them into numerical representation, and split the data for reference (data) and current data (val).
We need reference or baseline data in the MLOps pipeline to monitor model performance. It’s usually the data separated from the training data (for example, test data). Also, we need the current data or the data unseen by the model (incoming data).
Let’s use evidently to monitor the data and the model performance. Because data drift would affect the model performance, it’s also something considered to monitor.
from evidently.report import Report from evidently.metric_preset import DataDriftPreset data_drift_report = Report(metrics=[ DataDriftPreset(), ]) data_drift_report.run(current_data=val, reference_data=data, column_mapping=None) data_drift_report.show(mode='inline') 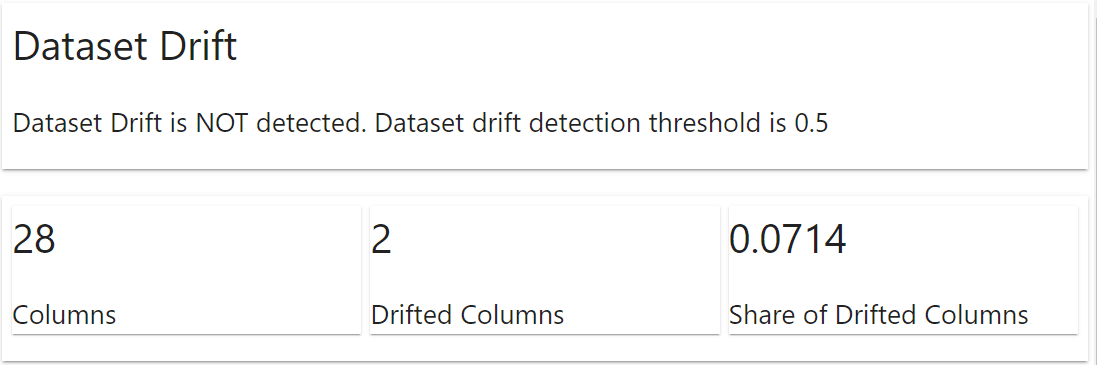
The evidently package would automatically show a report on what happened to the dataset. The information includes the dataset drift and the column drift. For the example above, we don’t have any dataset drift occurrence, but two columns drifted.
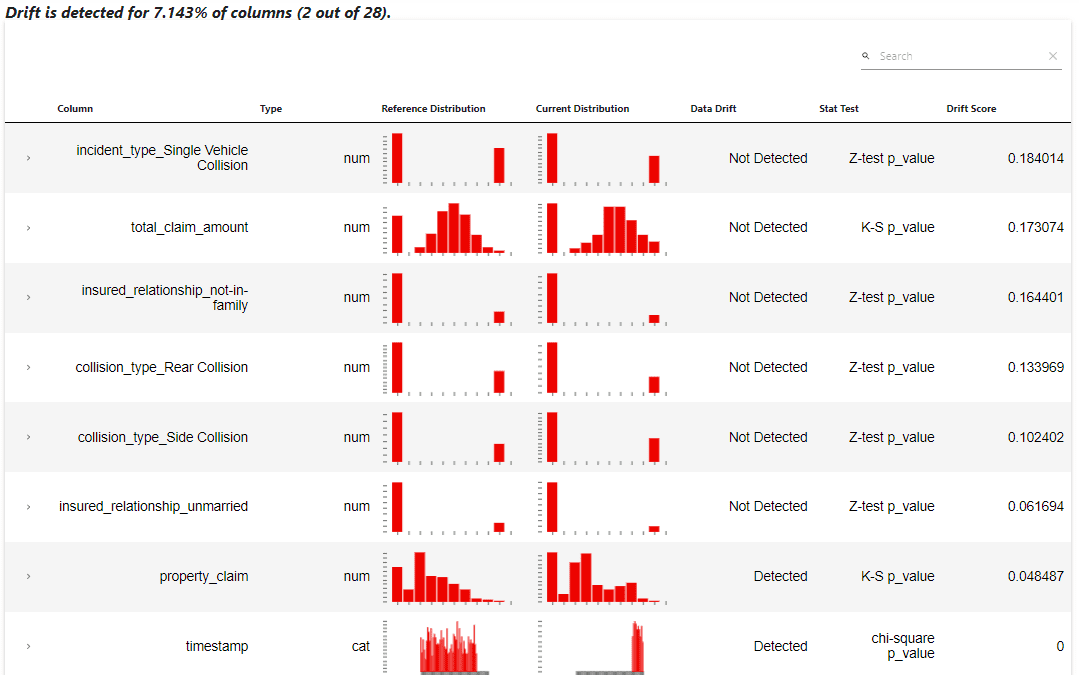
The report shows that the column ‘property_claim’ and ‘timestamp’ indeed have drift detected. This information can be used in the MLOps pipeline to retrain the model, or we still need a further data exploration.
If required, we can also acquire the data report above in the log dictionary object.
data_drift_report.as_dict()Next, let’s try to train a classifier model from the data and try to use evidently to monitor the model's performance.
from sklearn.ensemble import RandomForestClassifier rf = RandomForestClassifier() rf.fit(data.drop(['target', 'timestamp'], axis = 1), data['target'])Evidently would need both the target and prediction columns in the reference and the current dataset. Let’s add the model prediction to the dataset and use evidently to monitor the performance.
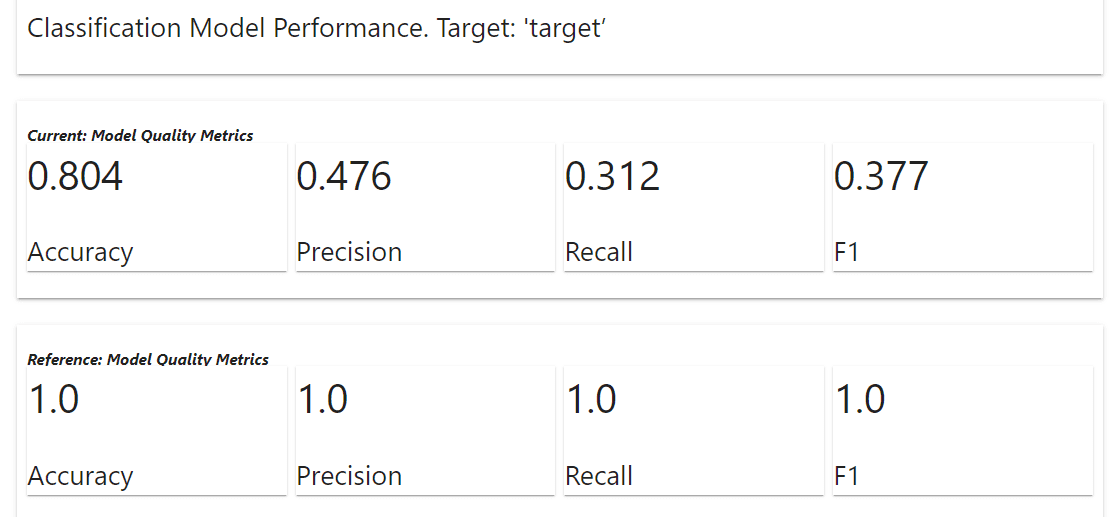
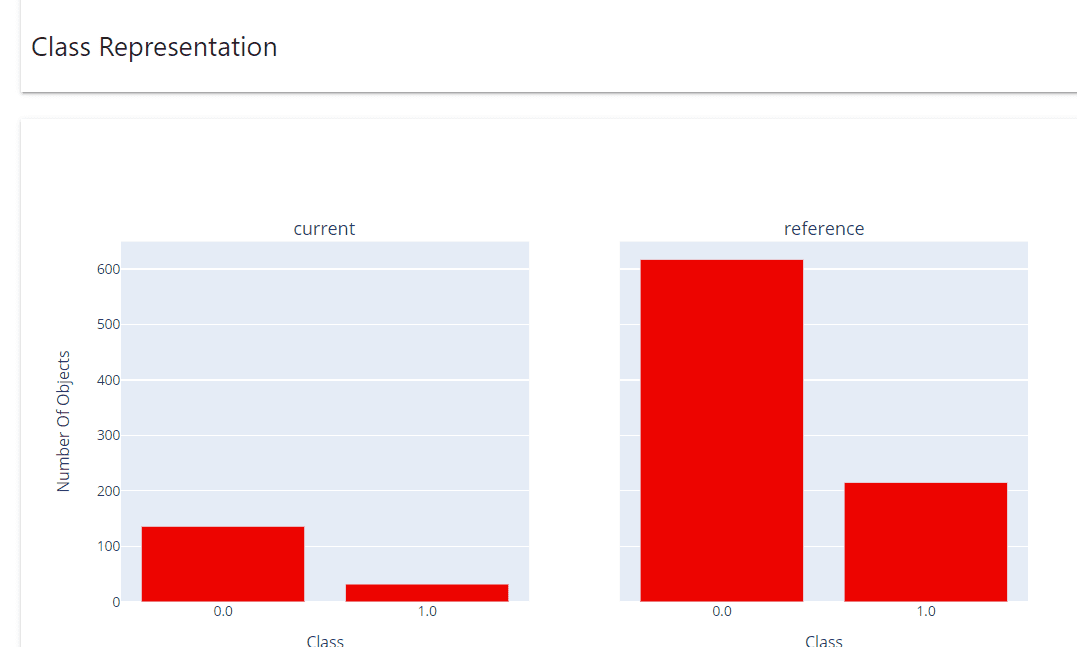
data['prediction'] = rf.predict(data.drop(['target', 'timestamp'], axis = 1)) val['prediction'] = rf.predict(val.drop(['target', 'timestamp'], axis = 1))As a note, it’s better to have the reference data that is not the training data for the actual cases to monitor the model performance. Let’s set up the model performance monitoring with the following code.
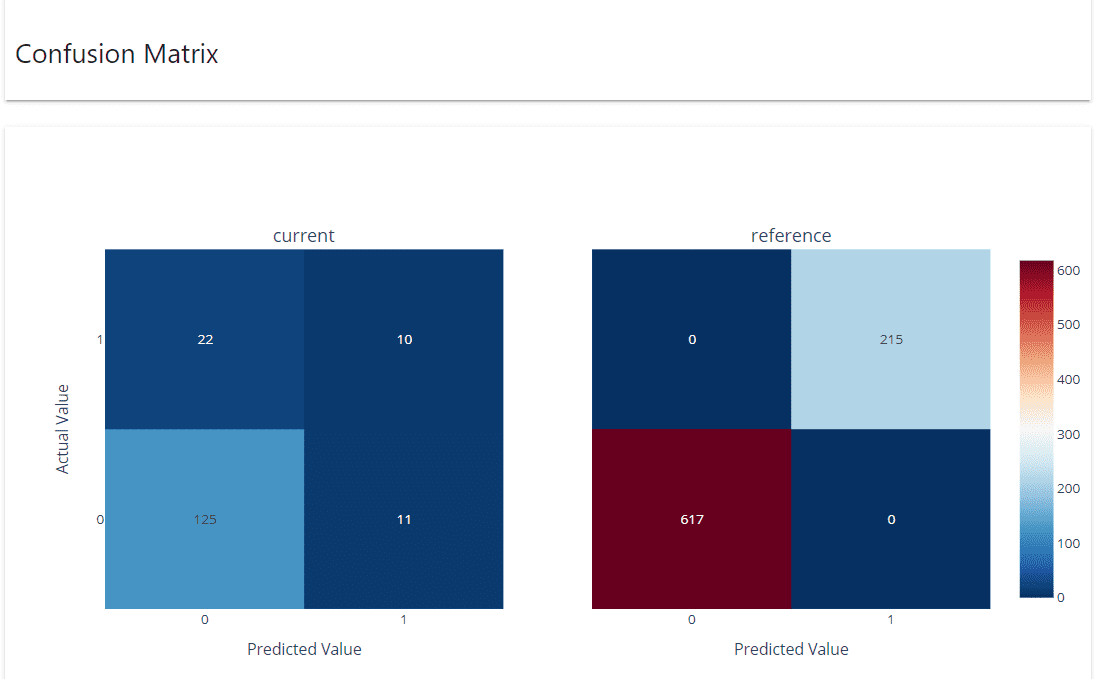
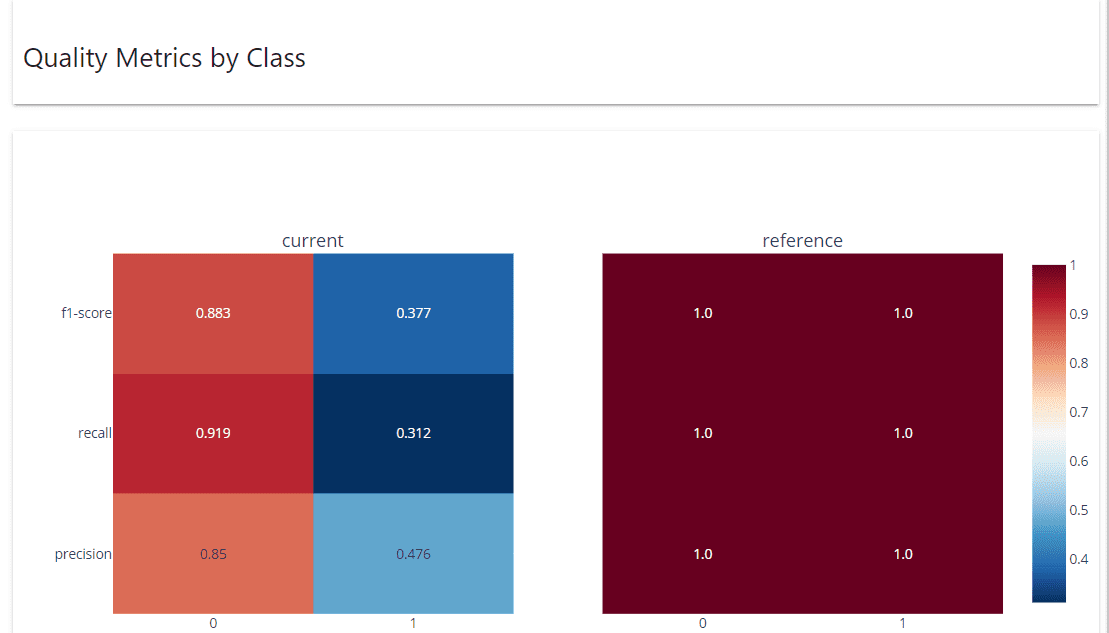
|

Latest News
- Monitor Model Performance in the MLOps Pipeline with Py…
- Build a ChatGPT-like Chatbot with These Courses
- 3 Ways to Access GPT-4 for Free
- From Data Analyst to Data Strategist: The Career Path f…
- Managing Model Drift in Production with MLOps
- Exploratory Data Analysis Techniques for Unstructured Data
Top Posts Last Week |
|---|

|
More Recent Posts
- Exploratory Data Analysis Techniques for Unstructured Data
- ChatGPT in Education: Friend or Foe?
- Vector and Matrix Norms with NumPy Linalg Norm
- How to Transition into Data Science from a Different Background?
- The Ultimate Open-Source Large Language Model Ecosystem
- KDnuggets News, May 3: Machine Learning with ChatGPT Cheat She…
- Can ChatGPT Be Trusted as an Educational Resource?
- ChatGPT as a Personalized Tutor for Learning Data Science Conc…
- HuggingChat Python API: Your No-Cost Alternative
- What is K-Means Clustering and How Does its Algorithm Work?
-
Related Posts
- How to Evaluate the Performance of Your Machine Learning Model
- 15 Python Snippets to Optimize your Data Science Pipeline
- Prefect: How to Write and Schedule Your First ETL Pipeline with Python
- KDnuggets™ News 20:n47, Dec 16: A Rising Library Beating Pandas in…
- SHAP: Explain Any Machine Learning Model in Python
- Explainable AI: 10 Python Libraries for Demystifying Your Model's Decisions
-
Get The Latest News!

Get the FREE ebook 'The Great Big Natural Language Processing Primer' and the leading newsletter on AI, Data Science, and Machine Learning, straight to your inbox.
By subscribing you accept KDnuggets Privacy Policy
Leave this field empty if you're human:
© 2023 Guiding Tech Media | About | Contact | Privacy Policy | Terms of Service
Published on May 9, 2023 by Cornellius Yudha Wijaya
Subscribe To Our Newsletter
(Get The Complete Collection of Data Science Cheat Sheets)
Leave this field empty if you're human: 

Get the FREE ebook 'The Great Big Natural Language Processing Primer' and the leading newsletter on AI, Data Science, and Machine Learning, straight to your inbox.
By subscribing you accept KDnuggets Privacy Policy
Leave this field empty if you're human:
Get the FREE ebook 'The Complete Collection of Data Science Cheat Sheets' and the leading newsletter on Data Science, Machine Learning, Analytics & AI straight to your inbox.
By subscribing you accept KDnuggets Privacy Policy
Leave this field empty if you're human: