
Image by Unsplash
In the machine learning process, data scaling falls under data preprocessing, or feature engineering. Scaling your data before using it for model building can accomplish the following:
- Scaling ensures that features have values in the same range
- Scaling ensures that the features used in model building are dimensionless
- Scaling can be used for detecting outliers
There are several methods for scaling data. The two most important scaling techniques are Normalization and Standardization.
Data Scaling Using Normalization
When data is scaled using normalization, the transformed data can be calculated using this equation
where and
are the maximum and minimum values of the data, respectfully. The scaled data obtained is in the range [0, 1].
Python Implementation of Normalization
Scaling using normalization can be implemented in Python using the code below:
from sklearn.preprocessing import Normalizer norm = Normalizer() X_norm = norm.fit_transform(data)Let X be a given data with and
. The data X is shown in the figure below:
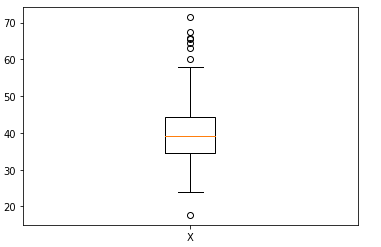
Figure 1. Boxplot of data X with values between 17.7 and 71.4. Image by Author.
The normalized X is shown in the figure below:
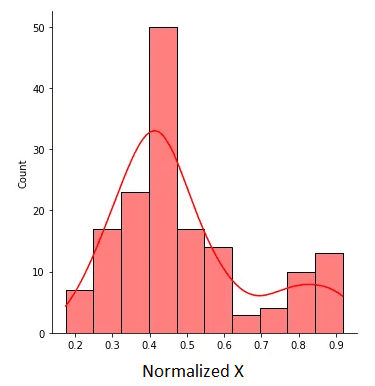
Figure 2. Normalized X with values between 0 and 1. Image by Author. Data Scaling Using Standardization
Ideally, standardization should be used when the data is distributed according to the normal or Guassian distribution. The standardized data can be calculated as follows:
Here, is the mean of the data, and
is the standard deviation. Standardized values should typically lie in the range [-2, 2], which represents the 95% confidence interval. Standardized values less than -2 or greater than 2 can be considered as outliers. Therefore, standardization can be used for outlier detection.
Python Implementation of Standardization
Scaling using standardization can be implemented in Python using the code below:
from sklearn.preprocessing import StandardScaler stdsc = StandardScaler() X_std = stdsc.fit_transform(data)Using the data described above, the standardized data is shown below:
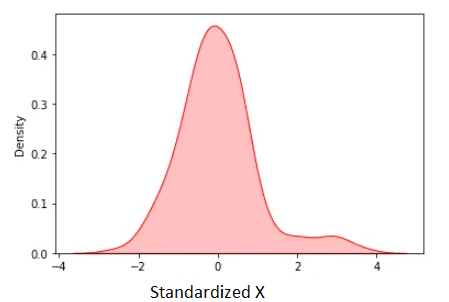
Figure 3. Standardized X. Image by Author.
The standardized mean is zero. We observe from the figure above that except for some few outliers, most of the standardized data lies in the range [-2, 2].
Conclusion
In summary, we’ve discussed two of the most popular methods for feature scaling, namely: standardization and normalization. Normalized data lies in the range [0, 1], while standardized data lies typically in the range [-2, 2]. The advantage of standardization is that it can be used for outlier detection.
Benjamin O. Tayo is a Physicist, Data Science Educator, and Writer, as well as the Owner of DataScienceHub. Previously, Benjamin was teaching Engineering and Physics at U. of Central Oklahoma, Grand Canyon U., and Pittsburgh State U.
- Scaling Data Management Through Apache Gobblin
- 5 Challenges to Scaling Machine Learning Models
- Scaling human oversight of AI systems for difficult tasks – OpenAI approach
- Microsoft and Google Open Sourced These Frameworks Based on Their Work…
- Step up your Python game with Fast Python for Data Science!
- Optimizing Python Code Performance: A Deep Dive into Python Profilers