Let us take a knowledge graph, or more generally any directed graph, and represent it as a matrix (see below).
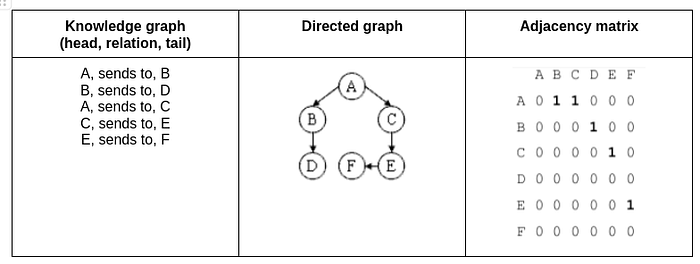
In matrix form we can see:
- it is upper triangular, thus there are no arcs going backwards.
- it is a binary matrix {0,1}, although we could have included weights if we had that data.
- the matrix is sparse, thus we can use sparse-aware algorithms to speed up processing.
- we can easily sum rows and columns to obtain data on what nodes are highly connected.
Finance examples
Users of financial knowledge graphs are interested in not just first degree connections, but second, third, and Nth degree connections.
Financial news and supplier connections
Assume a portfolio analyst monitors Company C0 and all published news reported on C0. This analyst is particularly astute and knows C1 is a supplier to C0 and watches for news reported on C1 as well (first order relationship). But is the analyst aware that yet another company, C2 supplies C1 (second order relationship)? C2 might seem to have a low impact to the analyst’s portfolio as it is 2 steps away and not an asset actually in the portfolio. However, a meaningful impact may exist for C0, if raw materials become unavailable at C2 or another distant connection, N steps away. This is similar to how mobile app development services can leverage knowledge graphs to assess risk in supply chains or dependencies within app ecosystems.
Below is a Thomson Reuters knowledge graph showing supplier relationships and a link to a news article.
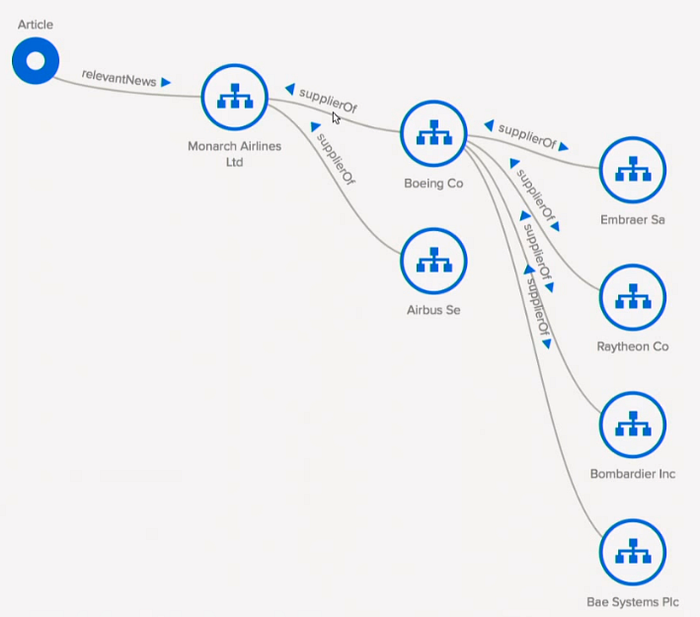
Source: Intelligent Recommendation Engine for Financial Analysts — Geoffrey Horrell, Thomson Reuters
Asset graph showing hidden allocations
Assume a portfolio analyst ensures the allocation of a particular company stock sits at X percent. However, the portfolio owns the stock via various paths. It owns the stock directly, it owns the stock indirectly through both mutual funds and ETFs, and it additionally has other exposures to the company through options on its stock. Some exposures may be less obvious to the analyst if they are Nth degree connections. Below is a knowledge graph showing such relationships.
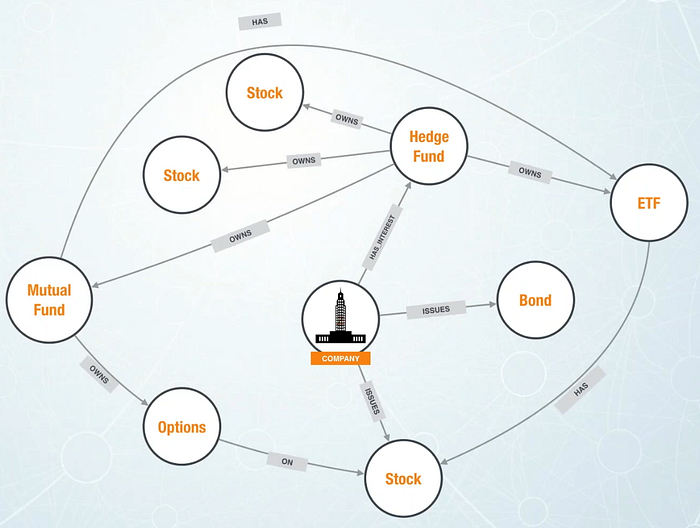
Source: Financial Markets are Graphs — Kevin Van Gundy, Neo4j
Using linear algebra to compute Nth degree connections
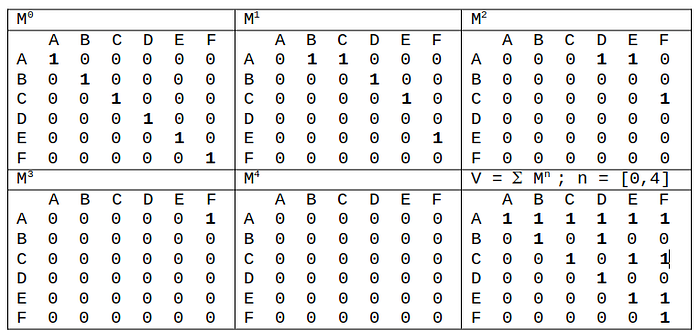
We can use Markov models, matrix multiplication, and the concept of visibility to compute the higher degree relationships. We can thus determine connections 2 steps away, 3 steps away, and N steps away. These “implicit connections” can be more visible in matrix form and allow further computations using linear algebra. Metrics such as graph density, and identification of nodes that are not highly connected at the first level, but are of high connection at higher levels can be found.
To find connections 2 steps away, compute M-squared. For 3 steps away, compute M-cubed. For connections at all levels, compute the visibility matrix, V, by summing all intermediate powers of M.
Quick computation of the visibility matrix
For simplicity, the visibility matrix can be computed in one step with the formula:
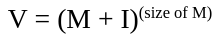
Where I is the Identity Matrix and all computations are treated as matrices with linear algebra, not arrays with simple arithmetic.
References
Papers:
MacCormack, Alan, Carliss Y. Baldwin, and J. Rusnak. “Exploring the Duality Between Product and Organizational Architectures: A Test of the ‘Mirroring’ Hypothesis.” Research Policy 41, no. 8 (October 2012): 1309–1324. (Link to working paper version)
Videos:
Horrell, Geoffrey, Intelligent Recommendation Engine for Financial Analysts, Thomson Reuters. Video id: MzGkfIfSrko
Shirokoff, David, Markov Matrices, MIT, Video id: wuyAeWE3iIM
Van Gundy, Kevin, Financial Markets are Graphs. Neo4j, Video id: U2VWd4fcSwM
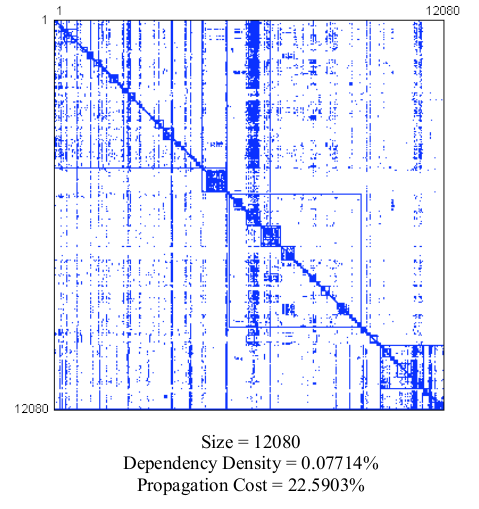
Appendix
An example graph in matrix form, with 12,080 entities and 112,567 relations, used in research at Harvard Business School. A clustering algorithm has also been applied (see the internal squares marked in the matrix).
Author
J. Joseph Rusnak received his Ph.D. and S.M degrees from Harvard University and his M.Eng. and S.B. degrees from the Massachusetts Institute of Technology.