Image by Editor Introduction
Snowflake is a SaaS, i.e., software as a service that is well suited for running analytics on large volumes of data. The platform is supremely easy to use and is well suited for business users, analytics teams, etc., to get value from the ever-increasing datasets. This article will go through the components of creating a streaming semi-structured analytics platform on Snowflake for healthcare data. We will also go through some key considerations during this phase.
Context
There are a lot of different data formats that the healthcare industry as a whole supports but we will consider one of the latest semi-structured formats i.e. FHIR (Fast Healthcare Interoperability Resources) for building our analytics platform. This format usually possesses all the patient-centric information embedded within 1 JSON document. This format contains a plethora of information, like all hospital encounters, lab results, etc. The analytics team, when provided with a queryable data lake, can extract valuable information such as how many patients were diagnosed with cancer, etc. Let’s go with the assumption that all such JSON files are pushed on AWS S3 (or any other public cloud storage) every 15 minutes through different AWS services or end API endpoints.
Architectural Design

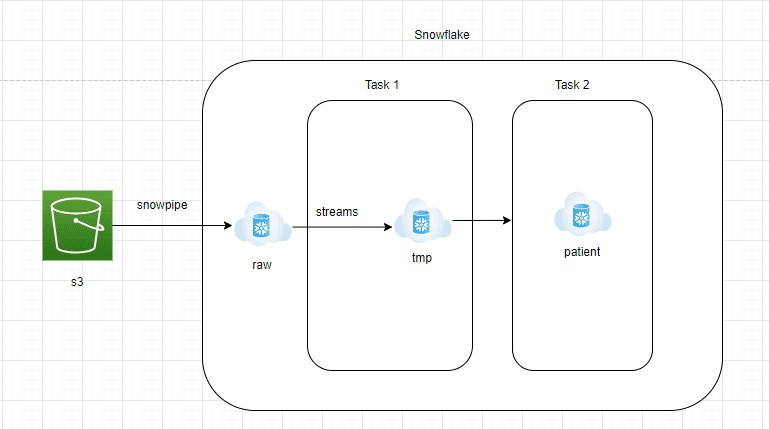
Architectural Components
- AWS S3 to Snowflake RAW zone:
- Data needs to be continuously streamed from AWS S3 into the RAW zone of Snowflake.
- Snowflake offers Snowpipe managed service, which can read JSON files from S3 in a continuous streaming way.
- A table with a variant column needs to be created in the Snowflake RAW zone to hold the JSON data in the native format.
- Snowflake RAW Zone to Streams:
- Streams is managed change data capture service which will essentially be able to capture all the new incoming JSON documents into Snowflake RAW zone
- Streams would be pointed to the Snowflake RAW Zone table and should be set to append=true
- Streams are just like any table and easily queryable.
- Snowflake Task 1:
- Snowflake Task is an object that is similar to a scheduler. Queries or stored procedures can be scheduled to run using cron job notations
- In this architecture, we create Task 1 to fetch the data from Streams and ingest them into a staging table. This layer would be truncated and reload
- This is done to ensure new JSON documents are processed every 15 minutes
- Snowflake Task 2:
- This layer will convert the raw JSON document into reporting tables that the analytics team can easily query.
- To convert JSON documents into structured format, the lateral flatten feature of Snowflake can be used.
- Lateral flatten is an easy-to-use function that explodes the nested array elements and can be easily extracted using the ‘:’ notation.
Key Considerations
- Snowpipe is recommended to be used with a few large files. The cost may go high if small files on external storage aren’t clubbed together
- In a production environment, ensure automated processes are created to monitor streams since once they go stale, data can’t be recovered from them
- The maximum allowed size of a single JSON document is 16MB compressed that can be loaded into Snowflake. If you have huge JSON documents that exceed these size limits, ensure you have a process to split them before ingesting them into Snowflake
Conclusion
Managing semi-structured data is always challenging due to the nested structure of elements embedded inside the JSON documents. Consider the gradual and exponential increase of the volume of incoming data before designing the final reporting layer. This article aims to demonstrate how easy it is to build a streaming pipeline with semi-structured data.
Milind Chaudhari is a seasoned data engineer/data architect who has a decade of work experience in building data lakes/lakehouses using a variety of conventional & modern tools. He is extremely passionate about data streaming architecture and is also a technical reviewer with Packt & O'Reilly.
- Sky's the Limit: Learn how JetBlue uses Monte Carlo and Snowflake to build…
- From Unstructured to Structured Data with LLMs
- A Structured Approach To Building a Machine Learning Model
- How to Create an Interactive Dashboard in Three Steps with KNIME Analytics…
- Introducing PostHog: An open-source product analytics platform
- Building a Structured Financial Newsfeed Using Python, SpaCy and Streamlit