Sponsored Post

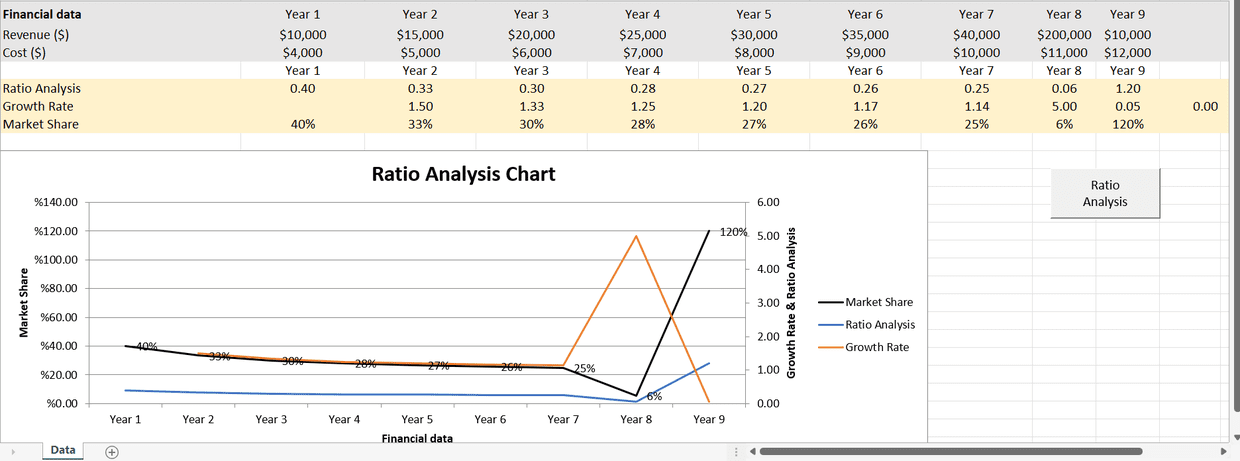
Copy and paste as many columns of your own data into the grey shaded cells of this template, and then click the "Ratio Analysis" button in the top right hand corner of the worksheet. Follow the prompts to create your own chart visualizing "Ratio Analysis", Growth Rate" and "Market Share" trends in your financial data. Great for Data Analysis Toolpak users.
You may need to do the following before using any templates:
- Enable or disable macros in Microsoft 365 files
- Unblock macros from downloaded files
Get the free Ratio Analysis Template here.
You might also try the FREE Simple Box Plot Graph and Summary Message Outlier and Anomaly Detection Template or FREE Outlier and Anomaly Detection Template. Or, automatically detect outliers, create a box & whisker plot graph, and receive a summary conclusion about dataset outliers with one button click using the Outlier Box Plot Graph Analysis Outlier and Anomaly Detection Template.
- Behavior Analysis with Machine Learning and R: The free eBook
- A Python Data Processing Script Template
- ORDAINED: The Python Project Template
- How to Make Sure Your Analysis Actually Gets Used
- The Lost Art of Decile Analysis
- Data Analysis Using Scala