

Image by Editor
Central tendency is the property of data to be distributed about a characteristic value. In data science and statistics, the two most important measures of central tendency are the mean and median.
Mean
For a dataset with N observations, the mean value is computed by adding all the data values and dividing by N. The mean value is easy to compute, but is highly susceptible to the presence of outliers in the dataset.
Median
The median is an important measure of central tendency that is less susceptible to the presence of outliers. The median value for a dataset can be determined by sorting the dataset and then determining the middle value such that 50% of the dataset values are less than the median value, and 50% are greater than the median value.
Calculating Mean and Median for a Dataset To illustrate the concept of central tendency, we calculate the mean and median for two datasets. The first dataset is a sample dataset with no outliers, and the second dataset is a sample dataset with outliers.
import numpy as np import matplotlib.pyplot as plt # generate some random data np.random.seed(1) data1 = np.random.uniform(0,10, 1000) data2 = np.append(data1, np.linspace(150,200,100)) data2 = np.append(data2, np.linspace(15,25,10)) data = list([data1, data2]) fig, ax = plt.subplots() # build a box plot ax.boxplot(data) ax.set_ylim(0,25) xticklabels=['sample data', 'sample data with outliers'] ax.set_xticklabels(xticklabels) # add horizontal grid lines ax.yaxis.grid(True) # show the plot plt.show() 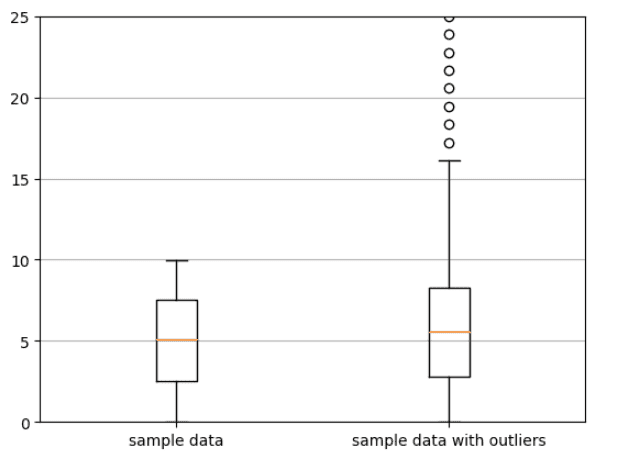
Box plot showing sample data with and without outliers. The small open circles represent the outliers. Image by Author.
# mean and median of sample data with no outliers np.mean(data1) >>> 5.006045994559051 np.median(data1) >>> 5.075008116147119 # mean and median of sample data with outliers np.mean(data2) >>> 20.455897292395537 np.median(data2) >>> 5.565300519330409We observe that the presence of outliers in the second dataset led to an increase in the mean value from 5.006 to 20.45, while the change in the median value from 5.075 to 5.565 was very small compared to the change in the mean value. This shows that the median value is a robust measure of central tendency as it is less susceptible to the presence of outliers in the dataset.
Summary
In summary, we have reviewed the two most important metrics for calculating central tendency. The mean value is easy to compute, but is highly susceptible to the presence of outliers in the dataset. The median is a robust measure of central tendency, and is less susceptible to the presence of outliers.
Benjamin O. Tayo is a Physicist, Data Science Educator, and Writer, as well as the Owner of DataScienceHub. Previously, Benjamin was teaching Engineering and Physics at U. of Central Oklahoma, Grand Canyon U., and Pittsburgh State U.
- Understanding Agent Environment in AI
- Understanding Transformers, the Data Science Way
- Understanding BERT with Hugging Face
- Understanding Iterables vs Iterators in Python
- Understanding Functions for Data Science
- Understanding by Implementing: Decision Tree