Image by Author What Is Unsupervised Learning?
In machine learning, unsupervised learning is a paradigm that involves training an algorithm on an unlabeled dataset. So there’s no supervision or labeled outputs.
In unsupervised learning, the goal is to discover patterns, structures, or relationships within the data itself, rather than predicting or classifying based on labeled examples. It involves exploring the inherent structure of the data to gain insights and make sense of complex information.
This guide will introduce you to unsupervised learning. We’ll start by going over the differences between supervised and unsupervised learning—to lay the ground for the remainder of the discussion. We’ll then cover the key unsupervised learning techniques and the popular algorithms within them.
Supervised vs. Unsupervised Learning
Supervised and unsupervised machine learning are two different approaches used in the field of artificial intelligence and data analysis. Here's a brief summary of their key differences:
Training Data
In supervised learning, the algorithm is trained on a labeled dataset, where input data is paired with corresponding desired output (labels or target values).
Unsupervised learning, on the other hand, involves working with an unlabeled dataset, where there are no predefined output labels.
Objective
The goal of supervised learning algorithms is to learn a relationship—a mapping—from the input to the output space. Once the mapping is learned, we can use the model to predict the output values or class label for unseen data points.
In unsupervised learning, the goal is to find patterns, structures, or relationships within the data, often for clustering data points into groups, exploratory analysis or feature extraction.
Common Tasks
Classification (assigning a class label—one of the many predefined categories—to a previously unseen data point) and regression (predicting continuous values) are common tasks in supervised learning.
Clustering (grouping similar data points) and dimensionality reduction (reducing the number of features while preserving important information) are common tasks in unsupervised learning. We’ll discuss these in greater detail shortly.
When To Use
Supervised learning is widely used when the desired output is known and well-defined, such as spam email detection, image classification, and medical diagnosis.
Unsupervised learning is used when there is limited or no prior knowledge about the data and the objective is to uncover hidden patterns or gain insights from the data itself.
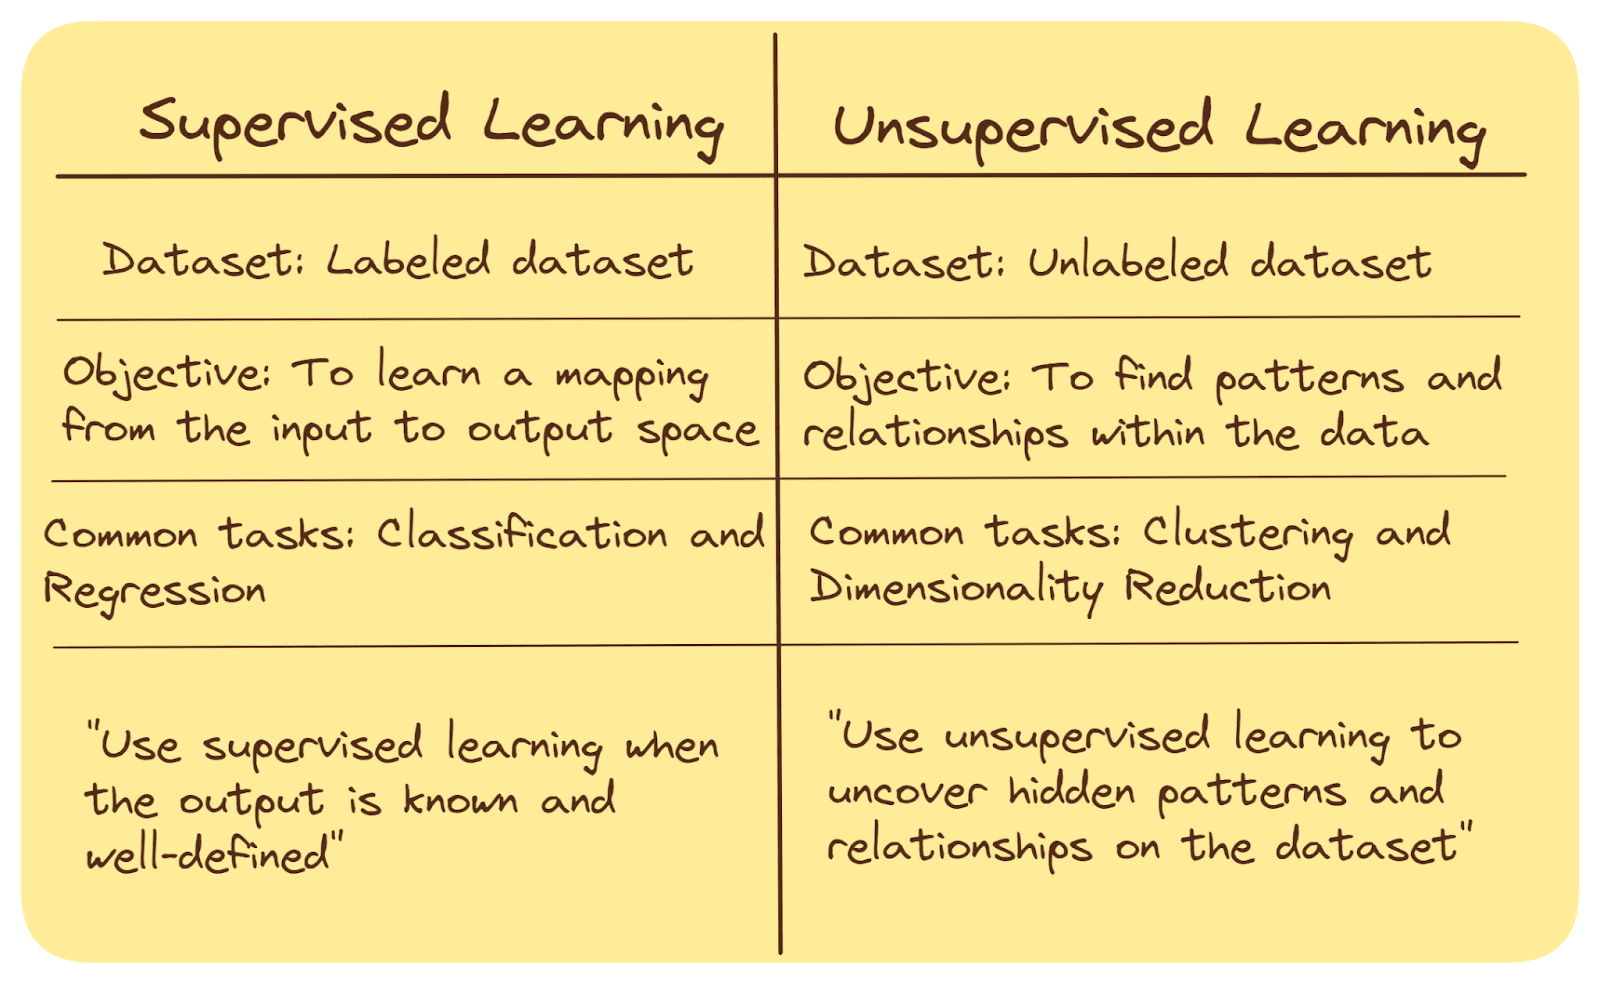
Here’s a summary of the differences:

Supervised vs. Unsupervised Learning | Image by Author
Summing up: Supervised learning focuses on learning from labeled data to make predictions or classifications, while unsupervised learning seeks to discover patterns and relationships within unlabeled data. Both approaches have their own applications—based on the nature of the data and the problem at hand.
Unsupervised Learning Techniques
As discussed, in unsupervised learning, we have the input data and are tasked with finding meaningful patterns or representations within that data. Unsupervised learning algorithms do so by identifying similarities, differences, and relationships among the data points without being provided with predefined categories or labels.
For this discussion, we’ll go over the two main unsupervised learning techniques:
- Clustering
- Dimensionality Reduction
What Is Clustering?
Clustering involves grouping similar data points together into clusters based on some similarity measure. The algorithm aims to find natural groups or categories within the data where data points in the same cluster are more similar to each other than to those in other clusters.
Once we have the dataset grouped into different clusters we can essentially label them. And if needed, we can perform supervised learning on the clustered dataset.
What Is Dimensionality Reduction?
Dimensionality reduction refers to techniques that reduce the number of features—dimensions—in the data while preserving important information. High-dimensional data can be complex and difficult to work with, so dimensionality reduction helps in simplifying the data for analysis.
Both clustering and dimensionality reduction are powerful techniques in unsupervised learning, providing valuable insights and simplifying complex data for further analysis or modeling.
In the remainder of the article, let's review important clustering and dimensionality reduction algorithms.
Clustering Algorithms: An Overview
As discussed, clustering is a fundamental technique in unsupervised learning that involves grouping similar data points together into clusters, where data points within the same cluster are more similar to each other than to those in other clusters. Clustering helps identify natural divisions within the data, which can provide insights into patterns and relationships.
There are various algorithms used for clustering, each with its own approach and characteristics:
K-Means Clustering
K-Means clustering is a simple, robust, and commonly used algorithm. It partitions the data into a predefined number of clusters (K) by iteratively updating cluster centroids based on the mean of data points within each cluster.
It iteratively refines cluster assignments until convergence.
Here’s how the K-Means clustering algorithm works:
- Initialize K cluster centroids.
- Assign each data point—based on the chosen distance metric—to the nearest cluster centroid.
- Update centroids by computing the mean of data points in each cluster.
- Repeat steps 2 and 3 until convergence or a defined number of iterations.
Hierarchical Clustering
Hierarchical clustering creates a tree-like structure—a dendrogram—of data points, capturing similarities at multiple levels of granularity. Agglomerative clustering is the most commonly used hierarchical clustering algorithm. It starts with individual data points as separate clusters and gradually merges them based on a linkage criterion, such as distance or similarity.
Here’s how the agglomerative clustering algorithm works:
- Start with `n` clusters: each data point as its own cluster.
- Merge closest data points/clusters into a larger cluster.
- Repeat 2. until a single cluster remains or a defined number of clusters is reached.
- The result can be interpreted with the help of a dendrogram.
Density-Based Spatial Clustering of Applications with Noise (DBSCAN)
DBSCAN identifies clusters based on the density of data points in a neighborhood. It can find arbitrarily shaped clusters and can also identify noise points and detect outliers.
The algorithm involves the following (simplified to include the key steps):
- Select a data point and find its neighbors within a specified radius.
- If the point has sufficient neighbors, expand the cluster by including the neighbors of its neighbors.
- Repeat for all points, forming clusters connected by density.
Dimensionality Reduction Algorithms: An Overview
Dimensionality reduction is the process of reducing the number of features (dimensions) in a dataset while retaining essential information. High-dimensional data can be complex, computationally expensive, and is prone to overfitting. Dimensionality reduction algorithms help simplify data representation and visualization.
Principal Component Analysis (PCA)
Principal Component Analysis—or PCA—transforms data into a new coordinate system to maximize variance along the principal components. It reduces data dimensions while preserving as much variance as possible.
Here’s how you can perform PCA for dimensionality reduction:
- Compute the covariance matrix of the input data.
- Perform eigenvalue decomposition on the covariance matrix. Compute the eigenvectors and eigenvalues of the covariance matrix.
- Sort eigenvectors by eigenvalues in descending order.
- Project data onto the eigenvectors to create a lower-dimensional representation.
t-Distributed Stochastic Neighbor Embedding (t-SNE)
The first time I used t-SNE was to visualize word embeddings. t-SNE is used for visualization by reducing high-dimensional data to a lower-dimensional representation while maintaining local pairwise similarities.
Here's how t-SNE works:
- Construct probability distributions to measure pairwise similarities between data points in high-dimensional and low-dimensional spaces.
- Minimize the divergence between these distributions using gradient descent. Iteratively move data points in the lower-dimensional space, adjusting their positions to minimize the cost function.
In addition, there are deep learning architectures such as autoencoders that can be used for dimensionality reduction. Autoencoders are neural networks designed to encode and then decode data, effectively learning a compressed representation of the input data.
Some Applications of Unsupervised Learning
Let’s explore some applications of unsupervised learning. Here are some examples:
Customer Segmentation
In marketing, businesses use unsupervised learning to segment their customer base into groups with similar behaviors and preferences. This helps tailor marketing strategies, campaigns, and product offerings. For example, retailers categorize customers into groups such as "budget shoppers," "luxury buyers," and "occasional purchasers."
Document Clustering
You can run a clustering algorithm on a corpus of documents. This helps group similar documents together, aiding in document organization, search, and retrieval.
Anomaly Detection
Unsupervised learning can be used to identify rare and unusual patterns—anomalies—in data. Anomaly detection has applications in fraud detection and network security to detect unusual—anomalous—behavior. Detecting fraudulent credit card transactions by identifying unusual spending patterns is a practical example.
Image Compression
Clustering can be used for image compression to transform images from high-dimensional color space to a much lower dimensional color space. This reduces image storage and transmission size by representing similar pixel regions with a single centroid.
Social Network Analysis
You can analyze social network data—based on user interactions—to uncover communities, influencers, and patterns of interaction.
Topic Modeling
In natural language processing, the task of topic modeling is used to extract topics from a collection of text documents. This helps categorize and understand the main themes—topics—within a large text corpus.
Say, we have a corpus of news articles and we don’t have the documents and their corresponding categories beforehand. So we can perform topic modeling on the collection of news articles to identify topics such as politics, technology, and entertainment.
Genomic Data Analysis
Unsupervised learning also has applications in biomedical and genomic data analysis. Examples include clustering genes based on their expression patterns to discover potential associations with specific diseases.
Conclusion
I hope this article helped you understand the basics of unsupervised learning. The next time you work with a real-world dataset, try to figure out the learning problem at hand. And try to assess if it can be modeled as a supervised or an unsupervised learning problem.
If you’re working with a dataset with high-dimensional features, try to apply dimensionality reduction before building the machine learning model. Keep learning!
Bala Priya C is a developer and technical writer from India. She likes working at the intersection of math, programming, data science, and content creation. Her areas of interest and expertise include DevOps, data science, and natural language processing. She enjoys reading, writing, coding, and coffee! Currently, she's working on learning and sharing her knowledge with the developer community by authoring tutorials, how-to guides, opinion pieces, and more.
- Unsupervised Learning for Predictive Maintenance using Auto-Encoders
- Unsupervised Disentangled Representation Learning in Class Imbalanced…
- Exploring Unsupervised Learning Metrics
- Clustering with scikit-learn: A Tutorial on Unsupervised Learning
- Unveiling the Potential of CTGAN: Harnessing Generative AI for Synthetic…
- Unveiling Midjourney 5.2: A Leap Forward in AI Image Generation